Article Text

Abstract
Background Nasal intermittent positive pressure ventilation (NIPPV) is a mode of non-invasive respiratory support. Its mechanisms of action and optimal delivery techniques are unknown.
Aim This observational study aimed to investigate and quantify delivered peak pressures during non-synchronised ventilator-generated NIPPV.
Methods Infants born below 30 weeks gestation receiving ventilator-generated NIPPV delivered via Hudson prongs were recruited. Intraprong pressure, change in tidal volume, respiratory rate, oxygen saturations, inspired oxygen and video images were recorded.
Results Eleven infants (four infants were female) of median (interquartile range; IQR) gestational age 25±3 (25±2 26+/-0) weeks and birth weight 732 (699–895) g, were studied at 24 (19–41) days of age. Six infants, with set peak pressure (peak inflation pressure; PIP) of 20 cm H2O, received a median pressure of 15.9 (IQR 13.6–17.9) cm H2O. 37% of inflations were delivered at least 5 cm H2O below set PIP. 12.7% of inflations were delivered above set PIP. Five infants with set PIP of 25 cm H2O received a median PIP of 17.2 (IQR 15.0–18.3) cm H2O. 83% of inflations were delivered at least 5 cm H2O below set PIP, with 6.1% delivered higher than set PIP. The difference in delivered PIP between the groups was 1.3 cm H2O. PIP was highest and most variable when the infant was moving. Delivered PIP did not vary whether it coincided with spontaneous inspiration or expiration.
Conclusion During ventilator-generated non-synchronised NIPPV delivered PIP was variable and frequently lower than set PIP. Delivered PIP was occasionally greater than set PIP.
Statistics from Altmetric.com
Non-invasive methods of respiratory support are increasingly used in premature infants, aimed at preventing or reducing endotracheal intubation, ventilation and the risk of lung damage.
Nasal intermittent positive pressure ventilation (NIPPV) is one method of non-invasive support. Although there are many variations of this technique, the basic premise is the delivery of nasal continuous positive airway pressure (CPAP) combined with intermittent brief increases in pressure, to a set peak inflation pressure (PIP). Systems exist that aim to synchronise the pressure increases with an infant's inspiration. Recent surveys in England1 and Spain2 have indicated that approximately half the large neonatal intensive care units are using NIPPV.
There is evidence that NIPPV reduces the rates of re-intubation following extubation, compared with CPAP alone.3 There is emerging evidence that NIPPV may play a role as a first-line respiratory support4 5 for preterm infants after birth, reducing intubation rates and rates of chronic lung disease.4,–,6 Randomised trials are investigating this hypothesis.
What is already known on this topic
▶. NIPPV combines nasal CPAP with brief intermittent increases in pressure, to a set PIP. NIPPV reduces extubation failure and may reduce rates of borderline personality disorder.
▶. Optimal ventilator settings, mode of NIPPV delivery and mechanisms of action are yet to be determined.
What this study adds
▶. Delivered PIP during non-synchronised ventilator-delivered NIPPV is very variable and is usually much lower than the set inflation pressure.
▶. Delivered PIP is only slightly higher with higher set inflation pressures. Delivered PIP rise during movements, but do not vary between spontaneous inspiration and expiration.
Little is known about the mechanism of action of neonatal NIPPV, and how to deliver it effectively. Adult,7 8 neonatal animal7 8 and neonatal human9 data have shown that improving minute ventilation using NIPPV is not straightforward, as a result of active glottic closure. Human neonatal studies have suggested that ‘synchronised’ NIPPV improves thoraco-abdominal asynchrony,10 tidal volume and minute ventilation,11 and provides small improvements in oxygen saturation, respiratory rate, carbon dioxide levels and reduces the work of breathing.11,–,14 Ryan et al15 observed that the delivered inflation pressure was very variable during NIPPV and pressures of 20 cm H2O did not reliably inflate the chest.
Previous studies of NIPPV have used a range of set peak pressures from 10 cm H2O13 to 25 cm H2O,16 at ventilator rates of 10 to 30 inflations/min,4 10 and inflation times of 0.3–0.6 s.4 10 12 17 No study has determined the most effective and safe settings.18
NIPPV pressures can be generated using either a ventilator or an adapted CPAP device. There is currently no evidence to suggest that one method is superior to another.19 In 2006 we surveyed 95 neonatal units in England1 and found that 11% of those using NIPPV used ventilator-generated NIPPV. In the UK the remainder used adapted CPAP devices (SiPAP and/or its predecessor—Infant Flow Advance; Cardinal Health, Tulsa, Oklahoma, USA), at rates up to 60/min, with a short inflation time, and on average a 5 cm H2O differential between the set PIP and baseline CPAP. There are no data describing the relative frequency of different modes of NIPPV delivery in other countries.
NIPPV may be delivered to the nose by means of short binasal prongs, nasal masks or nasopharyngeal prongs. No studies have compared the pressure delivered by different devices.
The aim of this study was to measure the delivered pressure and investigate reasons for any pressure variations during ventilator-generated NIPPV delivered by means of short binasal prongs.
Methods
Study population
Infants receiving ventilator-delivered NIPPV were eligible for this observational study. We enrolled infants who were born below 30 weeks gestation, who were more than 48 h old, and who did not have any major congenital abnormalities or neuromuscular disease.
The study was conducted at the Royal Women's Hospital in Melbourne, Australia, and was approved by the Research and Ethics Committees. All infants were recruited following informed written parental consent. The 11 infants reported in this study were the first 11 patients recruited for a series of crossover studies investigating NIPPV delivery.
NIPPV delivery
Non-synchronised NIPPV was generated using a Dräger Babylog 8000plus ventilator (Dräger Medical, Lübeck, Germany) in continuous mandatory ventilation mode. The NIPPV settings were determined by the clinical team and were in the range normally used in the Royal Women's Hospital intensive care nursery for NIPPV: PIP 20–25 cm H2O, positive end expiratory pressures (PEEP) 6–8 cm H2O, inflation time of 0.3 s, inflation rates 10–40/min and circuit gas flow 8–12 l/min. No changes were made to the ventilator settings, or the infant position, during the study period.
NIPPV was delivered by appropriately sized Hudson prongs (Teleflex Medical, North Carolina, Durham, USA). Nursing staff used the manufacturer's recommendations to guide the choice of prong size, then made a judgement on the best prong fit without inducing blanching of the nares. The prongs were secured with a CPAP hat and chin strap (CPAP CAP System; Austranter Medical System, ACT, Australia).
Measurements
Delivered pressure was measured using a calibrated Florian respiratory function monitor (Acutronic Medical Systems AG, Zug, Switzerland) sampling from the inspiratory limb of the Hudson prong. Spontaneous breathing and tidal volume were recorded using respiratory inductance plethysmography (RIP; Somnostar; SensorMedics, Anaheim, California, USA). This records impedance change in the chest and abdomen, which when added together to form the ‘sum’ trace, representing tidal volume (respiration bands, Respiband Plus and RIP, Sensormedics Corp, Yorba Linda, California, USA). The respiratory rate was recorded using an abdominal capsule (Graseby respiration monitor MR10; Graseby Medical, Watford, England). Oxygen saturation was measured with a Masimo Radical SET pulse oximeter (Masimo, Irvine, California, USA) and the inspired oxygen using an oxygen analyser (MX300 oxygen analyser; Teledyne Analytical Instruments, City of Industry, California, USA) inserted into the inspiratory limb of the circuit. A web-cam (QuickCam 6.4.8; Logitech, Romanel-sur-Morges, Switzerland) was placed on the outside of the incubator and video images of the infant's face, chest and abdomen were captured at six frames/s. Data were continuously sampled at 200 Hz, digitised and recorded using Spectra software (Grove Medical, London, UK). Each infant was studied for 30 min.
Data analysis
Demographic and comparative data are summarised as medians and interquartile ranges (IQR). Continuous variables were analysed using Mann–Whitney U tests for comparisons of medians. Analyses of correlations used linear regression. Video, RIP and Graseby signal data were used to define episodes of absent respiratory effort and chest movement. Comparison of RIP signals with delivered ventilator pressure data required operator identification of artefact. To eliminate bias, the first 30 consecutive artefact-free inflations for each infant were analysed to determine whether the mechanical inflation was delivered during spontaneous inspiration or expiration. Statistical comparisons were made using the STATA statistical package, version 10.
Results
The demographic details of the 11 preterm infants studied are shown in table 1. Four infants were female; their median (IQR) gestational age, birth weight, day of study and study weight was 25+3 (25+2–26+0) weeks, 732 (699–895) g, 24 (19–41) days and 1095 (965–1116) g, respectively. All infants were studied supine, except one (infant 7) and all had been ventilated by means of an endotracheal tube before the study for a median (IQR) of 8 (4–19) days and were receiving caffeine. At the time of the study infants had been receiving NIPPV for 9 (5–13) days. In total, 9456 mechanical inflations were recorded and analysed.
Demographic data and NIPPV settings
Six infants had a set PIP of 20 cm H2O and five were set at 25 cm H2O. Inflation rates and PEEP ranged from 10 to 40/min and 6 to 8 cm H2O (table 1). The delivered PIP was very variable both within and between infants (figure 1). The infants with a set PIP of 20 cm H2O received a median delivered PIP of 15.9 cm H2O (IQR 13.6–17.9 and range 8.2–29.0 cm H2O) over 4682 inflations. Infants with a set PIP of 25 cm H2O received a median of 17.2 cm H2O (IQR 15.0–18.3 and range 9.1–32.0 cm H2O) over 4774 inflations. One infant, whose set PIP was 25 cm H2O, had consistently high delivered pressures with a median of 24.9 (range 23.1–32.0) cm H2O.

Box and whisker plot demonstrating the median, interquartile range (IQR) and range of delivered pressures for each infant (shaded boxes denote infants with set pressure 20 cm H2O, open boxes denote infants with set pressure 25 cm H2O). Boxes denote median and IQR. PIP, peak inflation pressure.
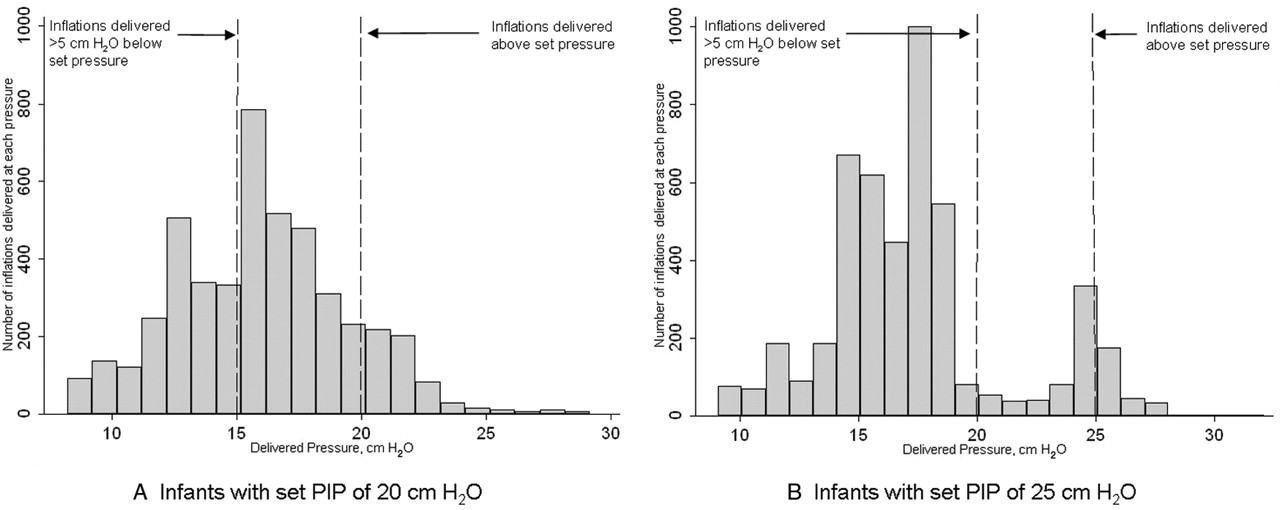
Of the infants with a set PIP of 20 cm H2O, 37% of inflations were delivered at least 5 cm H2O below set pressure, that is, below 15 cm H2O (figure 2). The infants with set PIP of 25 cm H2O received 83% of inflations at a PIP at least 5 cm H2O below set pressure, which is, below 20 cm H2O, including 26% of inflations delivered more than 10 cm H2O below set pressure, that is, below 15 cm H2O. The difference in the median delivered pressures between the infants whose set pressures were 20 and 25 cm H2O was statistically significant, although very small; 1.3 cm H2O (p<0.001).

Histograms showing delivered inflation pressures, at set peak inflation pressure (PIP) 20 cm H2O (A), and set PIP 25 cm H2O (B), demonstrating the proportion of inflations both above set pressure, and more than 5 cm H2O below set pressure.
In both groups there were inflations in which the delivered pressure was greater than the set pressure; 12.7% of inflations for infants whose set pressure was 20 cm H2O (maximum 29.0 cm H2O) and 6.1% of inflations for infants whose set pressure was 25 cm H2O (maximum 32.0 cm H2O).
The video recordings were analysed in detail. Delivered pressure varied considerably even when the infant appeared quiet or sleeping and the amount of mouth opening did not visibly change. The RIP and Graseby respiratory traces demonstrated a stable respiratory pattern at these times. No externally visible changes could be seen that would account for the variations in delivered pressure (figure 3).

A 50 s recording demonstrating quiet artefact-free breathing. Delivered peak inflation pressure (PIP) range 14.9–20.2 cm H2O (set PIP 25 cm H2O), tidal volume and oxygen saturation remain stable. Mechanical inflation rate is 30/min with a spontaneous respiratory rate of 72 breaths/min. RIP, respiratory inductance plethysmography.
Sections of recording in which the delivered PIP was highest were examined. We found that the highest and most variable delivered pressure was seen during periods of infant movement; as shown by video and RIP waveform data. As movements ceased the delivered pressures fell back to the previous lower level. It was not possible to discern whether the infants were breathing during the episodes of motor activity. It was noted that following episodes of movement oxygen desaturation occurred (figure 4) making it possible that these episodes were caused by reduced leak or obstructive apnoea. The onset of movement occurred before the delivered pressure increased. There was no clear change in delivered PIP during the apnoeas when there was cessation of chest and abdominal movement (figure 5). These episodes without respiratory effort were most likely to be central apnoeas without glottic closure, and demonstrate rapid falls in oxygen saturation.

Eight minutes of recording showing episodes of increased delivered pressure during movement (A). Corresponding video data showed gross limb and truncal movements at these times. It was not possible to ascertain whether respiratory movements were also occurring, but each episode of movement was followed by a period of desaturation (B). (Set peak inflation pressure 20 cm H2O, set inflation rate 10/min). RIP, respiratory inductance plethysmography.

A 2-min recording showing periodic breathing, stable delivered pressure and fluctuating oxygen saturations. (Set peak inflation pressure 20 cm H2O, inflation rate 20/min). The loss of end-expiratory lung volume, denoted by the drop in baseline of the respiratory inductance plethysmography (RIP) sum trace at the onset of apnoea suggests central apnoea with an open glottis.
There were no correlations between the prong size and either delivered pressure, duration of nasal prong support or infant weight. Nor were there correlations between delivered pressure and circuit gas flow or duration of nasal prong support.
There was no significant difference between the pressures delivered during spontaneous expiration (15.3 cm H2O) compared with pressures delivered during spontaneous inspiration (15.6 cm H2O), p=0.40.
Discussion
The aim of this observational study was to determine the range and variability of delivered pressure when using ventilator-delivered NIPPV. We have shown that the pressure delivered by mechanical inflations is very variable and consistently below the set pressure. It is possible that subtle changes in leak, as a result of changes in laryngeal resistance and glottic size, could account for the changes seen. Previous studies have shown that leaks at the mouth and nose are large and variable20 21 and make the delivery of CPAP pressures unreliable.22 Similar nasal interfaces are used during NIPPV, therefore leak could account for the pressure variation we observed. In our study all infants had a chin strap fitted in an attempt to control leak from the mouth. However, it was clear from the video images that infants were still able to open their mouths. Reber21 also found that leak was not reduced when the mouth was closed using a chin strap. One infant, with a set pressure of 25 cm H2O, achieved stable delivered pressures at the desired pressure. The video images of this infant confirm that the chin strap held the mouth closed. Other infants in this study also appeared to have the same degree of mouth closure with the chin strap. It was not clear why this particular infant had such consistent pressure delivery, but it does demonstrate that it may be possible to achieve and maintain the set PIP.
We found little difference between delivered pressure whether the PIP was set at 25 or 20 cm H2O. It is likely that as the set PIP is increased the gas leak at the mouth and nose also increases, resulting in minimal change in the delivered pressure. This hypothesis is consistent with previous work demonstrating increasing leak with higher CPAP pressures.21 It is very difficult to measure leak accurately when using nasal prong NIPPV. We did not examine different set pressures within the same infant, so we cannot be certain that increased leak accounted for the lack of difference we demonstrated between the set PIP of 20 and 25 cm H2O. It is important for the clinician to be aware that a higher set pressure resulted in only a slightly higher pressure delivery to the infant. We suggest that increasing the set PIP, with the aim of increasing the support to the infant, may have little practical benefit. Different prong size and circuit gas flow did not result in increased delivered pressures. Further studies are required to determine whether increasing set PIP or circuit flow within an individual infant, or using alternative strategies such as attempting to synchronise inflations with the infant's spontaneous inspiration, result in improved delivered pressure.
In this sample the size of the Hudson prong used did not correlate with either the length of time the infant had received Hudson prong support, or the infant weight. Suggested prong sizes are provided by the manufacturer, and nursing staff use this as a guide. There was no correlation between the number of days the infant had been receiving nasal prong support and the median delivered pressure; however, it is possible that the size and shape of the infant's nostril changes during the course of nasal support making it difficult to fit prongs consistently to infants receiving CPAP or NIPPV.23
We observed that 12.7% of mechanical inflations exceeded the set pressure, by up to 9 cm H2O. This can be explained by the mode of operation of the Babylog ventilator, which tolerates 5 mbar (5.1 cm H2O) above set pressure for 0.33 s before venting the CPAP circuit. If the leak is suddenly reduced the delivered pressure rises for an inflation or two, while the ventilator resets the expiratory valve. This is an important safety consideration.
The set peak NIPPV pressures used in this study were within the range of pressures used in previous studies, although no effective or safe limit has ever been determined.18 Some of the high pressures we measured exceeded the highest pressures previously studied during NIPPV. There is some evidence to suggest that increased pressure has greater benefits in terms of reducing the work of breathing,13 but further studies would be needed to establish whether pressures as high as we have seen are safe or advantageous.
We found delivered PIP was highest when the infant was moving. However, as oesophageal pressure (a proxy for transpleural pressure) was not measured in this study it is not possible to know whether these high pressures were transmitted to the lungs. A previous study, examining CPAP pressure transmission using Hudson prongs, demonstrated a fall in pressure of 2–3 cm H2O due to resistance across the prong device alone.24 A further pressure drop of 2–3 cm H2O between the prong and the pharynx could be expected,20 most likely due to leak. Therefore, it is likely that much lower pressures reached the pharynx than we recorded at the prong. The delivered PIP may rise during movement as a result of sudden leak reduction, for example, by spontaneous mouth closure, glottic closure or obstructive apnoea. If either of the latter were the cause then the observed high pressures at the prong are unlikely to have entered the chest.
Adult studies have shown that high delivered PIP can produce glottic adduction and narrowing of the airway, and may not result in increased minute ventilation.25 26 The variations in delivered pressure that we measured may also represent fluctuating glottic resistance. Figure 4 demonstrates the onset of movement before the onset of high delivered PIP, making it more likely that high delivered PIP was due to a reduced leak or glottic closure rather than glottic narrowing in response to high PIP. We observed modest oxygen desaturation following these periods of movement and high delivered PIP, suggesting some degree of obstructive apnoea. Other possible mechanisms for the desaturations include the baby contracting the abdominal muscles, splinting the diaphragm and reducing lung volume, causing right to left shunt through unaerated lungs.
Episodes in which chest and abdominal movement ceased were most likely to be central apnoeas.27 There was no change in delivered PIP during these events, suggesting that there was no change in leak or airway resistance. Animal data suggest that glottic closure during central apnoea is common, protecting against apnoea-related desaturation by preventing loss of lung volume.28 The fall in the RIP sum trace at the onset of the apnoeas in figure 5, and the subsequent deep desaturations, suggest loss of end expiratory lung volume by a patent airway; however, the lack of any effect of the delivered pressure on chest inflation may indicate glottic closure.
Concerns have been raised that non-synchronised NIPPV inflations may increase the risk of gastrointestinal perforations,29 30 as inflations may be delivered during spontaneous expiration. In 1985 a case series found increased rates of gastrointestinal perforation in infants receiving non-synchronised NIPPV, compared with those receiving endotracheal ventilation.31 No recent studies of NIPPV have reported this, although studies have not been powered to look for these complications. Some specialised NIPPV delivery devices limit the maximum set PIP, particularly during non-synchronised delivery modes, in an attempt to avoid such complications. In our study of non-synchronised NIPPV the variations in delivered pressure were not related to the timing of inflations within the respiratory cycle; the delivered PIP did not vary according to whether delivery was during spontaneous inspiration or expiration. However, 63% of mechanical inflations analysed were delivered during spontaneous expiration, which could theoretically lead to excessive intrathoracic pressure.
In summary, we have demonstrated that the delivered peak pressure in non-synchronised ventilator-delivered NIPPV is variable and generally lower than the set pressure. Although this study does not report the effect of increasing set PIP, those infants with a set PIP of 25 cm H2O did not achieve a clinically important higher delivered PIP than those with a set PIP of 20 cm H2O. This finding may mean that in practice increasing the set pressure in an infant who requires increasing respiratory support may not provide additional assistance. We have demonstrated that this method of generating NIPPV can occasionally result in higher than set pressures being delivered to the infant. Further studies of NIPPV need to be carried out to determine the most effective method of generating and delivering NIPPV pressures.
References
Footnotes
-
Funding This work was funded by an Australian National Health and Medical Research Program grant no 384100. LSO is part funded by a Royal Women's Hospital postgraduate research scholarship.
-
Competing interests None.
-
Patient consent Obtained from the parents.
-
Ethics approval This study was approved by the Research and Ethics Committees of the Royal Women's Hospital, Melbourne, Victoria, Australia: project number 07/03.
-
Provenance and peer review Not commissioned; externally peer reviewed.