Article Text

Abstract
Objective During proportional assist ventilation (PAV) the timing and frequency of inflations are controlled by the patient and the patient's work of breathing may be relieved by elastic and/or resistive unloading. It is important and the authors' objective to determine whether ventilators delivering PAV function well in situations mimicking neonatal respiratory conditions.
Design In vitro laboratory study.
Setting Tertiary neonatal ICU.
Interventions Dynamic lung models were developed which mimicked respiratory distress syndrome, bronchopulmonary dysplasia and meconium aspiration syndrome to assess the performance of the Stephanie® neonatal ventilator.
Main outcome measures The effects of elastic and resistive unloading on inflation pressures and airway pressure wave forms and whether increasing unloading was matched by an ‘inspiratory’ load reduction.
Results During unloading, delivered pressures were between 1 and 4 cm H2O above those expected. Oscillations appeared in the airway pressure wave form when the elastic unloading was greater than 0.5 cm H2O/ml with a low resistance model and 1.5 cm H2O/ml with a high resistance model and when the resistive unloading was greater than 100 cm H2O/l/s. There was a time lag in the delivery of airway pressure of at least 60 ms, but increasing unloading was matched by an inspiratory load reduction.
Conclusions During PAV, unloading does reduce inspiratory load, but there are wave form abnormalities and a time lag in delivery of the inflation pressure. The impact of these problems needs careful evaluation in the clinical setting.
Statistics from Altmetric.com
Introduction
The last 20 years have seen reductions in the mortality of even the most immature of infants but not in the incidence of bronchopulmonary dysplasia (BPD).1 The aetiology of BPD is multifactorial but includes ventilator induced lung damage. As a consequence, new ventilation modes have been introduced into the neonatal ICU (NICU) setting in an attempt to reduce the incidence of BPD. One such mode is patient triggered ventilation (PTV) in which the patient's inspiratory efforts trigger ventilator inflation. Unfortunately, meta-analysis of the results of randomised trials2 demonstrated PTV delivered either as assist control ventilation (ACV) or as synchronous intermittent mandatory ventilation (SIMV) failed to reduce the incidence of BPD. Subsequently, pressure support ventilation has been introduced, during which the infant's respiratory efforts determine not only the onset but also the termination of ventilator inflation. This has been shown to reduce asynchrony3 but to date not BPD.4
What is already known on this topic
▶. During proportional assist ventilation (PAV) the timing and frequency of inflations are controlled by the patient.
▶. The patient's work of breathing may be relieved by elastic and/or resistive unloading.
What this study adds
▶. Using a dynamic lung model, we have shown that during PAV unloading does reduce inspiratory load.
▶. During PAV, however, there were wave form abnormalities and a time lag in the delivery of the inflation pressure.
▶. As a consequence, the introduction of PAV in the neonatal setting requires careful evaluation.
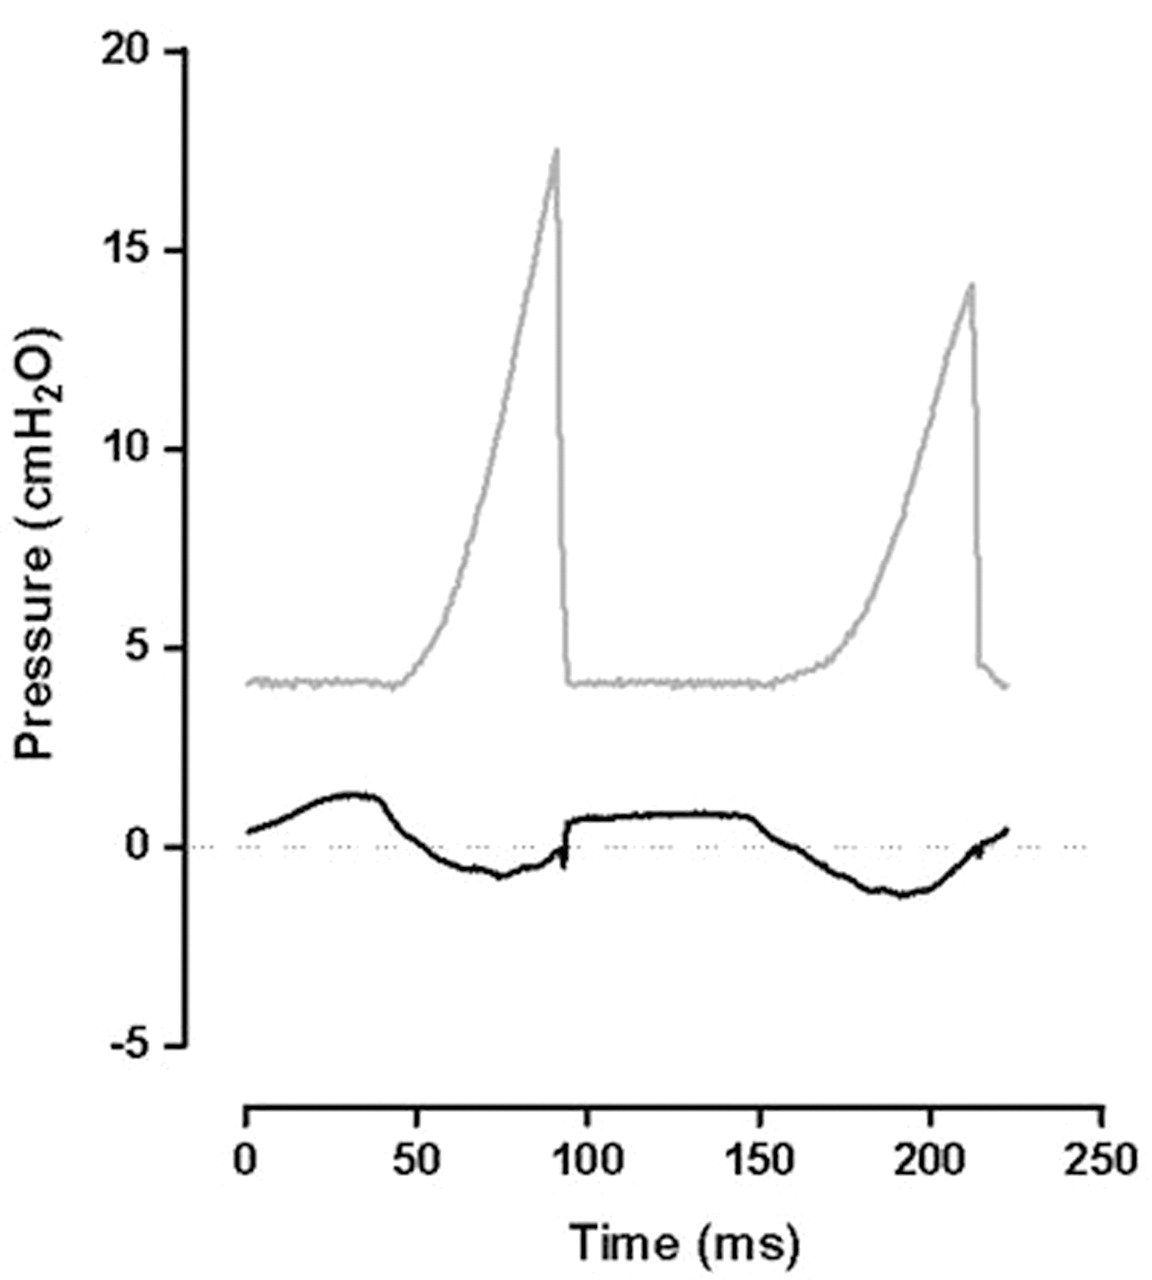
Proportional assist ventilation (PAV) is an even more sophisticated form of PTV.5 During mechanical inflation, there are three factors which impede the delivery of gas flow to the lung. The first is the inertia of the respiratory system, that is, the energy needed to accelerate the respiratory system from its stationary position at the onset of inflation. Except during high frequency oscillation, the inertia is very small and can be ignored. The second factor is the compliance or stiffness of the respiratory system, which is directly in phase with volume change. The third factor is the resistance of the respiratory system, which is predominantly due to the resistance to the inspiratory flow of gas provided by the airways. Unlike compliance, this is in phase with flow and so leads volume by 90°, peaking when inspiratory flow is maximal, but has no impeding effect at the onset or end of inspiration when flow is at zero (figure 1). During PAV, the ventilator has the facility to provide inflation pressure in phase with the tidal volume change to reduce the compliance load, and in phase with the flow to reduce the resistance load (figure 1) or a combination of both. This is defined as elastic and resistive unloading.6 Support is normally only required during inflation, as the elastic recoil of the respiratory system drives expiration. When resistance is very high delaying lung emptying, a negative pressure can also be provided in phase with expiratory flow to reduce the need for active expiratory efforts. The ventilator measures both the compliance and resistance, but it is then up to the clinician to select the level of elastance which is the reciprocal of compliance and a direct measurement of the stiffness of the lung and resistive unloading to be provided. Theoretically, during PAV inflation pressures will always be in phase with the infant's breathing and the infant's respiratory efforts so harnessed that the inflation pressures will be reduced and hence ventilator induced lung damage minimised. Indeed, compared to ACV or IMV in infants with acute respiratory distress, significantly lower mean airway pressures (MAP) could be used during PAV, yet with equivalent carbon dioxide clearances and oxygen requirements.5 Only a small number of infants, however, were studied5 and a crossover design was used so no long-term outcomes were reported.

Diagrams of tidal volume and flow (A, B) showing that flow leads volume by approximately 90°, and that the wave forms of elastic and resistive unloading follow the volume and flow traces respectively (C, D).
PAV has been available for over 10 years, but clinicians have been slow to adopt it. This may reflect the fact that there are only a few studies in neonates, but also that some technical problems have emerged. Runaway high pressures (figure 2) and oscillations have been demonstrated when the amounts of elastic and resistive unloading, respectively, were excessive (figure 3).7 High pressures can be prevented by use of a safety limit, but then abnormal wave forms may occur with very short inflation times.8 To date, in vitro experiments have been carried out using static lung models and it is essential, if use of PAV is to be progressed for neonates, that this form of ventilation is adequately tested using dynamic models. The aim of this study, therefore, was to explore how the current neonatal ventilator that delivers PAV (Stephanie® neonatal ventilator) functioned in dynamic situations using lung models which mimicked the mechanical conditions of respiratory distress syndrome (RDS), BPD and meconium aspiration syndrome. We have assessed the effect of elastic and resistive unloading on inflation pressures and airway pressure wave forms and whether increasing unloading was matched by an inspiratory load reduction.

Pressure waveforms during elastic unloading during appropriate unloading (a) and with excessive unloading (b). Excessive unloading results in high peak pressures and short inspiratory times.

Pressure wave form with excessive elastic unloading. Rapid oscillatory pressures are superimposed on normal wave form due to autotriggering.
Materials and methods
Dynamic lung models were used to assess the PAV ventilator (Stephanie® neonatal ventilator; F. Stephan, Gackenbach, Germany). The series of experiments were repeated with two Stephanie ventilators.
Lung models
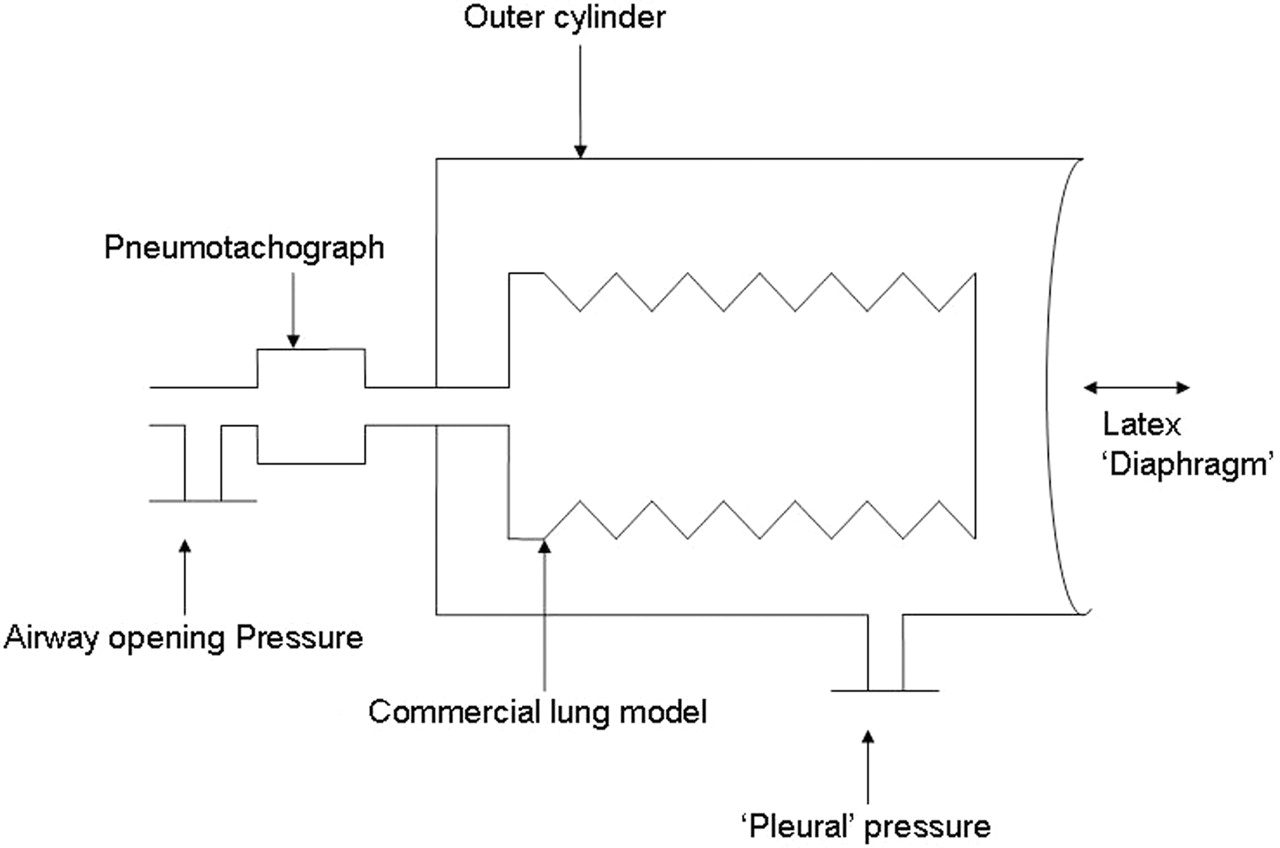
Lung models were developed to more closely represent the infant's respiratory system than commercial models, in particular, they additionally incorporated a synthetic diaphragm and a ‘pleural space’. The dynamic lung models consisted of a commercial lung model (type 1: SLE silicon test lung, part no. N6647 (SLE, South Croydon, UK); type 2: SmartLung Infant; imtmedical, Buchs, Switzerland) mounted inside a plastic cylinder (figure 4). The commercial lung model outlet was externalised through the base of the cylinder and attached to the ventilator circuit via a pneumotachograph. The open end of the cylinder was covered by a latex rubber film, which represented the ‘diaphragm’. Repeated movement of the rubber film backwards and forwards simulated ‘diaphragmatic’ movements. The pressure changes within the cylinder, described as ‘pleural pressure’ (Ppl), were monitored from an outlet on the side of the cylinder using a second pressure transducer. To assess the effect of different compliances, commercial lung models with different compliances were used. To assess the effect of the different resistances, the resistance was increased by adding additional tubing between the pneumotachograph and commercial lung model. Three models were constructed: model A had the lung function abnormalities of an infant with RDS (low compliance and normal resistance), model B had the lung function abnormalities of an infant with BPD (low compliance and high resistance) and model C had the lung function abnormalities of an infant with meconium aspiration syndrome (normal compliance and high resistance).

Diagram of dynamic lung model. The latex sheet functions as a diaphragm. Traction on this simulates spontaneous breaths.
Equipment
Airflow was measured by a pneumotachograph (Mercury F10L; GM Instruments, Kilwinning, Scotland) connected to a differential pressure transducer (MP45, range±2 cm H2O; Validyne, Northridge, California, USA). Tidal volume was obtained by digital integration of the flow signal. The pneumotachograph was inserted between the endotracheal tube (ETT) and ventilator manifold. Airway pressure was measured from a side port on the pneumotachograph using a differential pressure transducer (MP45, range±100 cm H2O; Validyne). The signals from the pressure transducers were amplified using a carrier amplifier (CD 280; Validyne). Ppl was recorded using a differential pressure transducer (MP45, range±100 cm H2O; Validyne). The pressure and flow signals were recorded and displayed in real time on a computer (Dell Optiplex 170L) using Spectra® software v 3.0.0.9 (Grove Medical, Hampton, UK) with 100 Hz analogue to digital sampling (PCI-MIO-16XE-50; National Instruments, Austin, Texas, USA).
Evaluation of lung model
Model A was selected for the evaluation as it most closely matched the mechanical respiratory load encountered by an infant with RDS, the condition most likely to be helped by PAV in the neonatal period. The model was connected to the Stephanie ventilator, set in SIMV mode, with inflation pressures of 25/5 cm H2O, a back-up rate of 60/min and inspiratory time of 0.5 s. The inflation and Ppl and delivered volumes were recorded over five breaths. The compliance of the lung was calculated by dividing the delivered volume by the transpulmonary pressure swing, derived from the difference between the airway and the Ppls after positive end expiratory pressure (PEEP) had been deducted, over the respiratory cycle.
The SIMV back-up rate was then reduced to 5/min and the ventilator breaths stimulated by pulling on a tab attached to the outer surface of the latex ‘diaphragm’ which simulated an infant's breath. The results of eight simulated breaths were meaned. If the model functioned appropriately, the ratio of delivered volume to transpulmonary pressure would remain constant and so the lung compliance results should also remain constant despite varying Ppls. The base line compliance result was 0.22 ml/cm H2O. The mean compliance of the eight simulated breaths with negative Ppls ranging from 6.6 to 11.3 cm H2O was 0.21 ml/cm H2O with a SD of 0.033, demonstrating the reliability of the model.
Protocol
The compliance and resistance of each lung model were assessed using the ventilator in pressure limited mode. The compliances and resistances of the lung models were:
Model A: compliance 0.4 ml/cm H2O, resistance 50 cm H2O/l/s;
Model B: compliance 0.4 ml/cm H2O, resistance 135 cm H2O/l/s;
Model C: compliance 3.0 ml/cm H2O, resistance 150 cm H2O/l/s.
The ventilator was then changed to PAV mode with an airway pressure limit of 25 cm H2O and PEEP of 4 cm H2O. An airway pressure limit was imposed to avoid ‘runaway pressures’ (progressive increase in inflation pressure with every breath due to positive feedback9) that can occur with overcompensation for elastic unloading.7 During PAV, the ‘diaphragm’ was retracted manually to simulate breathing efforts, generating tidal volumes as close as possible to 3 ml (ie, 6 ml/kg for a 500 g baby) with models A and B and 12 ml (ie, 6 ml/kg for a 2 kg baby) with model C. The tidal volume displayed on the ventilator was used to guide the extent of the retraction of the rubber film.
Inflation pressures during increasing elastic and resistive unloading
Baseline assessment was made with elastic unloading and resistive unloading at zero. Recordings were repeated with the resistive unloading at zero and the elastic unloading increased in increments of 0.25 cm H2O/ml until the elastic unloading was equivalent to the elastance of the model. Following this, increasing levels of resistive unloading were applied with elastic unloading set at zero. The resistive unloading was increased from zero in increments of 25 cm H2O/l/s to 150 cm H2O/l/s. The effect of resistive unloading was not examined for model A, as the resistance of that model was within the normal range. The delivered inflation pressures (peak inflating pressure minus positive end expiratory pressure (peak inspiratory pressure (PIP)−PEEP)) were compared with those expected which were calculated using the following equations:
a.. Expected inflating pressures during elastic unloading=elastic unloading×tidal volume
b.. Expected inflating pressure during resistance unloading=resistance unloading×peak inspiratory flow.
At each setting, the mean of 10 inflations was used in the calculation.
Airway pressure wave forms
The highest level of unloading which was not associated with either wave form abnormalities (oscillations) or too high pressures (defined as a peak pressure 5 cm H2O greater than that expected) was determined. At that unloading setting, the Ppl wave form was compared with the inflation pressure wave form during elastic and resistive unloading.
Time delay between pleural and airway pressure changes
The traces were assessed to determine if there was a time delay between the onset of the change in Ppl and the change in airway pressure during elastic or resistive unloading. The maximum level of unloading which was not associated with wave form abnormalities was used.
Effect of elastic and resistive unloading on the inspiratory load
During increasing elastic and resistive unloading, the airway pressures were compared to the Ppls.
Results
The two Stephanie ventilators gave results within 10% of one another.
Delivered inflation pressures
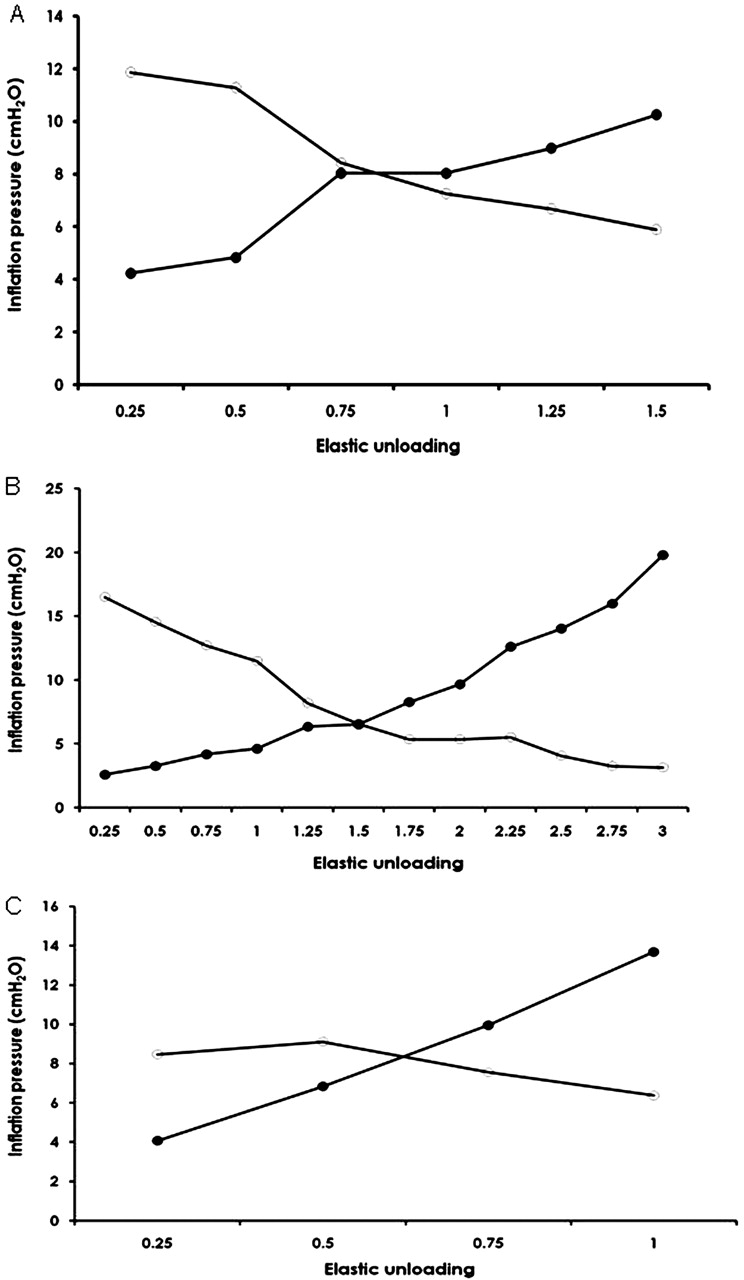
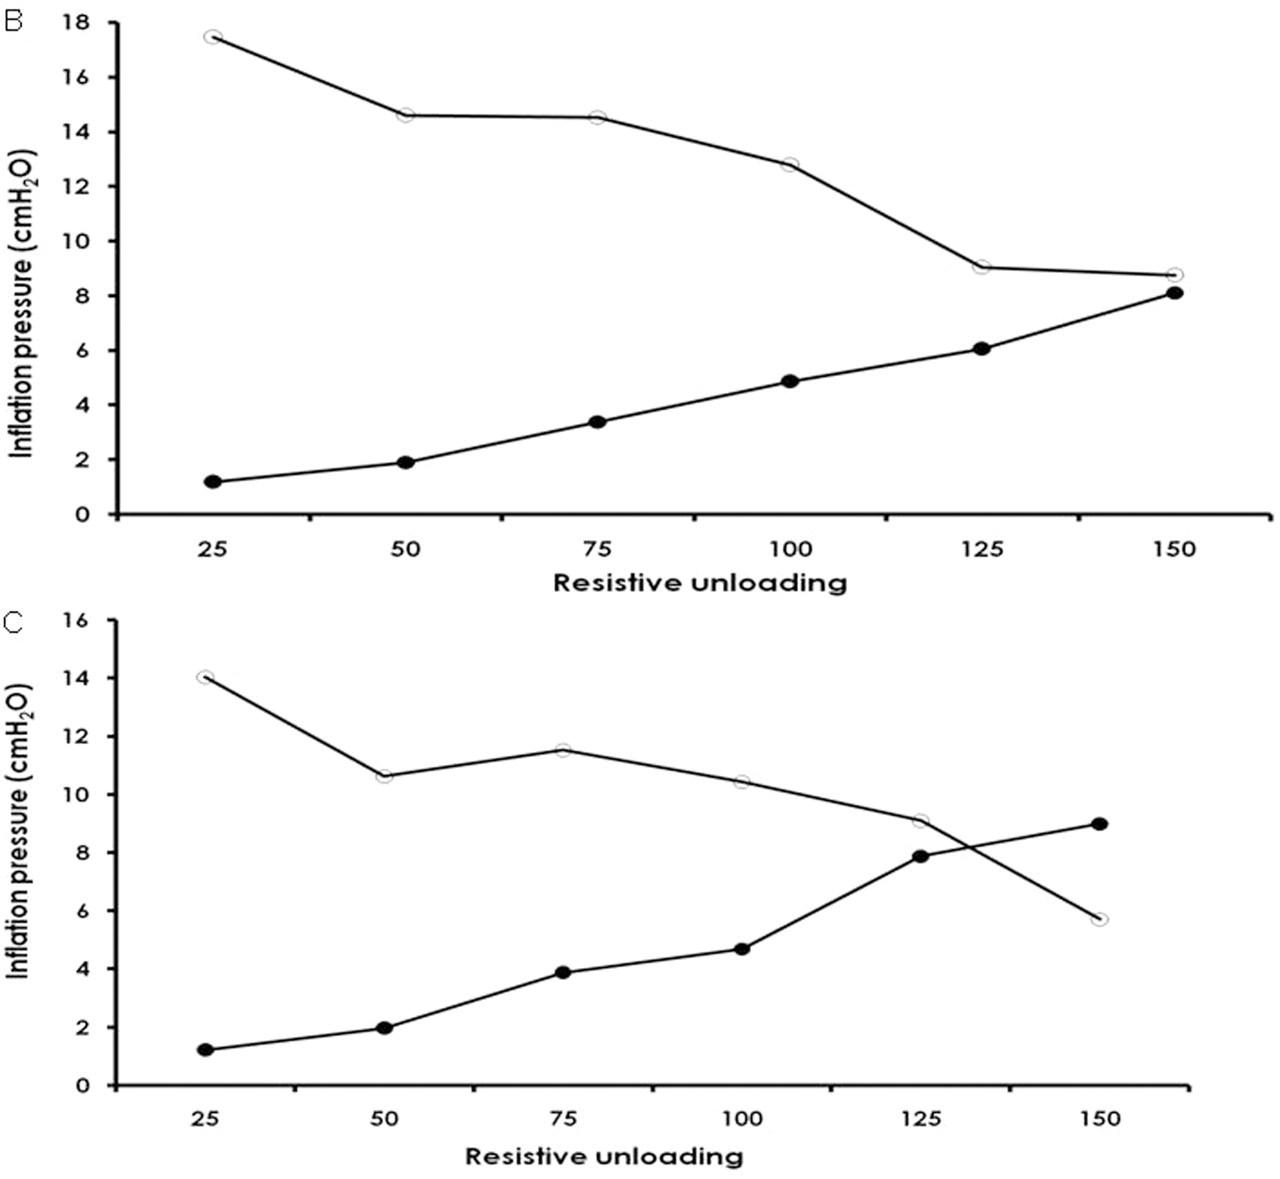
During elastic unloading, the delivered airway pressures exceeded the expected pressures in all three models. Ventilator inflation pressures exceeded the expected pressures by a mean of 4.3 cm H2O (SD 0.78) for model A, 2.3 cm H2O (SD 1.0) for model B and 1.1 cm H2O (SD 0.21) for model C (figure 5). During resistive unloading, the delivered inflation pressures exceeded the expected pressures by a mean of 1.8 cm H2O for model B and by 2.1 cm H2O for model C (figure 6).

Delivered versus expected airway pressures during elastic unloading in lung models A, B and C. Filled circle, expected pressures; open circle, delivered pressures.

Delivered versus expected airway pressures during resistive unloading in lung models B and C. Filled circle, expected pressures; open circle, delivered pressures.
Airway pressure wave forms
During elastic unloading, the airway pressure wave form differed in shape from the Ppl wave form (figure 7), but the two wave forms were similar during resistive unloading. Oscillations in the airway pressure wave form at approximately 2/s were noted with each model at certain levels of elastic or resistive unloading for model A an elastic unloading of 0.5 cm H2O/ml, for model B an elastic unloading of 1.5 cm H2O/ml and a resistive unloading of 100 cm H2O/l/s, and for model C a resistive unloading of 100 cm H2O/l/s. Oscillations were either reduced or eliminated by reducing the trigger sensitivity. Too high pressures were delivered when an elastic unloading of at least 3 cm H2O/ml was used with model A, that is, the elastic unloading required to reduce the elastance to zero.
Airway (upper) and pleural (lower) pressure wave forms during elastic unloading using model B. Elastic unloading was set at 2.5 ml/cm H2O and, therefore, the magnitude of the pleural pressure change was lower than that of the airway pressure change. As seen in the figure, the two pressure wave forms are of different shape.
Delay between airway and pleural pressure changes
There was a time lag of 100 ms at all levels of elastic unloading and 60 ms at all levels of resistive unloading between the start of the Ppl change and the airway pressure change. Inflation, however, did not extend into expiration in any model regardless of the level of unloading. There was no delay between the start of the Ppl change and the onset of airway flow.
Effect of elastic and resistive unloading on inspiratory effort
With all three models, as the elastic (figure 8) and resistive (figure 9) unloading was increased, the Ppls decreased. The rise in airway pressure was closely matched by the fall in Ppl during elastic unloading in model A but the fall in Ppl was less than the increase in airway pressure in models B and C. During progressive resistive unloading, the fall in Ppl closely matched the increase in airway pressure

Airway inflation and pleural pressure changes with increasing elastic unloading in lung models A, B and C. The falls in airway pressure are closely matched by increases in pleural pressure in models A and B. Filled circle, airway pressures; open circle, pleural pressures.

Airway and pleural pressure changes with increased resistive unloading in models B and C. The fall in airway pressure is closely matched by increases in pleural pressure in model C but less so in model B. Filled circle, airway pressures; open circle, pleural pressures.
Discussion
We have demonstrated that, during PAV using dynamic lung models, unloading did reduce the inspiratory load, but there were discrepancies between the theoretical and actual delivery of PAV. During PAV, it has been assumed that the airway pressure and Ppl wave forms would be similar, but we found this not to be the case during elastic unloading. It is also assumed that there would be no delay between the onset of the Ppl change and the onset of increase in airway pressure, but we have shown there was a delay of 100 ms for elastic unloading and 60 ms for resistive unloading. The effect of the delay is that during elastic unloading, no support would be provided for up to 33% of the infant's inspiratory effort assuming this to be 0.3 s in duration.10 It has been demonstrated that the longer the ‘trigger’ delay the greater the increase in the work of breathing,11 which is undesirable as an increased work of breathing can lead to muscle fatigue and has been associated with failed extubation in prematurely born infants.12 In adults, there has been an additional anxiety that a long delay will prolong inspiration into expiration.13 This is of particular concern in infants, in whom extension of inflation into expiration during conventional ventilation provokes active expiration,14 which is a cause of pneumothorax.15 In this study, we did not demonstrate inflation extending into expiration, but it would be important to assess this in vivo.
The delivered pressures, during both elastic and resistive unloading, were greater than expected, but the deviations were relatively small. Oscillations in the airway pressure wave form have previously been reported when resistive unloading levels were set above that needed to reduce the resistance to normal.8 Our data demonstrate practitioners need to be aware oscillations may also occur during elastic unloading. We found that oscillations occurred at approximately 2/s, this is in the absence of a set inspiratory time. The oscillations occurred with an elastic unloading level of 1.5 cm H2O/ml in the high resistance model and 0.5 cm H2O/ml in the low resistance model. These oscillations are due to autotriggering. We have demonstrated it is possible to reduce or eliminate them by reducing the trigger sensitivity. This explains why higher levels of unloading can be achieved before oscillations develop when the airways resistance is high and the response therefore damped. Reducing the trigger sensitivity, however, may lead to missed breaths and increases trigger delay, so this aspect needs to be studied further. The excessive high inflation pressures seen with full elastic unloading in model B were associated with short inspiratory times (figure 3) and appear to be due to the design of the ventilator.
One possible factor which could affect the results would be if the lung model had an inertance which was significantly higher than that of the neonatal lung, as this would alter the pressure wave form. Inertance, however, is directly related to mass and as the lung model was lighter than the lungs of an infant with RDS, any inertial effect would be lower rather than greater than in the clinical situation. In addition, there was no delay between the onset in the fall of the Ppl and the onset of airflow.
A strength of this study was that we were able to assess the function of the ventilator in different mechanical situations mimicking common neonatal respiratory disorders and with a wide range of elastic and resistive unloading. Such a comprehensive assessment would be difficult in the clinical setting. We have shown that the efficacy of unloading depended on the mechanical characteristics of the lung model. Elastic unloading produced a proportional reduction in load in model A, which had a high elastic and low resistive load, but was less effective in models B and C, where the resistive load was high. In models B and C, resistive unloading produced appropriate inspiratory pressures to counter the resistive load. The selection of the most appropriate unloading settings in clinical practice remains a problem and various methods have been proposed. Resistance unloading has been calculated by compensating for the resistance imposed by the ETT,16 but the resistance of the ETT is dependant on the size of tube used.17 In addition, this may not provide sufficient unloading, for example in an infant with BPD in whom resistance of the respiratory system is high.18 The level of elastic unloading has been determined by the effect on the oesophageal pressure per unit inspiratory volume.7 Oesophageal manometry, however, is not routinely undertaken on the NICU and the accuracy of this measurement may be questionable in the presence of chest wall distortion.19 Increasing elastic unloading gain has been shown to reduce chest wall distortion in preterm infants as assessed by respiratory inductive plethysmography.20 It has, therefore, been suggested that an alternative method for setting the level of unloading would be to observe the patient on continuous positive airway pressure (CPAP). The elastic unloading would then be gradually increased until the chest wall deformity reduced and breathing became regular.20 Such criteria, however, are subjective and infants may not tolerate significant periods on CPAP. Our results highlight the importance of factoring in the degree of compliance and resistive abnormalities of the infant if the appropriate level of unloading is to be set.
In conclusion, PAV provided by the Stephanie® neonatal ventilator delivers pressures in excess of those expected, has airway pressure wave forms which deviate from the Ppl wave forms and has a delay in pressure delivery of up to 100 ms. It can, however, provide appropriate levels of elastic and resistive unloading, but whether this form of ventilation is superior to other modes for neonates needs to be evaluated in randomised trials with long term follow-up.
Acknowledgments
The authors would like to acknowledge Sarah Walker and Kenichi Masimoto for data collection in this study. We are also grateful to SLE Ltd who provided the static lung models used in the construction of the dynamic lung models.
References
Footnotes
-
Funding Dr Patel is supported by The Charles Wolfson Charitable Trust.
-
Competing interest AG has held grants from various ventilator manufacturers; AG and ADM have received honoraria for giving lectures and advising various ventilator manufacturers.
-
Provenance and peer review Not commissioned; externally peer reviewed.