Article Text

Abstract
Video observations and recordings of respiratory signals from mannequin studies and delivery room (DR) resuscitations are described. This article discusses the uses of a respiratory function monitor (RFM) during training and resuscitations along with potential pitfalls and limitations. It adds objectivity to the clinical assessment. A respiratory function monitor provides real-time quantitative information including tidal volume and leak. It may be used to teach correct mask hold and positioning techniques during simulation-based mannequin. Examples demonstrating its potential usefulness during resuscitations are provided. However, further studies are needed to investigate whether it can help improve short-term and long-term outcomes.
Statistics from Altmetric.com
Background
Approximately 3% to 6% of newborn infants require respiratory assistance at birth.1 An internationally agreed consensus statement2 and various guidelines3,–,5 provide advice about equipment and techniques for neonatal resuscitation. They all agree that the key to successful neonatal resuscitation is adequate positive pressure ventilation (PPV).2,–,5
Traditionally, adequacy of ventilation during PPV in the delivery room (DR) is assessed by adequate chest rise and increased heart rate.2 This contrasts with evidence that optimal ventilation in the neonatal intensive care unit should be guided by a continuous display of airway pressure, gas flow, tidal volume (VT) and gas leak at the endotracheal tube (ETT)6,–,8
The aim of this clinical practice review is to illustrate how monitoring respiratory signals can improve manikin-based training and respiratory support during neonatal resuscitation.
Over 6 years, at the Royal Women's Hospital, Melbourne, Australia, a respiratory function monitor (RFM) was used for training and during neonatal resuscitation in the DR for audit, research and clinical management. The studies were approved by the Hospital Research and Ethics Committees and parental consent to use the recordings was obtained.
RFM
We use a Florian Neonatal RFM (Acutronic Medical Systems AG, Zug, Switzerland). It uses a small, low dead space (approximately 1 ml) hotwire anemometer with an accuracy of ±8% (manufacturer's data), which is placed between a ventilation device and a facemask or ETT.9,–,12 The inspiratory and expiratory tidal volumes (VTi, VTe) are automatically calculated by integrating the flow signal. A monitoring line measures and displays the airway pressures.
The monitor can be set to continuously display pressure, flow and tidal volume waves. It also measures and displays numerical values for peak airway pressure (PIP), positive end expiratory pressure (PEEP) or continuous positive airway pressure (CPAP), VTe, respiratory rate (RR), expiratory minute ventilation (MVe) and the leak between mask and face or around an ETT as a percentage ((VTi − VTe)/VTi)×100 (see figures 1 and 2). Leak is graphically presented as the difference in area under the flow curves above (inflation) and below (deflation) zero flow.12

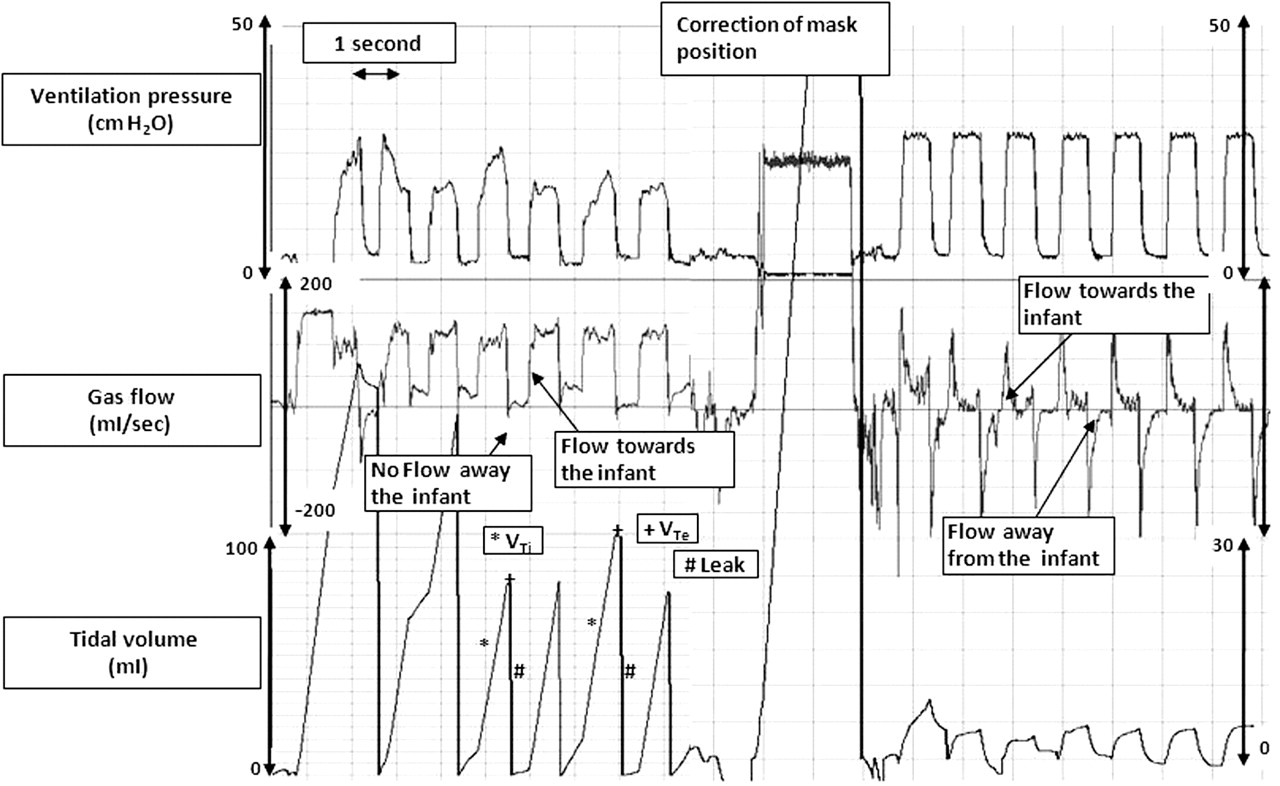
Leak at face mask in an extremely low birthweight (ELBW) infant. Positive pressure ventilation with a face mask in a 28-week infant. The inspiratory flow curve returns to baseline indicating gas flow towards the face mask. In contrast, there is no expiratory flow curve indicating a leak around the face mask. The tidal volume curve reflects the gas flow curve and displays 80% to 100% leak with almost no gas entering and leaving the lung. In addition, the pressure curve fails to achieve the set peak airway pressure (PIP) of 30 cm H2O. After correction of face mask position there is a significant reduction in face mask leak to 15%, adequate gas flow entering and leaving the lung and the set PIP is reached.
Airway leak in extremely low birthweight (ELBW) infants. Variable leak during positive pressure ventilation with a face mask in a 27-week infant. The area underneath the inflation flow curve is greater than that under the expiratory flow curves. This is reflected in the tidal volume (VT) curve, which displays a larger inspiratory VT (VTi) compared to expiratory VT (VTe). Leak is displayed as a straight line in the tidal volume curve.
Measurements were recorded from the Florian monitor at 200 Hz and displayed using Spectra software (Grove Medical, London, UK). The figures were obtained during PPV of either a leak free manikin or resuscitation of an infant in the DR. The ventilation device used was either a Neopuff Infant Resuscitator (Fisher & Paykel Healthcare, Auckland, New Zealand), which is a continuous flow, pressure limited, T-piece device with a built in manometer and a PEEP valve, or a Laerdal infant resuscitator (Laerdal, Stavanger, Sweden), which is a 240 ml silicone self-inflating bag. Default Neopuff settings were a gas flow of 8 litres/min, PIP and PEEP of 30 and 5 cm H2O. For the Laerdal the gas flow was 8 litres/min and no PEEP valve was used.
Optimising face mask hold and position
A RFM can be used to find the best technique of mask application and mask position when using a face mask. This can be demonstrated using a resuscitation manikin that has been made internally leak free (see figure 1).10 12 In manikin-based training as well as during real resuscitations, the monitor displays the leak around the face mask as graphical and numerical output. The operators can then adjust the face mask hold and position to minimise leak (see figure 3).9 During PPV training9,–,13 operators averaged 60% leak around the face mask.11 When they used a RFM they were able to adjust the mask position and reduce the leak to about 10%.9 Using a RFM improves the effectiveness of PPV via a face mask by providing immediate feedback to the operator.9,–,12 In addition, it enables an instructor or examiner to assess the operator's performance by observing their face mask leak in real time.
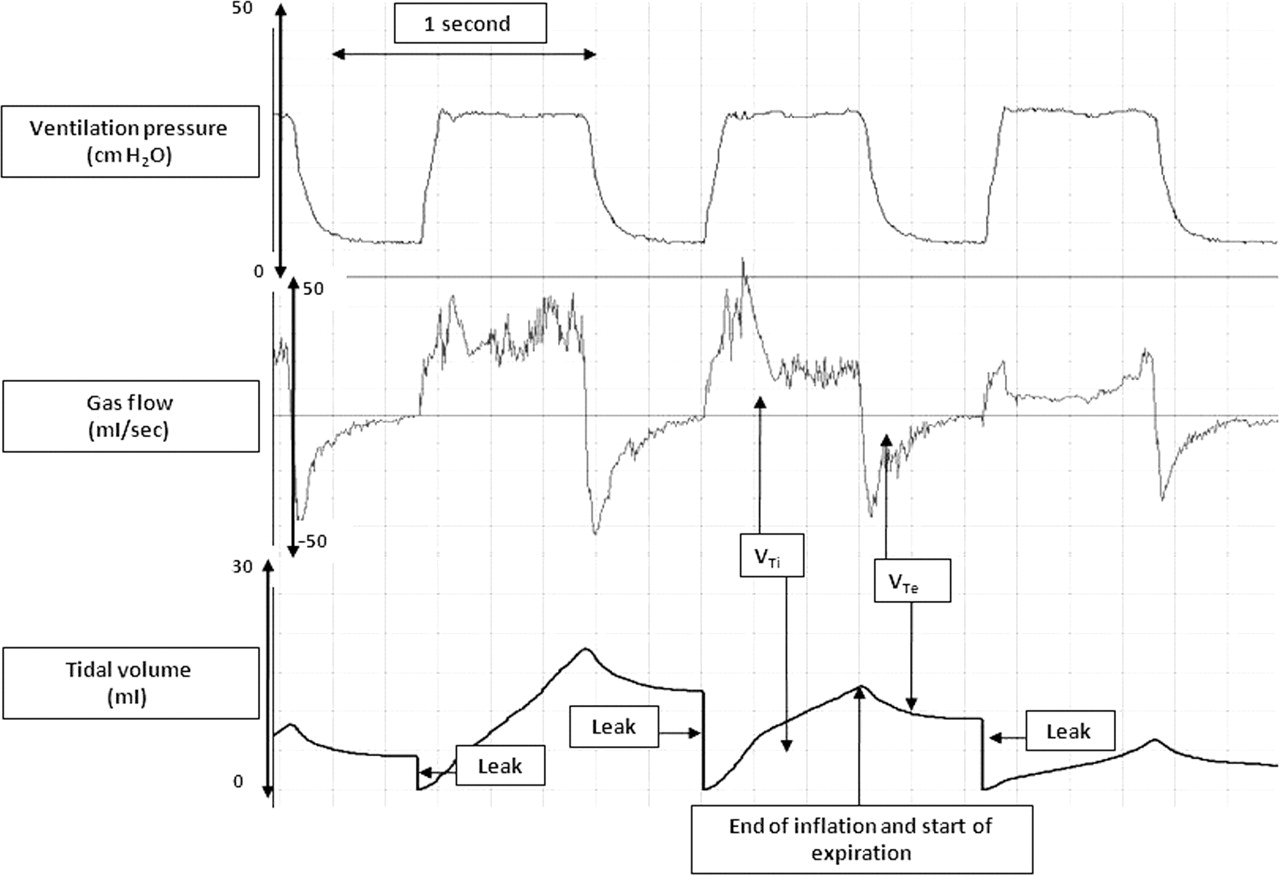
Positive pressure ventilation with a face mask on a manikin: no leak. The inflation and expiratory flow curves return to the baseline, indicating sufficient tI and tE. The similar areas underneath the inflation and expiration flow curves mean an equal amount of gas entered and left the airways. The tidal volume curve shows the inspiratory and expiratory tidal volumes (VTi and the VTe). It shows an equal volume of gas entering and leaving the lung and no leak. VTi has almost formed a plateau indicating that very little gas continues to enter the lung as inflation is continued.
In our experience a large face mask leak is a common, usually unrecognised, problem during resuscitation, which can lead to inadequate ventilation (see figure 2). Mask leak varies during each resuscitation due to the baby's movements, movements of the operator's hand or procedures such as fitting a hat. Variable mask leak leads to the delivery of variable tidal volumes. When the leak is large, the tidal volume may be insufficient to achieve adequate gas exchange. Conversely, if the leak is small the tidal volumes may be excessive and cause over ventilation and lung damage. Observation of a continuous display of leak and VT will help the operator to quickly recognise any mask leak and then adjust mask position to maintain stable tidal volumes throughout the resuscitation.
Failure to achieve a set PIP or PEEP with a T-piece resuscitation device may be due to a large face mask leak. The operator can alter the mask position to minimise the leak (see figure 3). However, if a high gas flow is used (eg, 8 litres/min) PIP and PEEP may be delivered at close to the set value even with a substantial face mask leak and low delivered tidal volume (see figure 2).9,–,12 14 15 Thus, achieving the pressures set on a pressure dial may falsely reassure the operator that satisfactory ventilation is being delivered.14 16
Endotracheal intubation
The same principles apply during ETT intubation. After the first inflation a RFM will show correct ETT placement by displaying gas flow in and out of the trachea (see figure 4A).17 If the ETT is not in the trachea, the flow wave shows gas going down the ETT but not returning (see figure 4B). This is important because oesophageal intubation is quite common.17,–,19 Without a RFM, or CO2 detector, it may take several minutes to recognise that an inadequate response to ventilation is due to a misplaced ETT.20 Although a CO2 detector is now frequently used for assessing ETT placement,2,–,5 21 22 it can take up to six inflations before a colour change indicating the presence of CO2 occurs, whereas the flow signal from a RFM can be used from the first inflation.2 23,–,25 If no colour change is seen with a CO2 detector, it may be that although the ETT is correctly placed, the tidal volume is too low. This is not clear with a CO2 detector but can be immediately seen with a RFM and the PIP increased until an appropriate tidal volume is achieved.

A. Correct endotracheal tube (ETT) placement in a 26-week infant. The inflation and expiratory flow curves return to baseline, indicating correct placement of an ETT. The areas underneath the inflation and expiration flow curves are very similar and show that an equal volume of gas entered and left the airways. The tidal volume (VT) curve shows an equal volume of gas entering and leaving the lung and no leak. The pressure curve displays vary peak airway pressure and no positive end expiratory pressure during positive pressure ventilation. B. Oesophageal tube placement in a piglet. The inspiratory flow curve returns to baseline indicating gas flow towards the ETT. In contrast, there is no expiratory flow curve indicating ETT placement in the oesophagus. The VT curve reflects the gas flow curve and displays 100% leak with no gas entering and leaving the lung.
An ETT can easily become dislodged, this can be seen immediately as there is little or no expiratory flow and volume (see figure 5).
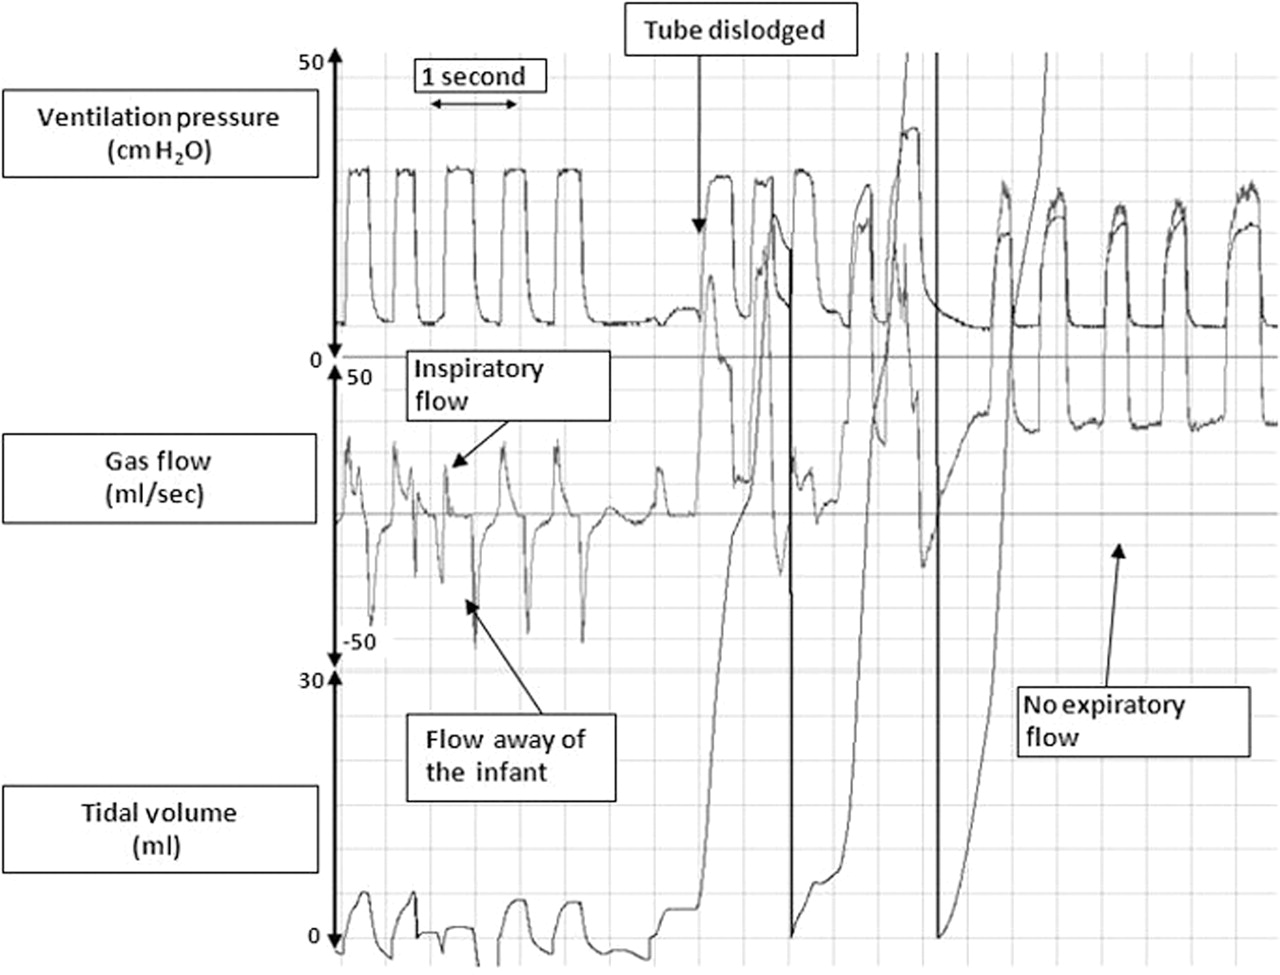
Leak followed by dislodgement of endotracheal tube (ETT) in 27-week infant. The inspiratory flow curve returns to baseline indicating gas flow towards the ETT. In contrast, there is almost no expiratory flow curve indicating a large leak around the ETT, which is reflected in the tidal volume (VT) curve displaying 100% leak. Suddenly, the ETT becomes dislodged. There is still some gas flow towards the ETT, but no expiratory gas flow. In addition, the VT curve is not longer displayed. An attached PediCap failed to change colour. The ETT was removed and the infant was reintubated.
ETT size
One reason for an unsatisfactory or failed resuscitation might be that insufficient gas enters the lung due to a large leak around the ETT.12 26 A RFM displays the leak around the ETT. With an appropriate sized ETT any leak will be small (see figure 6B). Clinicians may use small diameter ETTs in the belief that these are easier to insert. Unfortunately, this can cause a large leak of the inflating volume around the ETT (see figure 6A) and may result in ineffective ventilation. The use of a RFM enables the operator to assess the degree of leak as soon as inflations are applied and decide whether the ETT size is appropriate or needs to be changed.

A. Leak at endotracheal tube (ETT) and correction after reintubation. Positive pressure ventilation after correct placement of a too small ETT resulting in a large leak and ineffective ventilation. The inspiratory and expiratory flow curve returns to baseline indicating gas flow towards and away the infants lungs. The areas underneath the expiration flow curves are smaller compared to the inflation flow curve indicating a leak around the ETT, which is reflected in the tidal volume (VT) curve displaying 80% leak around the ETT. B. After reintubation with a larger ETT, the areas underneath the inflation and expiration flow curves are very similar meaning an equal amount of gas entered and left the airways. The VT curve shows an equal volume of gas entering and leaving the lung and no leak.
Evaluating tidal volumes
The purpose of applying PIP during PPV is to inflate the lungs with an appropriate VT and thereby facilitate gas exchange. When a fixed pressure is used, the delivered VT will be dependent on the size of the infant, any spontaneous breaths and whether they are synchronised with each inflation, compliance of the lungs and chest wall, airways resistance and mask leak.27,–,30 This means that the use of a single set PIP is unlikely to be appropriate during the ventilation of any one infant at all times.
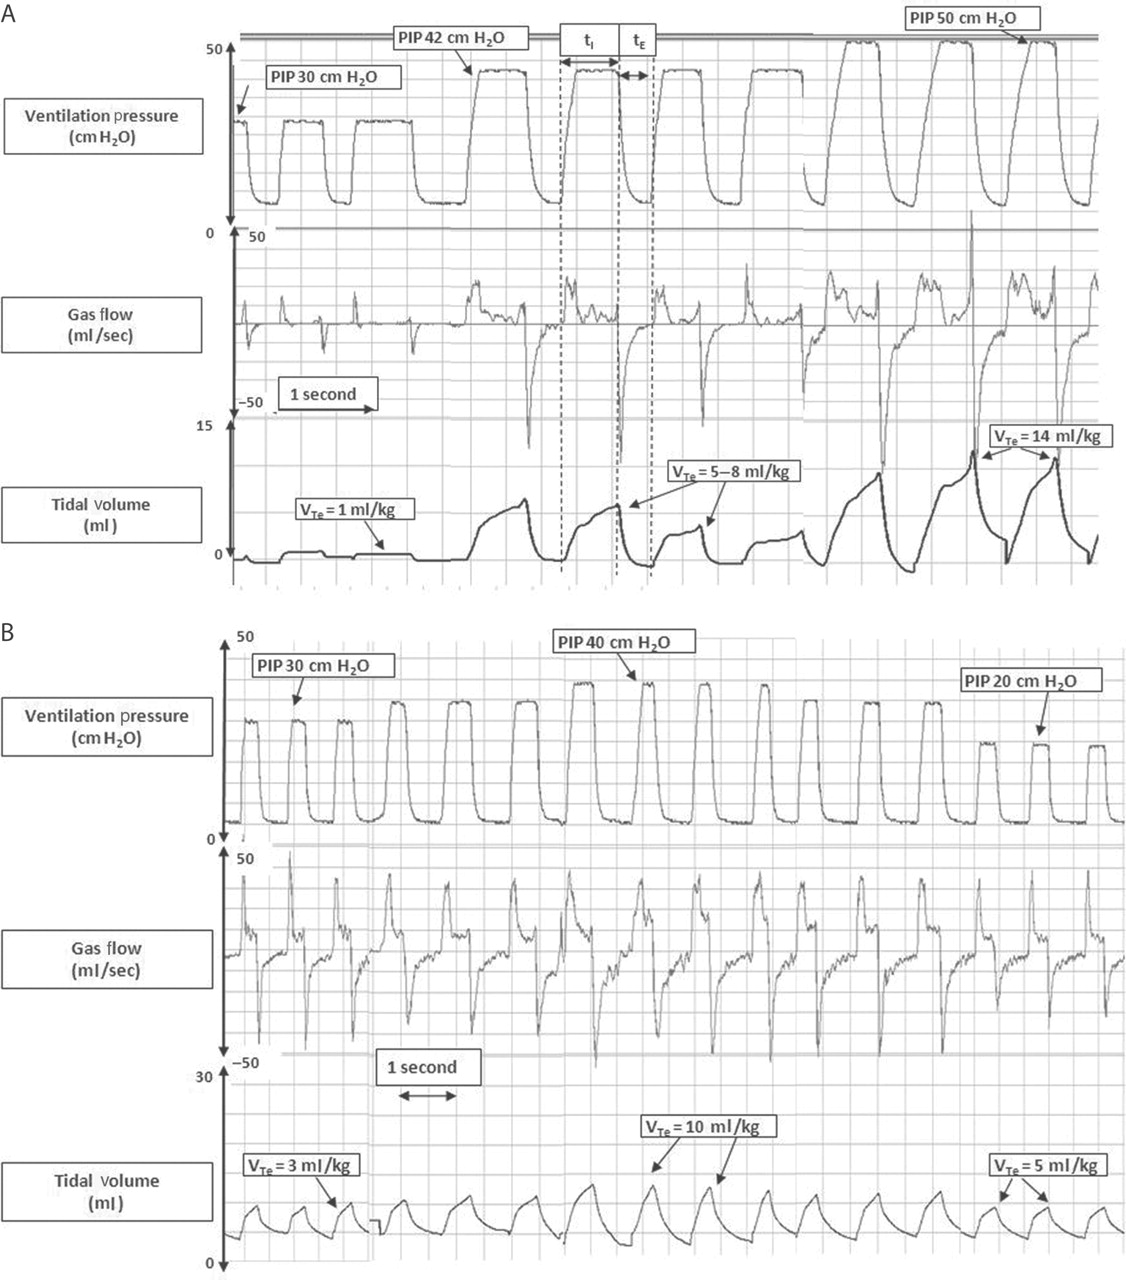
The appropriate VT to be delivered during various phases of resuscitation is unknown. Studies of spontaneously breathing infants, animal studies and our own observations suggest the VT during resuscitation should be within the range 4–8 ml/kg. Excessive VT can over inflate the lungs and lead to volutrauma, whereas insufficient VT can lead to inadequate gas exchange.31,–,36 A RFM enables the resuscitator to see a graphical and numerical output of the VTe and adjust the PIP to ensure an appropriate VT is delivered (see figure 7B). Resuscitators may not be able to judge the tidal volume by observing chest wall rise. Figure 7A was a recording made of a resuscitation where the operator was blinded to the display of the RFM. During PPV the PIP was increased to improve chest movements but this resulted in excessive tidal volumes.

A. Expiratory tidal volume (VTe) variations during positive pressure ventilation (PPV) in 25-week infant. Initially, the inflation and expiratory flow curves are small, and the measured VTe is approximately 1 ml/kg. An increase in peak airway pressure (PIP) to 42 cm H2O showed an increase in VTe to 5–8 ml/kg. A further increase to a PIP of 50 cm H2O PIP resulted in an increase of VTe to 14 ml/kg. B. VTe variations during PPV in 27-week infant. Initially, the VTe was 3 ml/kg. After an increase in PIP the delivered VTe increased to 10 ml/kg. A continued reduction of PIP to 20 cm H2O showed a decrease in the delivered VTe to about 5 ml/kg.
If there is little or no VT displayed on the RFM during an inflation, then either the PIP is too low to expand poorly compliant lungs or the airway is obstructed (see figure 8). Initially, the clinical response to a very low VT should be to increase the PIP until an appropriate VT is displayed on the RFM. High inflating pressures will not injure the lungs if the VT delivered is monitored and maintained in the appropriate range.37 38 It is not uncommon for an apnoeic infant, or one with hypoplastic lungs, to require a high PIP initially to aerate the lungs. Once the lungs have aerated the PIP may need to be reduced rapidly (see figure 7B). The appropriate PIP will vary between infants and in the same infant over time and can be gauged by using a RFM to display the tidal volumes.28 29 39

Complete airway occlusion during facemask positive pressure ventilation (PPV) in an extremely low birthweight (ELBW) infant. The peak airway pressure and positive end expiratory pressure are maintained during PPV, but the inflation and expiratory flow curves display almost no flow movements. This is reflected in the tidal volume (VT) curve, which displays no tidal volume.
Airway obstruction
If there is little or no increase in a very low VT in response to increased PIP then the resuscitator should consider obstruction to the airway.40 Obstruction can be due to poor mask technique and can occur in two places. In our experience, the commonest cause is the resuscitator applying mask to the face too tightly and obstructing the nose and mouth. This can be identified and corrected by releasing the mask a little and observing the gas flow and VT signals. Second, the neck may be hyperflexed and the airway becomes obstructed. This can be diagnosed by observing the flow and VT signals as the head is repositioned. Rarely, obstruction may be due to a congenital abnormality of the airways (see figure 8).
Ventilation rate
Many clinicians are unaware of their ventilation rate during PPV because it is not measured and displayed (see figure 9). High ventilation rates can lead to inappropriately short inflation time (tI) and expiration time (tE) with the risk of either inadequate VT delivery at a given PIP or air trapping. A high rate and satisfactory tidal volume will rapidly cause over ventilation and hypocarbia. A RFM enables the resuscitator to see their ventilation rate and adjust as necessary.
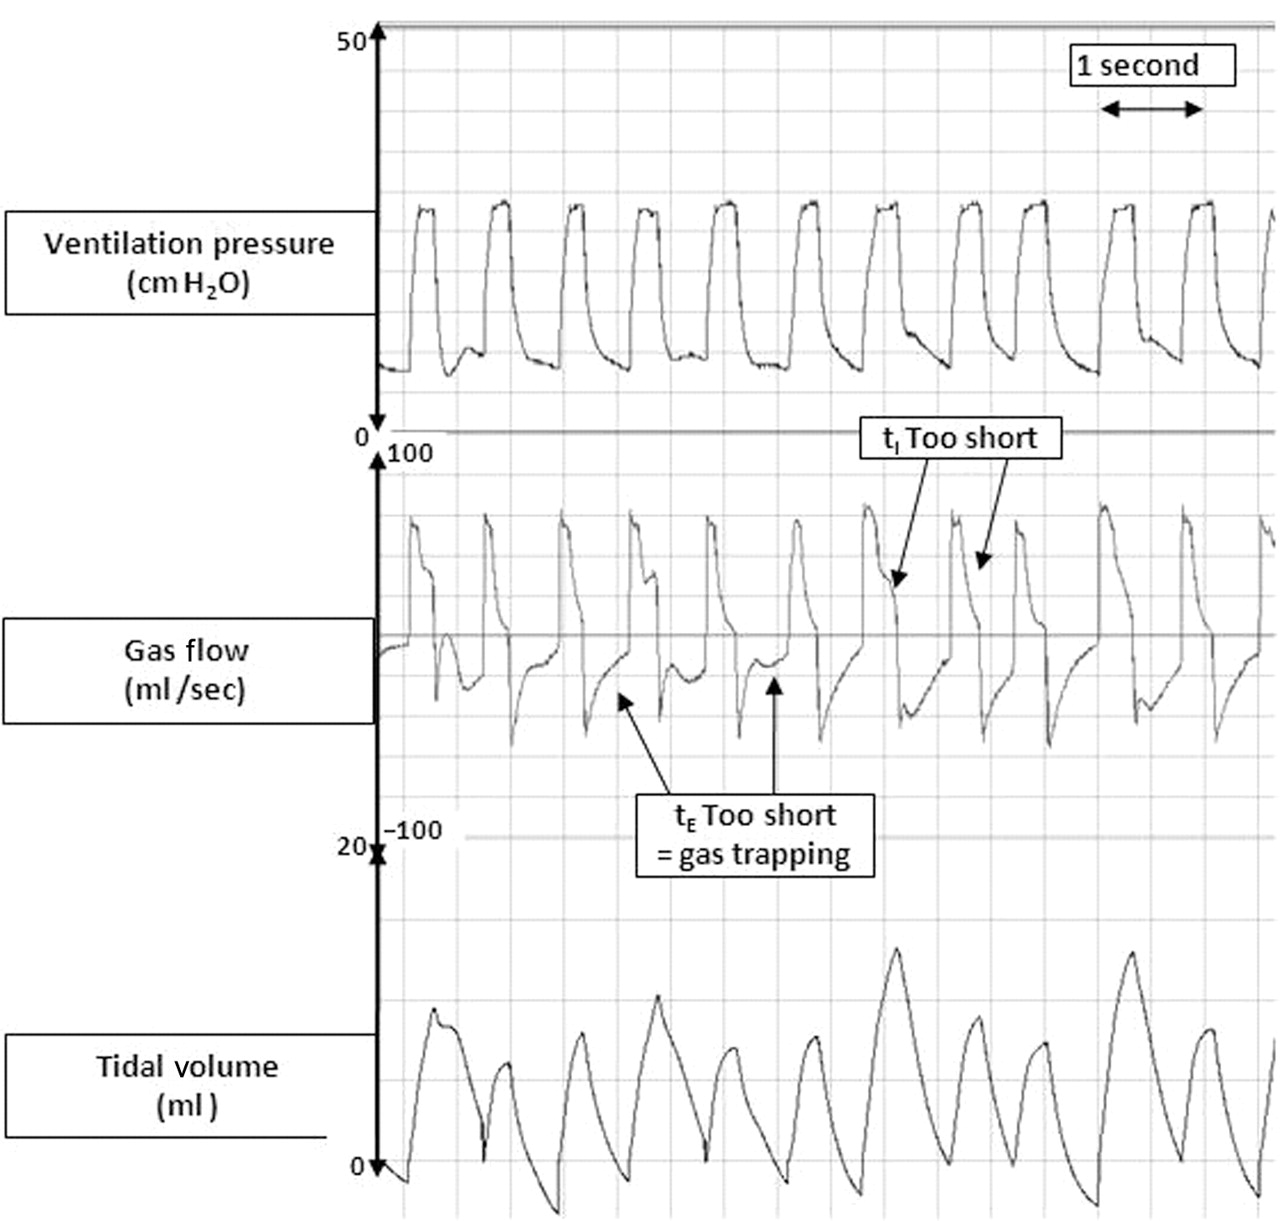
Insufficient inflation and expiration time in an extremely low birthweight (ELBW) infant. The inflation and expiratory flow curves do not return to baseline before changing direction, indicating insufficient inflation and expiration time. The inflation flow is continuing this means gas is still entering the lung. If expiratory flow is continuing this means gas is still leaving the lung. If the next inflation starts before expiratory flow has stopped gas trapping will occur.
Inflation time
The flow and VT waves can be used to assess tI and tE during PPV. The tI should be long enough to allow an appropriate VT to be delivered (see figure 1). Sharply spiked VT waves indicate gas is still rapidly entering the lungs when the inflation is stopped and therefore the tI is too short for that PIP (see figure 9). If the operator delivers an inconsistent tI, the VT will vary. This may lead to either under ventilation (reduced VT) or too large a tidal volume and volutrauma.
If the tI is too long there will be no increase in VT towards the end of inflation. Using a RFM enables the resuscitator to see what is happening to the VT and adjust the inflation time.41 42
Expiratory time
The expiratory flow wave should return to zero before the next inflation starts (see figure 1). If the tE is too short and the next inflation starts before expiratory flow has stopped, gas trapping will occur (see figure 9).
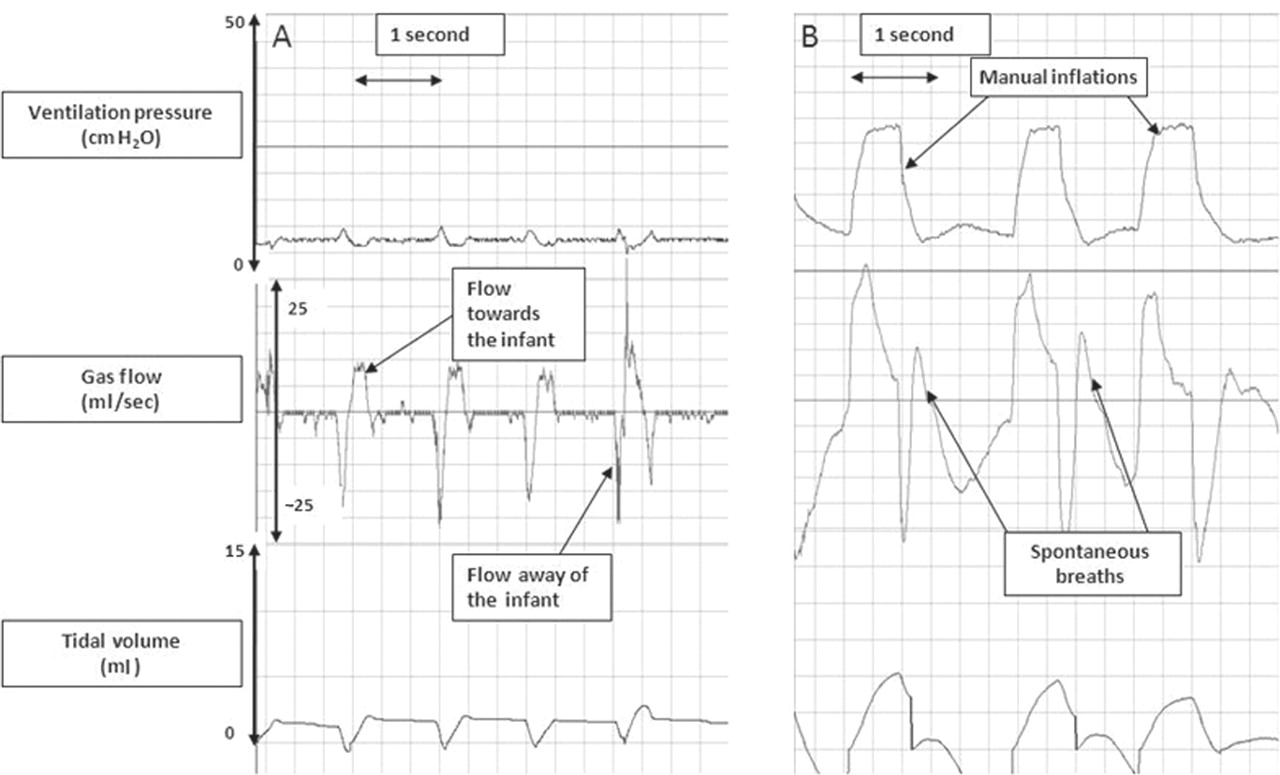
Observing spontaneous breathing
At some point during resuscitation most infants will start breathing.42 43 A RFM attached to a face mask or ETT shows an infant's spontaneous VT, breathing patterns and interaction with any manual inflations (see figure 10A).42 43 To assess an infant's own breathing patterns the mask is applied to the face with a good seal, inflations are stopped and the flow and VT signal observed. Within a few seconds the infant's spontaneous respiratory rate and VT will be displayed. If the infant is breathing regularly and generating adequate tidal volumes, assisted ventilation may be stopped and the infant managed either with no assistance or mask CPAP. During PPV a RFM shows whether infants are breathing synchronously or asynchronously with manual inflations. Infants often have their own respiratory rate and inspiratory and expiratory patterns regardless of any inflations.42 A RFM often shows an infant breathing out of phase with the inflations (see figure 10B), which can lead to inefficient PPV. A trial of mask CPAP, as described earlier, may be appropriate.

A. A spontaneously breathing infant. Expiratory breath hold in a spontaneous breathing infant with continuous positive airway pressure (CPAP) support of 5 cm H2O. After inspiration, the infant holds his breath for about a second before expiration occurs. The gas flow pattern is reflected in the tidal volume (VT) curve. The pressure curve shows the CPAP of 5 cm H2O with small pressure drops during inspiration. B. Asynchrony between an infant's breaths and manual inflations in a preterm infant. The manual inflations are immediately followed by spontaneous breaths from the infant, which are displayed as a second inspiratory and expiratory gas flow curve. The operator is unable to synchronise his manual inflations with the infant's spontaneous breathing. The positive pressure ventilation and spontaneous breaths are out of synchrony and the infant is fighting against these inflations.
Possible problems from using a respiration function monitor
Inexperience and lack of knowledge about the displayed waveforms may lead to misinterpretation of the signals. Therefore anyone using a RFM must be trained to interpret pressure, flow and tidal volume signals. In addition, the attention of an inexperienced user may be diverted from the baby to the monitor screen. With this device, the displayed VTe must be converted to ml/kg (eg, a displayed VTe of 5 ml/kg for a 500 g infant will be VTe of 10 ml/kg). For people unfamiliar with the device they may find that placement of a flow sensor between the mask and resuscitation device makes holding the device a little awkward.
Limitation of a respiration function monitor
With this device, the numerical value for leak is averaged over 1 min and so cannot be used for individual inflations. A RFM only displays the waves and data to aid the resuscitator and does not provide interpretation of the signals or a diagnosis. For example, a signal showing absent VT may be due to malposition of the face mask, obstruction of the airways or a congenital abnormality.
Conclusions and future directions
We have presented observations and recordings from manikin studies and DR resuscitations that show how a RFM can aid training and resuscitations by adding objectivity to the assessment. A RFM can be used during manikin-based training to teach correct mask hold and positioning techniques. We have shown examples demonstrating its usefulness during resuscitations. However, more studies are needed to investigate whether during resuscitations information displayed by a RFM can: (1) improve mask hold and positioning techniques to diminish leak and obstruction; (2) reduce the need for endotracheal intubation; (3) reduce the incidence of hypocarbia and hypercarbia on admission to the NICU; (4) reduce the incidence of acute lung injury including air leaks; (5) reduce the incidence of bronchopulmonary dysplasia; and (6) reduce the incidence of death and neurodevelopmental disability.
Acknowledgments
The authors thank Risha Bhatia for reading the manuscript.
References
Footnotes
-
Competing interests None.
-
Ethics approval This study was conducted with the approval of the Hospital Research and Ethics Committees, The Royal Women's Hospital, Melbourne, Australia.
-
Provenance and peer review Not commissioned; externally peer reviewed.
-
Patient consent Obtained.