Article Text

Abstract
Background: Only a few studies have dealt with postnatal growth velocity of very low birthweight (VLBW) infants.
Objective: To analyse weight growth kinetics of VLBW infants from birth to over 2 years of age.
Patients: A total of 262 VLBW infants were selected; inaccurate estimate of gestational age, major congenital anomalies, necrotising enterocolitis, death, and loss to follow up within the first year were the exclusion criteria.
Methods: Body weight was recorded daily up to 28 days or up to discontinuation of parenteral nutrition, weekly up to discharge, then at 1, 3, 6, 9, 12, 18, and 24 months of corrected age. Individual growth profiles were fitted with a seven constant, exponential-logistic function suitable for modelling weight loss and weight recovery, two peaks, and the subsequent slow decrease in growth velocity.
Results: After a postnatal weight loss, all infants showed a late neonatal peak of growth velocity between the 7th and 21st weeks; most also experienced an early neonatal peak between the 2nd and 6th week. VLBW infants who were small for gestational age and those with major morbidities grew less than reference VLBW infants who were the appropriate size for gestational age without major morbidities: at 2 years of age, the difference in weight was about 860 g. The more severe growth impairment seen in VLBW infants with major morbidities is almost entirely due to the reduced height of the late neonatal peak of velocity.
Conclusions: The growth model presented here should be a useful tool for evaluating to what extent different pathological conditions or nutritional and medical care protocols affect growth kinetics.
- growth velocity
- growth curves
- very low birthweight
- models
Statistics from Altmetric.com
During the last few decades, the increase in the number of liveborn very low birthweight (VLBW) infants and their improved survival rate have raised the problem of the correct evaluation of their postnatal growth. The growth of VLBW infants is known to be very different from that of higher birthweight, full term infants.1 Widespread agreement has now been achieved on the need for longitudinal studies on VLBW infants to evaluate postnatal growth of this specific population.2–5 Such longitudinal studies could provide data suitable for producing not only “distance” growth charts, but also “velocity” charts, which would allow earlier detection of unsatisfactory growth with respect to VLBW infant peers.
Studies carried out so far on growth of VLBW infants are not homogeneous in criteria of inclusion, number and frequency of observations, or length of follow up. Some of the few studies in which growth velocity curves have been drawn6–8 include either a small number of babies followed up for less than three months or a large number of infants followed up to 3 years of corrected age, but without data from birth to the 40th week and with subsequent measures taken only four months later.9 The aim of this study was to model weight increase kinetics of VLBW infants from birth to over 2 years of age, on the basis of a set of 262 growth profiles.
PATIENTS AND METHODS
A total of 643 infants with birth weight lower than 1500 g but higher than 500 g were born between January 1994 and December 1999 and admitted to the neonatal intensive care unit of Turin University. From these, 262 (six non-white) were selected (fig 1); 163 infants were transferred to other neonatal units for logistic not clinical reasons, and 44 babies stopped attending the scheduled visits within the first year because their families lived a long way from Turin. Informed consent was obtained from all mothers participating in the study. During the hospital stay, nutritional practices were standardised for all babies according to guidelines for preterm infants.10

Selection of infants analysed in the study. *More than one week difference between ultrasound and postmenstrual gestational age. VLBW, very low birth weight.
Both enteral and parenteral nutrition were started simultaneously on day 1 and were progressively increased in the first week: fluids from 60–80 to 130–160 ml/kg/day, carbohydrates from 6–8 to 15 g/kg/day, protein from 0.5 to 3.5 g/kg/day, and lipids from 0.5 to 3 g/kg/day. Enteral nutrition was started with maternal or donor milk (10–20 ml/kg/day) and increased daily by 10–20 ml/kg/day. When the intake reached 100 ml/kg/day, human milk fortifier (FM85 Nestlè) was added to human milk. If no maternal milk was available, donor milk was progressively replaced by preterm formula (S24 Abbott). When the infant attained a weight of 1.8 kg or was discharged, either maternal milk or a term formula was given.
According to the protocol of the study, during the hospital stay, body weight had to be recorded daily for up to 28 days or up to discontinuation of parenteral nutrition, if it occurred later, then weekly up to discharge. The scheduled follow up visits were at 1, 3, 6, 9, 12, 18, and 24 months of corrected age: about 50% of infants had one or more evaluations during the third year of life. Weight was measured by trained nurses or neonatologists with digital electronic scales (reading to the nearest 5 g). Gestational age was assessed by first trimester ultrasound and recorded in days.
Small for gestational age was defined as birth weight below the 10th centile of the reference for north west Italy.11 Bronchopulmonary dysplasia was defined as oxygen dependence at 36 weeks postmenstrual age, in addition to radiographic findings and a history of mechanical ventilation.12 Late onset sepsis was defined as a clinical syndrome characterised by systemic signs of infection with increased C reactive protein or a positive culture after 72 hours from birth. Patent ductus arteriosus was defined as the presence of a haemodynamically significant patent ductus arteriosus, pharmacologically or, when necessary, surgically treated. Severe neurological sequelae were defined as the presence of cerebral palsy, or vision and hearing loss of neurological origin, at 2 years of corrected age.
VLBW infants included in this study were classified into two subgroups: (a) a reference group (R-VLBW infants) made up of infants who were the appropriate size for gestational age and without major morbidities—that is, bronchopulmonary dysplasia, patent ductus arteriosus, late sepsis, severe neurological sequelae; (b) a group of infants who were small for gestational age or with major morbidities (M-VLBW infants).
Statistical methods
Individual profiles were fitted with a seven constant, exponential-logistic function (EL7) of age (t)—that is, a logistic function with a lower asymptote modified by an exponential component and an upper oblique asymptote:

This function can model weight loss and weight recovery, and its first derivative can model two peaks of growth velocity, and the slow decrease in velocity that begins after the 3rd month of life.
Model parameters refer to birth weight (α), weight loss (γ0), age at minimum postnatal weight (τ0), age at late neonatal peak (τ1), and to three velocity constants for age periods around the age at minimum postnatal weight (β0), the age at peak velocity (β1), and the end of the second year (γ1). The model was parameterised in such a way—for example, eα instead of α—that the individual growth constants were normally distributed.
From each individual curve, the values of several milestones of growth and growth velocity were derived: birth weight; weight loss; age and weight at minimum postnatal weight; age and velocity at recovery; age, weight, and velocity at the early neonatal peak, at take-off, and at the late neonatal peak; weight and velocity at 6, 12, 18, and 24 months. To evaluate the goodness of fit of the EL7 model, we computed distance and velocity residuals. Distance residuals are the difference between observed and predicted weight. Velocity residuals are the difference between raw velocity—that is, the ratio of weight gain in a given time period to the length of the period—and predicted velocity.
Mean curves for the whole group of VLBW infants and for R-VLBW infants and M-VLBW infants were obtained by fitting the EL7 function to the means of the EL7 estimates of the individual growth milestones listed above. This approach leads to a curve, the shape of which represents the “average shape” of the weight gain and growth velocity pattern. Non-linear least squares estimates of model parameters (for both individual curves and mean curves) were obtained by Marquardt’s method13 using SAS PROC NLIN.14
RESULTS
The mean birth weight and gestational age were 1140 g and 30.4 weeks respectively (table 1). Neonates who were small for gestational age constituted slightly less than 40%. About 30% of the infants had one or more major morbidities. Mean age at full enteral feeding was 12 days. Almost all babies (252 out of 262) were in the neonatal unit for 28 days or more, and none were discharged before the 23rd day. Differences between sexes were negligible.
Characteristics of the babies in the study at birth and during the neonatal and follow up period until to 2 years of age
All VLBW infants showed a postnatal weight loss with a minimum weight between the 4th and 9th day (5th and 95th centile), and a late neonatal peak of velocity between the 7th and 21st week. The large majority of neonates also experienced, between the 2nd and the 6th week, an early neonatal peak of velocity, which appears as a maximum (87 babies) or a convexity (155 babies) of the growth velocity curves. As for goodness of fit shown by EL7 model, within the 7th week, the mean distance residuals do not exceed 30 g; consequently the model underestimates weight by 60 g at most (5 months) and overestimates it by 110 g at most (18 months): mean residuals are always within 1.5% of the attained weight. Mean velocity residuals are small, even if the model tends to overestimate growth velocity during the 1st and 3rd week (by 5.5 g/day at most), and to underestimate it during the 2nd week (by 3.5 g/day at most).
Figure 2 shows the average weight gain curve from 2 to 26 months of postnatal age for all study infants, plotted on the Italian longitudinal growth chart for children up to 3 years.15 The inset shows the same curve from birth to 42 weeks postmenstrual age plotted on the neonatal reference chart for north west Italy.11 Weight decreases up to the 5th day of life (age at minimum postnatal weight) and then increases slowly; on average, recovery occurs at the 17th day of life. Weight, which at birth is between the 10th and 25th centile (at a mean gestational age of 30.5 weeks), in the first 6 weeks increases more slowly than neonatal reference centiles, remaining below the 3rd centile between 34 and 40 weeks postmenstrual age, and still being slightly below the 10th centile at 42 weeks. With respect to the postnatal chart,15 VLBW infant weight is far below the 3rd centile at 2 months, reaches the 10th centile at 15 months, and remains slightly above the 10th centile up to 26 months of postnatal life.

Figure 3 shows average growth velocity (g/day) and rate (g/kg/day). The negative value of growth velocity in the first week corresponds to weight loss. Subsequently, velocity increases and reaches a first narrow peak (21.6 g/day) at 19.9 days (early neonatal peak) and a second, higher peak (33.3 g/day) at 84.3 days (late neonatal peak). Between the two peaks, minimum growth velocity (18.5 g/day)—that is, the take-off of the late neonatal peak—occurs at 29.5 days. After the second peak, velocity decreases slowly, being 9.4 g/day at 1 year and 3.6 g/day at 2 years. The first peak in the growth rate (17.9 g/kg/day) is steeper and occurs earlier (19.5 days) than the corresponding peak in velocity. The second peak (14.1 g/kg/day) also occurs earlier (48.0 days). It is noteworthy that the early neonatal peak in growth rate is higher than the late neonatal peak, at variance with the pattern of growth velocity. Growth rate is 1.15 g/kg/day at 1 year of age and 0.34 g/kg/day at 2 years.
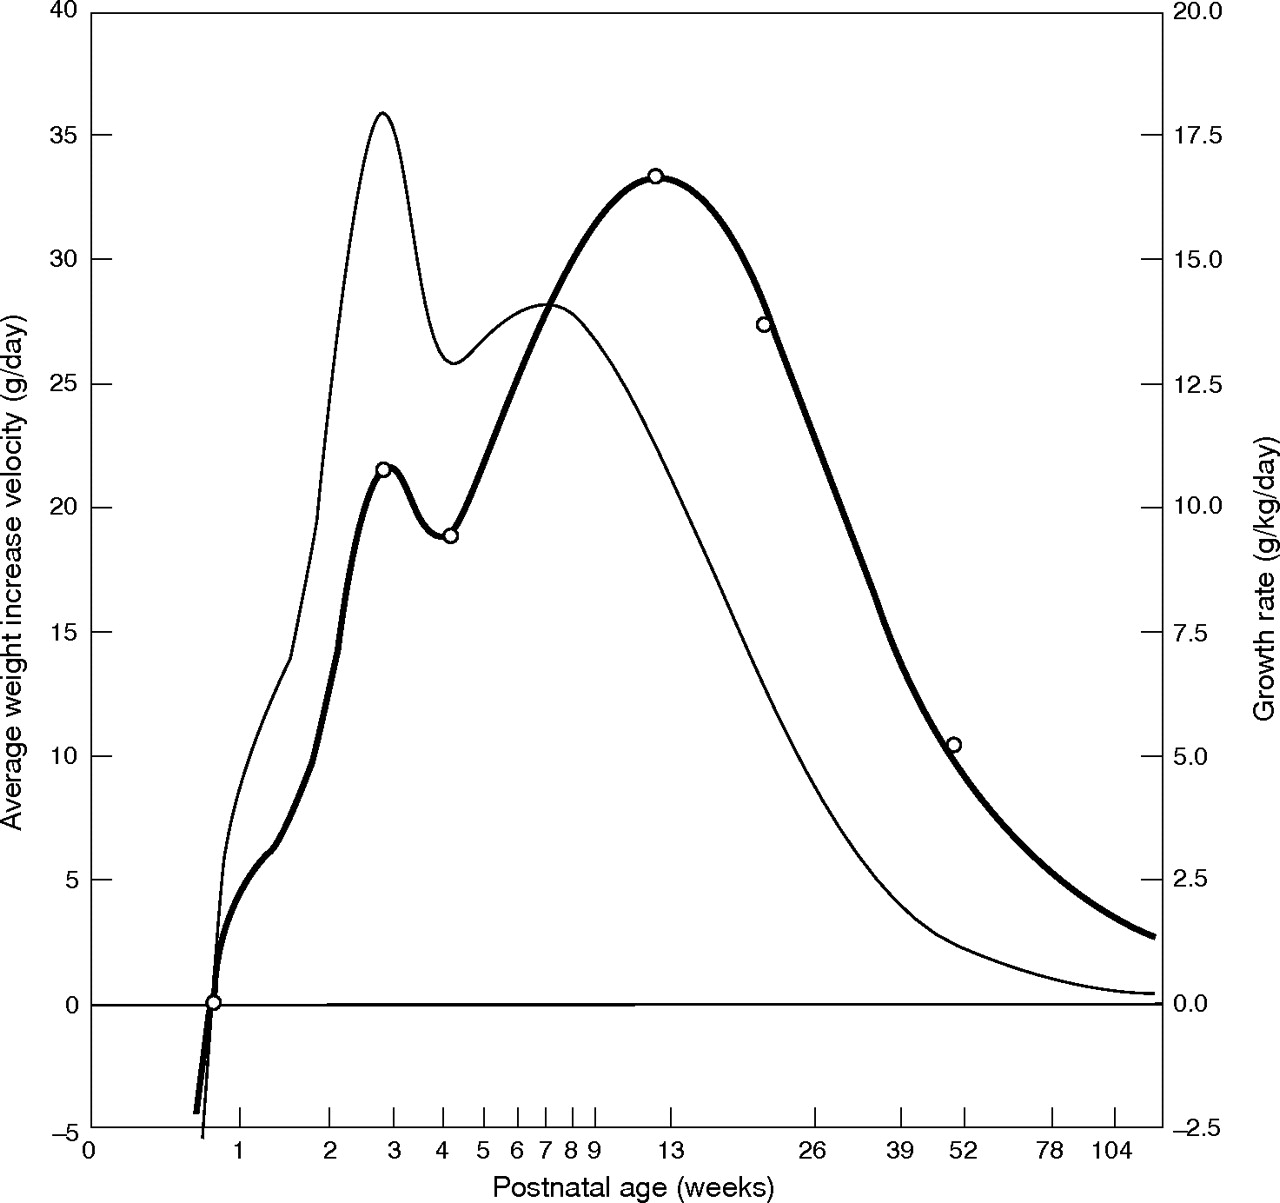
Average weight increase velocity (thick line) and growth rate (thin line) from birth to 30 months of postnatal age (log scale). Open circles are the mean of the EL7 estimates of the individual growth velocity milestones.
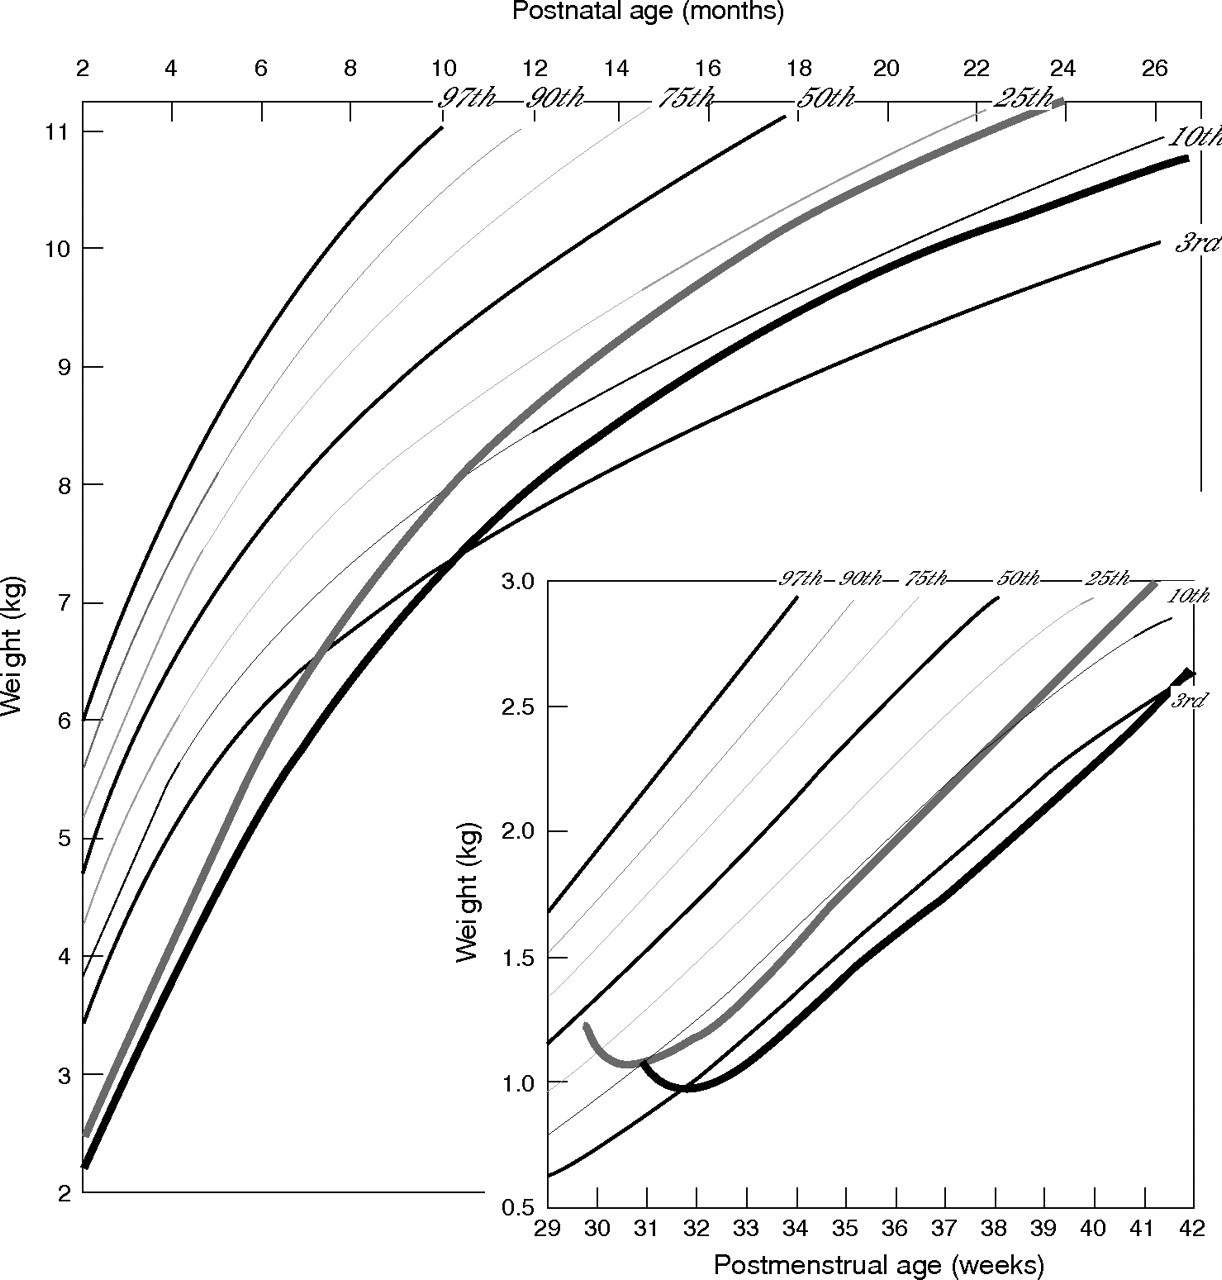
Figure 4 compares weight increase in M-VLBW infants and R-VLBW infants. The difference in weight between the two groups increases in the first year (from 140 g at birth to 680 g at 12 months) more than in the second year (860 g at 24 months). It should be noted that M-VLBW infants have lower birth weight with respect to R-VLBW infants, but the gestational age is higher by 1 week, as all R-VLBW infants are the size for gestational age.

Weight increase from birth to 27 months of postnatal age plotted on the Italian growth chart for girls aged 2–36 months.15 Comparison between small for gestational age babies or those with major morbidities (black line) and reference VLBW infants (grey line). Inset: weight increase from birth to 42 weeks postmenstrual age plotted on the north west Italy neonatal chart for girls.11
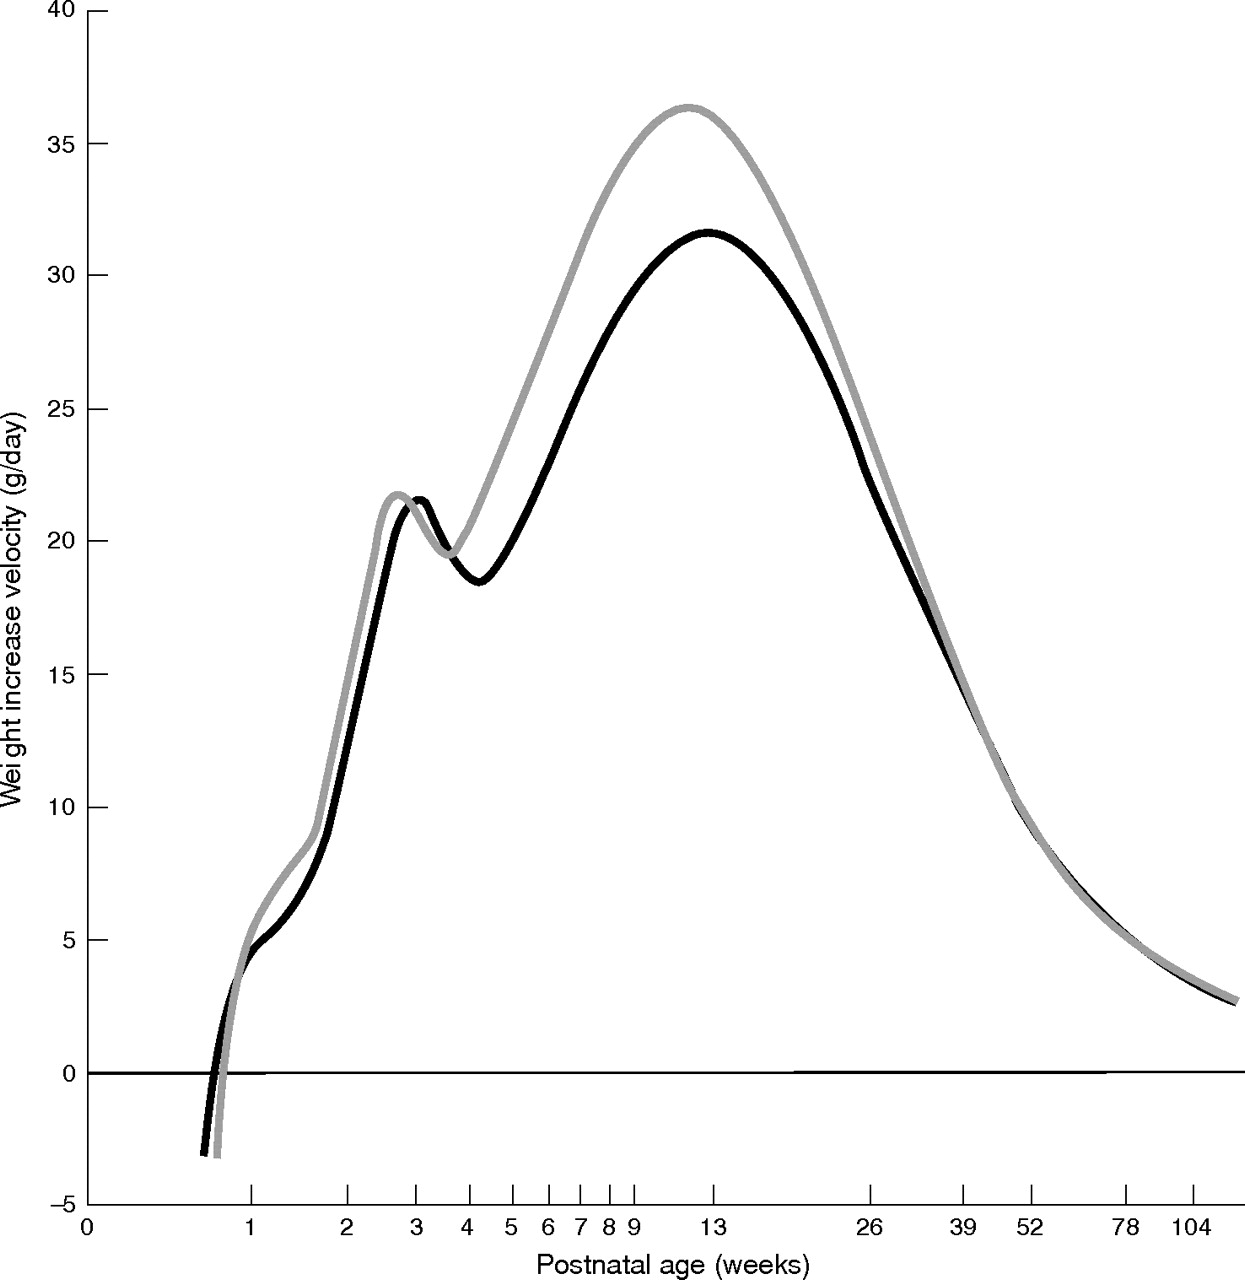
Figure 5 compares weight gain velocity of M-VLBW infants and R-VLBW infants. A difference in growth kinetics between the two groups is already apparent at the 4th week of postnatal age and increases up to the age of the late neonatal peak of velocity. After the peak, the difference decreases sharply: at 6 months it is negligible. As shown in table 2, with respect to R-VLBW infants, M-VLBW infants undergo a smaller weight loss and show a more precocious birthweight recovery, although at recovery their growth velocity is lower. No major differences between the two groups are apparent at the early neonatal peak and take-off. At the late neonatal peak, M-VLBW infants have a lower growth velocity by 4.8 (1.0) g/day.
Milestones of growth during the neonatal and follow up periods up to 2 years of age

Weight gain velocity (g/day) from birth to 30 months of postnatal age (log scale). Comparison between small for gestational age babies or those with major morbidities (black line) and reference very low birthweight infants (grey line).
DISCUSSION
This study presents an in-depth analysis of growth kinetics of VLBW infants from birth up to over 2 years of age, based on 262 growth profiles. The large number of weight measurements per neonate, mainly in the first month of postnatal life, allowed us to design a parsimonious exponential-logistic function (EL7) suitable for describing some milestones of the growth process (weight loss, weight recovery, two peaks of growth velocity), and the slow decrease in growth velocity which begins after the 3rd month of life.
Weight increase
In our series, the pattern of weight gain is similar to those reported in the literature.2,5,16,17 It is noteworthy that, after postnatal weight loss, the weight of these infants does not achieve the birth centile (which is slightly below the 25th centile of reference charts), but remains at the 3rd centile up to the 40th week postmenstrual age. This extrauterine growth restriction during the hospital stay is well known in VLBW infants.5,18 In the second year, a partial weight recovery occurs, which cannot be regarded as “true” catch up growth: weight remains slightly above the 10th centile when postnatal age is considered. Even if corrected age is used (in our series corrected age was about 10 weeks lower than postnatal age), weight is just above the 3rd centile at 2 months of age and remains below the 25th centile up to the end of the second year.
Growth velocity
The very complex pattern of weight increase is better described by a velocity curve. Velocity is negative in the first days after birth, as babies lose weight. Then there are two clear cut peaks of velocity, where the weight curve shows only mild convexities (the first at about 3 weeks, the second at about 3 months). The transient velocity decrease between the two peaks may possibly be ascribed to the discontinuation of parenteral nutrition and the beginning of full enteral feeding, which in most cases occurs in this period. After the late neonatal peak, growth velocity decreases slowly and regularly.
Most studies on VLBW infants and extremely low birthweight infants report a mean growth velocity value in the first 1–3 months of life.2,5,19–21 Of the few authors who assert that growth has a non-linear pattern,6–9,22,23 none has specifically analysed the shape of growth kinetics in the first 2 years of life. Of the authors who have produced growth velocity curves,6–9 only Brandt22 detected an early neonatal peak, occurring at 34.5 weeks postmenstrual age—that is, about the same age at which an analogous peak was observed in our study. Neither early nor late neonatal peaks have been reported by other authors, probably because they based their conclusions on too short a follow up period,6–8 too few measurements,9 or mathematical functions that cannot model peaks.6 All the above studies suffer from methodological problems. Most studies6,22,23 analysed series of neonates more heterogeneous than ours, which included VLBW infants only. In some studies, observations began several days after birth—for example, from the 41st week postmenstrual age—and measurements were taken a long time apart (up to four months).9 Sometimes the assessment of gestational age was only based on the first day of the last menstrual period.7,9,22,23
Growth rate
Growth rate (g/kg/day) is the ratio of growth velocity to weight attained. For this reason, both peaks of growth rate occur earlier than the corresponding peaks of velocity, and the first peak is higher than the second peak. Thus, growth rate gives a misleading picture of growth kinetics, as the contribution of the early neonatal peak to weight increase is much lower than that of the late neonatal peak. In any case, it does not seem advisable to report only a mean value of growth rate as most authors do.5,16,24–26 The peak detected in the third week of life by Anchieta et al,6 who are the only authors who constructed growth rate curves, is hard to interpret because the corresponding growth velocity curves are always increasing.
Growth of M-VLBW infants compared with growth of R-VLBW infants
VLBW infants with major morbidities grow less than reference VLBW infants: at 2 years of age, the difference in weight is about 860 g. Also Ehrenkranz et al5 observe that the presence of major morbidities (chronic lung disease, severe intraventricular haemorrhage, necrotising enterocolitis, late onset sepsis) induces further impairment of weight increase, at least within the 4th month of life. Our study shows that the difference in growth velocity begins at take-off, reaches a maximum at late neonatal peak velocity, and is negligible during the second year of life. Inspection of the velocity curves indicates that there is a critical period between the 2nd and 5th month, during which major morbidities adversely affect growth to a greater extent.
What is already known on this topic
-
VLBW infants have a specific postnatal growth pattern very different from that of higher birthweight, full term infants
-
A detailed description of postnatal growth pattern of VLBW infants should be based on longitudinal studies
What this study adds
-
A detailed description is given of the complex pattern of weight gain and growth velocity of VLBW infants from birth to 2 years of age, individually modelled by an ad hoc designed mathematical function
-
All infants have a main peak of growth velocity, which in almost all cases occurs between the 2nd and 5th month of postnatal life. The more severe growth impairment observed in VLBW infants with major morbidities compared with “reference” VLBW infants is almost entirely due to the reduced height of the main peak of growth velocity
Compared with the neonatal charts of the north west Italian population,11 the weight of R-VLBW infants is slightly lower than the 50th centile at birth, but only between the 10th and 25th centile at 40 weeks postmenstrual age. Compared with the longitudinal growth charts of Italian children up to 3 years of age,15 R-VLBW infants, who are far below the 3rd centile at 2 months, gain weight until 18 months, when they reach the 25th centile, where they subsequently remain. Even if corrected age is used instead of postnatal age, R-VLBW infants remain below the 50th centile. Therefore, both neonatal and infant charts based on the general population appear to be unsuitable for monitoring VLBW infants, whose growth has a different pattern even in the absence of major morbidities. As suggested by CDC,1 specific charts based on R-VLBW infants are required.
CONCLUSIONS
The complex pattern of weight increase and growth velocity of VLBW infants from birth to 2 years of age was satisfactorily described by a mathematical function with a relatively simple structure. The function indicated that all infants have a main peak of growth velocity (the late neonatal peak), which in almost all cases occurs between the 2nd and 5th month of postnatal life. Furthermore, the function showed in most neonates the existence of a minor peak (the early neonatal peak), which in almost all cases occurs between the 2nd and 6th week of postnatal life. To sum up, a single mean value (for either velocity or rate) is an inadequate description of growth kinetics in VLBW infants.
The analysis of growth kinetics indicated that the more severe growth impairment seen in VLBW infants with major morbidities, compared with “reference” VLBW infants, is almost entirely due to the reduced height of the late neonatal peak. The function described above will be suitable for evaluating to what extent and at which ages different pathological conditions affect growth kinetics and for producing model based longitudinal distance and velocity charts specific for VLBW infants.
REFERENCES
Footnotes
-
Published Online First 25 April 2006
-
Competing interests: none declared