Article Text

Abstract
Background: Adverse cognitive and educational outcomes are often ascribed to perinatal hypoxia without good evidence.
Objective: To investigate neurocognitive and behavioural outcomes after neonatal encephalopathy.
Methods: Sixty five children with neonatal encephalopathy, identified using the Trent Neonatal Survey database for 1992–1994, were followed up at the age of 7 years. They were examined at school, with a classmate for those in mainstream school, by a paediatrician and a psychologist. Neonatal encephalopathy was graded as moderate or severe using published definitions.
Findings: Fifteen children had major disability, all with cerebral palsy; eight were in special school with severe cognitive impairment (IQ<55). Disability was present in 6% of the moderate and 42% of the severe encephalopathy group. Of the 50 children without motor disability, cognitive scores were lowest in the severe group (mean IQ difference from peers −11.3 points (95% confidence interval (CI) −19.0 to −3.6) and with similar scores for the moderate group compared with classmates (mean difference −1.7 points (95% CI −7.3 to +3.9). Neuropsychological testing showed similar findings in all domains. In particular, memory and attention/executive functions were impaired in the severe group. Despite relatively small differences in performance of the moderate group, special educational needs were identified more often in both encephalopathy groups, associated with lower achievement on national curriculum attainment targets.
Interpretation: After neonatal encephalopathy, subtle cognitive impairments are found in the absence of neuromotor impairment. Subtle impairments are found more commonly after a more severe clinical course. Studies of brain protection strategies require long term follow up to study effects on cognitive outcome.
- BAS, British ability scales
- NEPSY, neuropsychological assessment scale
- asphyxia neonatorum
- neonatal encephalopathy
- development
Statistics from Altmetric.com
Traditionally the outcome for children after perinatal asphyxia who develop the clinical syndrome of neonatal encephalopathy has been defined in all or nothing terms, either as a healthy or a severely disabled survivor. These severe disabilities encompass spastic dystonic cerebral palsy and severe learning impairment, possibly with cortical visual loss or hearing impairment.
In contrast, there have been few studies describing outcome for the survivors without motor disability at school age. Robertson and Finer1,2 followed two cohorts of infants with carefully defined encephalopathy to school age and measured cognition, behaviour, and the presence of learning difficulties. Children who had mild neonatal encephalopathy were indistinguishable from other admissions to the neonatal intensive care unit or controls; children with severe encephalopathy either died or survived with severe disability; and of those in the moderate encephalopathy group, 5% died and 15% had severe disability. These outcomes are consistent with other data.3 The remaining children with moderate encephalopathy had lower cognitive scores than the mild encephalopathy and control groups. The authors concluded that, after moderate neonatal encephalopathy, children without motor disability were at risk of reduced educational functioning, but that further detailed investigation in this area was needed to identify the extent of this impairment.4
Thus no recent studies have evaluated detailed outcomes for non-disabled children after encephalopathy. In particular, the questions posed by Robertson and Finer about underlying deficits have not been addressed. The aims of this study were therefore to identify the cognitive, behavioural, and neuropsychological outcome for non-disabled school age children after neonatal encephalopathy.
METHODS
Population
The cases were identified from the Trent Neonatal Survey database of babies with defined neonatal conditions born in the former Trent region of the United Kingdom between April 1992 and April 1994. Babies were included if they were born at 35 or more completed weeks of gestation and recorded as having neonatal seizures or “encephalopathy”. Individual case records were reviewed blind to outcome. We adopted a classification based on a broad clinical definition of severity of encephalopathy as reported previously.5 A moderate encephalopathy was one presenting in the first week after birth either as seizures alone or any two of the following: abnormal consciousness; difficulty maintaining respiration (of presumed central origin); difficulty feeding (of presumed central origin); abnormal tone and reflexes. All had to have lasted for longer than 24 hours. Children with severe encephalopathy were those who fulfilled one or more of the following criteria: ventilation for more than 24 hours; two or more anticonvulsant treatments required; comatose or stuporous.
After research ethics approval from the local research ethics committee of each hospital contributing patients to the database, families were approached through the consultant responsible for their child’s care in the neonatal period and asked if they would participate in this study and for permission to examine their medical case records. Families had not been forewarned that follow up was intended. Follow up contact for non-responders was through the same paediatrician to maintain confidentiality.
Assessments
The children were assessed in their school setting by a paediatrician (CR) and a psychologist (AR) employed for the study. Children attending a mainstream school were seen along with a comparison child, matched for sex, ethnic group, first language, and age to within 3 months, randomly selected from three identified by the headteacher. For children who attended a special school, no comparison child was selected.
Cognitive function was measured in children at mainstream schools using the British ability scales (BAS-II) school age battery6 and NEPSY (a neuropsychological assessment scale).7 BAS-II provides a means of assessing a child’s current level of intellectual functioning, encompassing the child’s overall general cognitive ability, a special non-verbal composite score for children who are unable to complete verbal tasks, verbal, spatial, and non-verbal reasoning cluster scores. The NEPSY was designed to assess neuropsychological performance in children with acquired brain injury in five domains: attention/executive function; language; sensorimotor function; visuospatial processing; memory and learning.
For the small group of eight children who attended special school, cognitive assessment was appropriate to their level of cognitive skills using either the BAS-II early years battery (3–5 years) or the Griffiths developmental scales8 (<3 years).
Behaviour was assessed using the strengths and difficulties questionnaire.9 Everyday memory was assessed using a rating scale adapted from established measures,10 in addition to the observed measures of verbal and pictorial short term memory that form part of NEPSY. Laterality and manual dexterity were assessed using items adapted from the movement ABC.11 Hand preference was determined by observation of seven tasks (picks up block/ball, places cube, uses spoon/pencil/crayon, and points to picture) each repeated twice. Scores (−14, left; +14, right) were summed and transformed to score from 0 (all tasks left handed) to 1 (all tasks right handed). Teachers completed the strengths and difficulties questionnaire and indicated the child’s current level of achievement for English and mathematics attainment targets, together with information on their educational needs.
All children had a structured neurological examination to detect signs of cerebral palsy12 and minor motor dysfunction13 by a single experienced paediatrician trained in the assessments (CR). Neurological signs were scored and summed to produce a neurological score. Disability was classified according to international definitions.14 Cerebral palsy was classified retrospectively according to the descriptions of function for each limb in children with abnormal results on neurological examination independently of the degree of disability.
Statistical analysis
Data were entered on to an Access double entry validation database. Statistical analysis was performed using SPSS (version 10). Groups were compared using Student’s t test, χ2 test, or the Mann-Whitney U test as appropriate.
RESULTS
We identified 130 eligible children from the Trent Neonatal Survey database, of whom 10 had died after discharge from hospital. Of the remainder, the families of 68 (56%) children agreed to participate. Of the children not assessed, three were lost to follow up (all adopted), 15 parents refused consent, and 34 families did not respond to three attempts at contact. Using the data held by the Trent Neonatal Survey, responders differed from non-responders only in that significantly fewer were of low birth weight (table 1).
The 68 study cases were examined at a median age of 86 months (range 78–108), and 49 comparison children at 85 months (76–96). The comparison group was well matched over a range of variables with the encephalopathy group without motor disability (table 2). Neonatal records or case summaries were abstracted, and the neonatal course graded after the completion of the outcome evaluation. Of the 68 children, three had no evidence of a moderate or worse neonatal encephalopathy as defined above on review of their clinical notes and were excluded (all had single or brief neonatal seizures without any other symptoms). No child had a congenital neurological abnormality or a postnatal cause for encephalopathy. Full clinical records were only available for 63 of 65 children, and data were not recorded in a standard format. The clinical perinatal course of the children with encephalopathy is detailed in the appendix table.
In 15 cases, cerebral palsy was present all with major disability, eight (53%) with quadriplegia, one with diplegia, and six with hemiplegia. Two of these had sensorineural hearing loss and one cortical blindness (each with quadriplegia). Seven (46%) of the children with cerebral palsy attended mainstream school (one a joint placement with a special school). Eleven of 15 (73%) had a standardised developmental score (BAS-II or Griffiths) below 85, eight of whom (53%) had scores <55 (severe learning difficulty). Two children (one with diplegia, one with hemiplegia) were from the moderate encephalopathy group (6% with motor disability), and the remaining 13 were from the severe encephalopathy group (42% with motor disability). The psychometric data of these children were excluded from further analysis.
Formal detailed neurological assessment in children without disability showed that the total scores for minor neurological signs in the severe (median 20 (interquartile range (IQR) 19–22)) and moderate (median 20 (IQR 19–22)) encephalopathy groups were similar to those in the comparison children (median 19 (IQR 18–21.25)). On a battery of 14 tests, 31% (15/49) of comparison children showed non-right hand preference (score ⩽0.5) compared with 37% (12/32) of the moderate group (p = 0.64 (Fisher’s exact test)) and 56% (9/16) of the severe group (p = 0.08). No child without motor disability had a seizure disorder or required hearing aids, although hearing was not formally assessed.
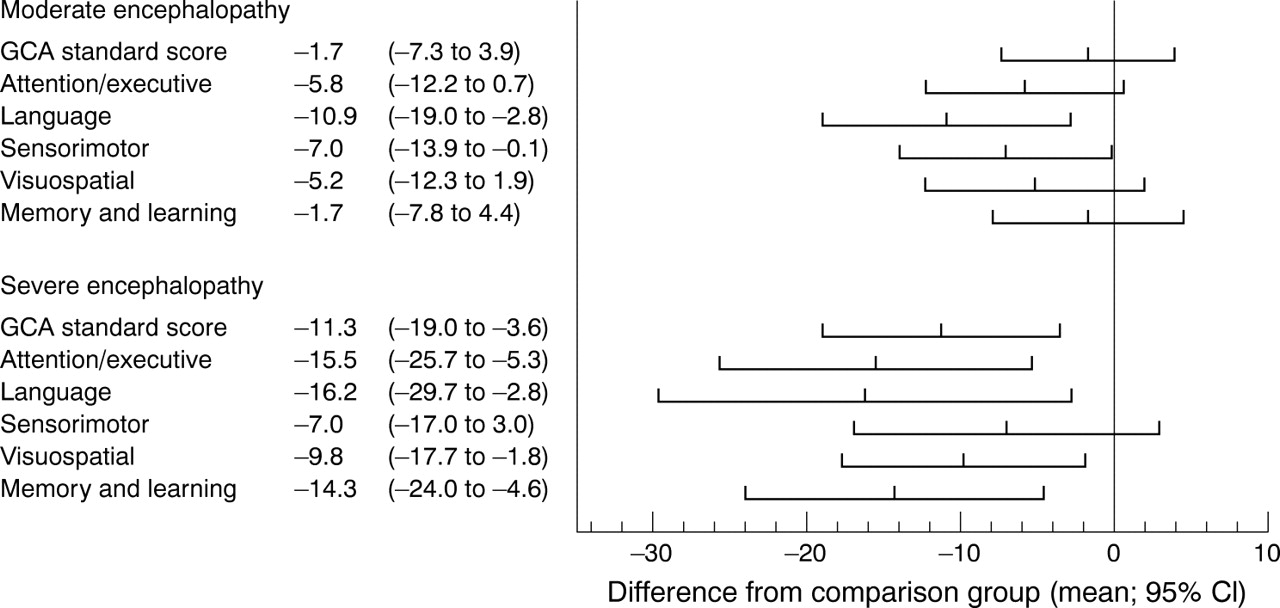
Children in the encephalopathy groups scored less well on cognitive testing than the comparison children. Comparisons were stratified by grade of encephalopathy. For the moderate encephalopathy group, scores did not differ significantly from those of comparison children for general cognitive ability (mean difference 1.7 points (95% confidence interval (CI) −7.3 to +3.9) or subscale scores (table 3). In contrast, the severe encephalopathy group scored lower than comparison children or the moderate group (mean differences in general cognitive ability 11.3 (95% CI 3.8 to 18.8) and 9.6 (95% CI 2.5 to 16.7) respectively) and in all subscales.
Over the five NEPSY standardised domain scores (table 3), children in the moderate encephalopathy group scored significantly lower than comparison children in the language and sensorimotor scales, and the scores for the severe group were lower than for the comparison group in all domains (fig 1: mean differences range from 7.0 to 16.2 points). Compared with the moderate group, attention/executive and memory domain scores were significantly lower in the severe group (mean differences 9.7 (95% CI 0.4 to 19.0) and 12.6 (95% CI 4.5 to 20.7) respectively). In the memory domain, compared with the comparison children, children with moderate encephalopathy had lower subscale scores for narrative memory and sentence repetition, but similar scores over the other subscales, whereas children with severe encephalopathy scored significantly lower for memory for names, narrative, and orientation in time and place (table 3).
With the parent report everyday memory scale, similar mean scores were seen for comparison children (mean (SD) 17.8 (8.2); n = 44) and those with moderate encephalopathy (19.0 (9.3); n = 32), but higher impairment scores were reported for the severe encephalopathy group (31.7 (13.0); n = 18; p<0.001).
Parents reported higher overall behavioural scores in the severe encephalopathy group (median (IQR) 13.5 (6–19)) compared with either of the other groups (comparison 7 (4–10), p = 0.02; moderate encephalopathy 7 (5–14), p = 0.08) (table 4). Eight (50%) of the children in the severe encephalopathy group scored in the abnormal range compared with 9% (n = 4) and 16% (n = 5) in the other two groups respectively. If the subscale scores are compared, the severe group differed significantly from the others only in terms of reported hyperactivity. Teachers also reported significantly higher scores in the severe encephalopathy group (14 (10–17)) compared with the moderate encephalopathy and comparison groups (6 (3.75–12), p = 0.01), 5.5 (2–11;), p<0.01) respectively. For 40% (n = 6) of the children in the severe encephalopathy group, the scores were rated as abnormal compared with 11% (n = 3) and 14% (n = 6) of the moderate and comparison groups. Teachers independently reported higher hyperactivity and emotional problem subscores in the severe encephalopathy group, with less pro-social behaviour and greater impact on daily functioning/everyday life. Pervasive behaviour disorders (which are defined in this context as overall behaviour scores rated as abnormal by both parents and teachers) were found in 5/22 (23%) in the severe encephalopathy group compared with 8% (2/26) of the moderate and 2% (1/42) of the comparison group.
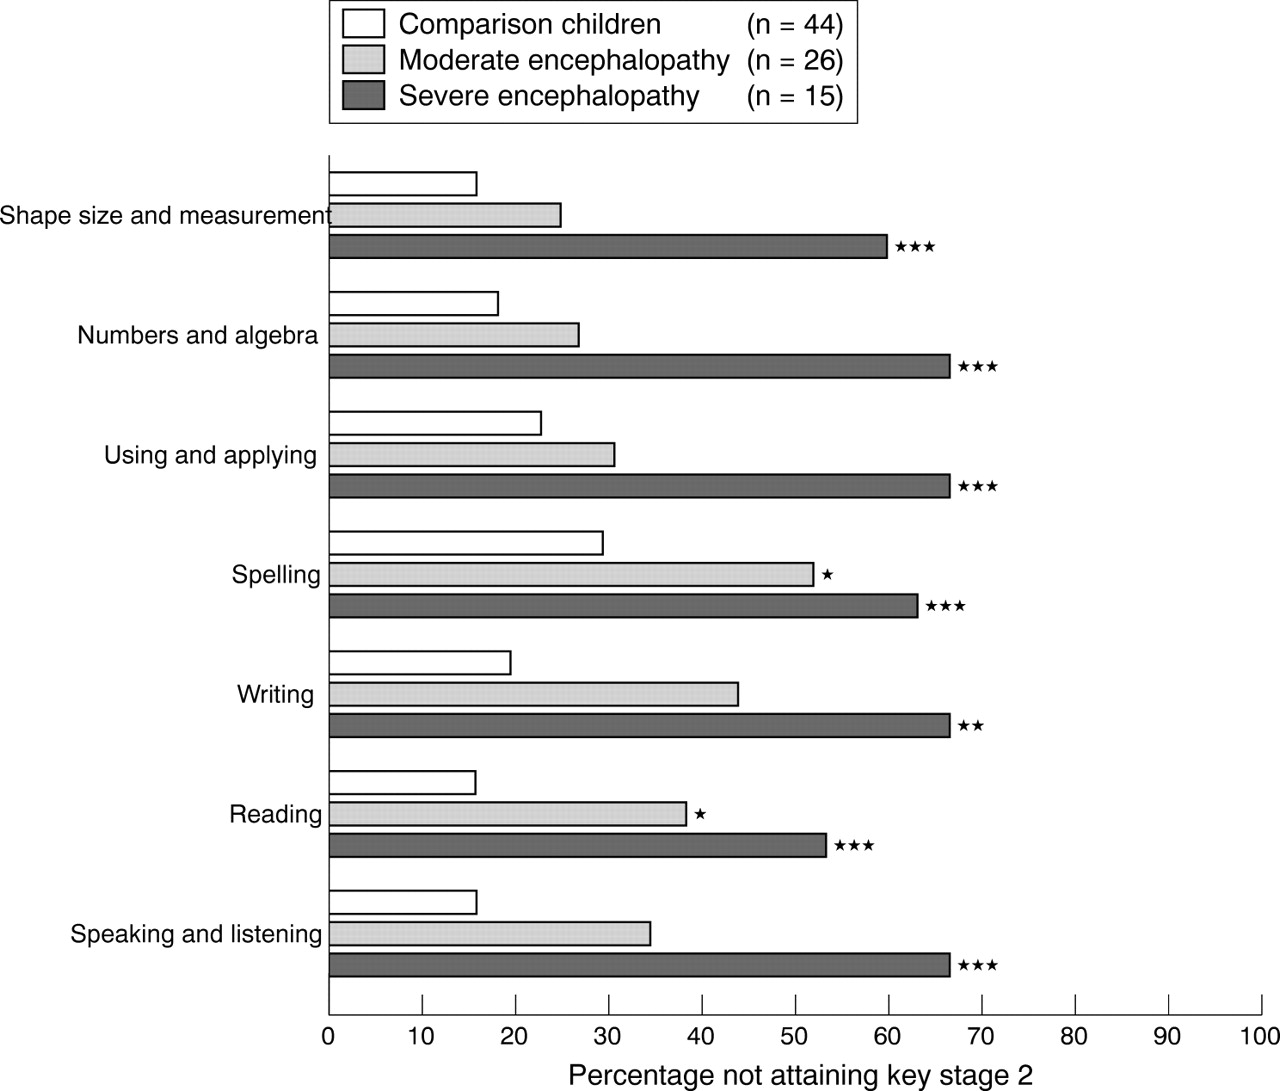
The distribution of scholastic achievement for non-disabled children was measured using a teacher assessment of current level of attainment for the national curriculum targets for English and mathematics. The attainment levels differed between the three groups. Achievement was at lower levels for both encephalopathy groups compared with comparison children across all seven attainment targets and at lower levels for the severe encephalopathy group compared with those in the moderate group. Figure 2 shows the proportion who failed to reach attainment level 2 (the expected level of achievement for age) in each area for the whole cohort. Children in the severe encephalopathy group significantly underachieved in all attainment targets, whereas the moderate group significantly underperformed for spelling and reading only. Information was also collected and analysed for the identification, description, and process of educational special needs (table 5). If children with motor disability are excluded, in the severe encephalopathy group 10 of 15 children (67%) were identified as having special needs, but only two had completed the educational statement process, and six were identified by their teachers as having unmet needs.
DISCUSSION
Although the risk of disability after neonatal encephalopathy is well documented, there are very few studies that provide detailed assessment of longer term outcomes. We have used a regional cohort of children prospectively identified as having neonatal encephalopathy on clinical grounds. Because there were very few surviving children with stage 3 encephalopathy as defined conventionally using the criteria first described by Sarnat and Sarnat,15 we used definitions used in a similarly based regional cohort study.5 This allowed us to define moderate and severe groups for the purposes of this paper. We show that children who have had neonatal encephalopathy have poorer scores on cognitive, neuropsychological, educational, and behavioural assessments than classmates, and that these are particularly evident in children after severe encephalopathy. This persists after the exclusion of children with neurological disability from this group. These differences result in poorer educational outcomes, and these children are more likely to require extra educational assessment, teaching provision, and support, despite no overt clinical or functional neuromotor differences, than non-encephalopathic peers.
These differences appear to be more manifest in those with more severe neonatal encephalopathy, defined pragmatically by receipt of interventions rather than by neurobehavioural assessment. Indeed on most measures, the children in the severe encephalopathy group score significantly worse than those in the moderate group, who in turn are consistently lower performers than their classmates, although this does not reach statistical significance for most comparisons. The distribution and frequency of severe cerebral palsy with disability in our cohort was 42% (13/31) in the severe encephalopathy group and 6% (2/34) in the moderate group. Increasing severity of this clinical syndrome appears to be associated with poorer neurocognitive functioning in a dose-response relation, with the spectrum of poor performance on focused tests extending to severe disability and cerebral palsy in those most severely affected.
On cognitive testing, children in the moderate encephalopathy group have overall ability scores similar to their classmates. The subscale profile is also similar. Likewise, behavioural assessment scales do not identify particular problems for this group. However, language domain scores on the NEPSY are lower in this group, and scores for narrative memory and sentence repetition are also impaired. Other subscales and parent reported everyday memory skills are similar to those of their classmates. These relatively small differences from their peers on detailed testing, however, translate into significantly lower attainment levels for reading and spelling, using the independently collected national curriculum attainment targets for English and mathematics. These differences are not paralleled by differences in sociodemographic factors.
In contrast, the children who have had severe neonatal encephalopathy, using this pragmatic definition, have a much greater burden of disability and poor neuropsychological functioning. Behavioural problems, presenting as hyperactivity or inattention, were found to co-exist or be causally related. Cognitive ability is significantly poorer than in either classmates or children who had moderate encephalopathy for overall ability and all subscale scores, except for the comparison of verbal ability between severe and moderate groups. NEPSY domain scores are also lower than for classmates across the whole range, although only attention/executive and memory scores differentiate the moderate and severe groups. Within the severe group, memory for names, orientation, and reported everyday memory function were also significantly poorer than for either comparison children or the moderate encephalopathy group. Therefore for the young child, whose daily activities focus around learning and developing new cognitive and social skills, the effects of encephalopathy are particularly detrimental, reducing their capacity to acquire and consolidate knowledge.
There have been recent case reports of specific memory impairment after cerebral hypoxia in older children and adults.16,17 In all cases there was severe impairment of episodic memory (memory for events) with relative preservation of semantic memory (memory for facts). In a further neuropsychological investigation of the Edmonton cohort, specific problems with auditory learning and recall, binaural sequencing and labelling were also observed.18 The results from our study suggest that children who have had encephalopathy have impaired short term auditory memory function and are poorly orientated. Children in the severe group also experienced a deficit of skill for everyday memory functioning. This study seems to imply a dose-response effect of hypoxia within a group with Sarnat stage 2 encephalopathy.15 Magnetic resonance imaging has not been performed in this cohort, but would help to define the range of brain lesions (to consider the likely aetiology in retrospect19) and to assess hippocampal development.
This study was designed using children identified from a database collected for epidemiological purposes, and no attempt was made to define the aetiology, extent, or timing of the hypoxic injury to the fetal and neonatal brain. The brain injuries to the children in this cohort are therefore of mixed aetiology, but we were careful to exclude those who had an identified specific non-hypoxic aetiology (before the cohort was defined) or who had seizures without any other evidence of encephalopathy. The definitions of encephalopathy developed by the Western Australia group5 are essentially care based, implying that increased support and intervention are a feature of a more severe insult. Similar results were observed when we analysed the data using “need for ventilation” as a criterion for severity. We thus believe that this is a valid definition for data collected retrospectively from the neonatal clinical records.
The response rate to this study was low in comparison with prospective follow up studies of preterm infants. We believe that this was because the study needed to recruit parents and children some years after a perinatal event who were not previously made aware that we would be contacting them for the study. Furthermore, because of issues of confidentiality, it was not possible for the research team to approach families directly. In these circumstances, it was necessary for us to encourage the original paediatrician to follow up non-responders with a further letter. Given this situation, we believe that the 56% follow up rate is the best we could achieve. The responders did differ from the non-responders for one of the variables stored on the Trent Neonatal Survey database (table 1), namely fewer children of low birth weight were assessed. This apart, the study group appears to be a representative sample of the encephalopathic population across the Trent region. Where a sample of such a cohort is identified, there is evidence that the non-responders may comprise an excess of those children with problems, particularly in preterm populations.20 However, had this effect occurred, it would only have served to increase the differences between the study children and their peers.
We have confirmed the persistence of cognitive and educational deficits in school age children in a population born in the early 1990s which was formerly observed in two cohorts of children born 10–15 years previously.4 Robertson and Finer reported worse cognitive scores among children with prospectively defined moderate encephalopathy (Sarnat stage 2) born in the mid 1970s, compared with children with mild encephalopathy or controls. No child with severe encephalopathy survived free of cerebral palsy and severe disability. A further study indicated that fewer moderately encephalopathic children were considered ready for kindergarten. Robertson and Finer indicate unanswered questions on the impairment observed in their cohort, which have to our knowledge not been studied further until now. Our study shows major impairment of memory, confirming their findings in this regard, and also a gradation of impaired performance as the symptoms of encephalopathy worsen.
More recently, Moster and colleagues21 evaluated outcome at school age after low Apgar scores by using a parent report questionnaire from children born between 1983 and 1987. In this study, a low Apgar score (0–3) was predictive of learning and behavioural problems only if associated with an encephalopathic syndrome, defined as neonatal seizures, feeding difficulties, or need for ventilation. However, the study was not structured to identify any pattern of neuropsychological impairment.
What is already known on this topic
-
Children who survive moderate or severe neonatal encephalopathy without cerebral palsy are generally considered to have a “normal outcome”
-
One previous study identified mild to moderate learning problems in “normal” survivors
What this study adds
-
Learning difficulties are common after neonatal encephalopathy, and comprehensive school assessment of ability is recommended
-
Motor problems are uncommon in the absence of cerebral palsy, but memory and attention/executive functions are particularly problematic
The results of our study and these two studies are in contrast with the observations of Kjellmer and colleagues,22,23 who were unable to identify noteworthy educational, social, or neuropsychological impairment in 31 adults documented to have required neonatal cardiopulmonary resuscitation, of whom only 11 had encephalopathy. The median IQ scores for both the non-encephalopathic and encephalopathic groups were, however, 10 points lower than that of the control group. Although this may be a clinically important effect, the power of this study was inadequate to reach statistical significance.
A further study failed to identify clinically significant differences between children after neonatal encephalopathy and controls: the Western Australia study, an epidemiological cohort study which used broad inclusion criteria for neonatal neurological abnormality (seizures and disturbance of consciousness, abnormal tone and reflexes, and feeding or respiratory control of presumed central origin) reported outcome after “encephalopathy” in the early preschool years.24 There were significant differences between the 241 cases and 563 control children at a median age of 18 months in all areas, measured by the Griffiths’ developmental scales. However, in the subgroup without cerebral palsy or other evidence of non-hypoxic aetiology, these differences, although statistically significant, were much less obvious and amounted to only 3 points for overall Griffiths’ developmental quotients.
Our data have important implications in two areas. Firstly, they confirm a high prevalence of subtle impairment in children who escape severe disabling conditions after neonatal encephalopathy. Careful educational assessment is required to optimise the opportunity for individuals. Secondly, for the current studies of brain protection strategies, the period of follow up must be of sufficient duration and rigour to determine a full profile of outcomes such as we have described here. Indeed, prevention of later subtle impairments may be considered to be a suitable goal for these studies.
APPENDIX
Perinatal variables in the children with neonatal encephalopathy
Comparison of baseline data for responders and non-responders
Age at testing and sociodemographic characteristics of the study children
Results of British ability scales (BAS-II) and NEPSY testing for study children without motor disability
Results of the strengths and difficulties questionnaire for study children without motor disability
Educational special needs

Mean (95% confidence interval) of differences between moderate and severe encephalopathy groups and comparison children for overall general cognitive ability (GCA) score (British ability scales 2E) and the five NEPSY domain standardised scores.

Proportion of non-disabled children in severe or moderate neonatal encephalopathy and comparison groups who failed to reach attainment level 2 (the expected level of achievement for age) for the national curriculum targets for English and mathematics. Comparisons were made using χ2 tests: *p<0.05; **p<0.01; ***p<0.001. In the moderate group, n = 25 for writing and spelling.
Acknowledgments
This study was supported by a grant from the Trent NHS R&D Regional Research Fund. We are grateful to the Trent Neonatal Survey for the identification of the cohort and to the parents and children of Trent for their support and cooperation. ESD is funded by Eastern Leicester PCT.
CONTRIBUTORS
NM conceived the project, obtained the funding, and was responsible for the writing up of this document. ASR and CER were responsible for data collection, data entry, and initial analysis and contributed to the writing up. ESD identified the patients, was responsible for the statistical analysis and interpretation, and contributed to the writing up.
REFERENCES
Footnotes
-
Competing interests: NM has received support for travel to academic meetings and honoraria for teaching and lecturing from several commercial companies connected with neonatal medicine. ASR, CER, and ESD have identified no competing interests.
-
Role of funding agency in study: none