Article Text

Abstract
Aim: To define growth outcomes of a geographically defined population of extremely preterm babies.
Population: The EPICure study identified all surviving children in the United Kingdom and Ireland born at ⩽ 25 weeks 6 days gestation between March and December 1995. Of 308 survivors, 283 (92%) were evaluated at 30 months of age corrected for prematurity.
Methods: Growth was measured as part of a medical and full neurodevelopmental assessment. Growth parameters were evaluated in relation to other 30 month outcomes and perinatal variables.
Results: The children were smaller in each of the five growth measures compared with published population norms: mean (SD) standard deviation scores were −1.19 (1.32) for weight, −1.40 (1.37) for head circumference, −0.70 (1.19) for height, −1.00 (1.38) for body mass index, and −0.75 (0.95) for mid-upper arm circumference. Despite being of average size at birth, children were significantly lighter with smaller head circumferences at the expected date of delivery, compared with population norms, and only weight showed later catch up, by 0.5 SD. Poorer growth was found in children whose parents reported feeding problems and with longer duration of oxygen dependency, as a marker for neonatal respiratory illness. Although severe motor disability was associated with smaller head circumference, overall there was no relation between Bayley scores and head growth.
Conclusions: Poor growth in early childhood is common in extremely preterm children, particularly when prolonged courses of systemic steroids have been given for chronic lung disease. Improving early growth must be a priority for clinical care.
- development
- prematurity
- growth
- EDD, expected date of delivery
- BSID-II, Bayley scales of infant development second edition
- OFC, occipitofrontal head circumference
- MUAC, mid-upper arm circumference
- BMI, body mass index
Statistics from Altmetric.com
- EDD, expected date of delivery
- BSID-II, Bayley scales of infant development second edition
- OFC, occipitofrontal head circumference
- MUAC, mid-upper arm circumference
- BMI, body mass index
Poor growth during the early years is well documented in children born prematurely.1–5 The potential for catch up growth is uncertain, both in the group as a whole2,5–8 and in those with chronic lung disease.9–11 The relation between perinatal morbidity and subsequent poor growth is likewise poorly defined. Much of this uncertainty arises because many studies describe small incomplete cohorts, using differing reference populations and definitions of growth failure. Almost all studies report their findings in terms of birth weight rather than gestational age. This introduces bias, as children with fetal growth restriction but more mature gestational age are included.12
We conducted a prospective study of all babies born between 20 weeks and 25+6 weeks gestational age in the United Kingdom and the Republic of Ireland over a 10 month period beginning March 1995 (the EPICure study). We have previously published outcomes for 1256 reported live births, 811 of whom were admitted for neonatal intensive care.13 The neurodevelopmental outcome of the 308 surviving children was assessed at 30 months of age corrected for prematurity.14 This paper has three objectives, firstly to describe the growth of this cohort at 30 months, secondly to examine associations at 30 months between poor growth and feeding problems, neurodevelopmental disability, and respiratory problems after discharge from hospital, and thirdly, using logistic regression analysis, to examine relations between a range of demographic and early clinical items and later severe growth failure.
METHODS
Population
The method of data collection has been described previously.13 Information for all births between 20 weeks and 25 weeks 6 days of gestational age was collected using a delivery room log, and more detailed clinical record forms were completed for babies admitted for neonatal intensive care. For this analysis, measurements made at birth and as close as possible to the expected date of delivery (EDD) have been used.
The outcome of 283 of the 314 babies discharged from hospital was assessed as close as possible to 30 months of age corrected for prematurity, between January 1998 and January 1999. Of those not evaluated, six had died, and six families were abroad. The parents of 19 children declined the invitation for a formal assessment.
Assessment at 30 months
Each child was examined in a hospital outpatient clinic or health centre near to the family home (n = 235) or at home if this could not be arranged (n = 48). The details have been described previously.14 The areas of assessment relevant to this paper comprised a feeding and respiratory history obtained using a semistructured interview, clinical examination (including structured neurological assessment), a developmental assessment (Bayley scales of infant development second edition (BSID-II)),15 and measurements of growth. For clinic assessments, height and weight were measured using clinic equipment. At home, babies were weighed using electronic scales, and length was measured using a Rollermat (Child Growth Foundation, London, UK). Measurement of maximum occipitofrontal head circumference (OFC) and mid-upper arm circumference (MUAC; a measure of “fatness” or an independent indicator for nutritional assessment) was made using a LASSO-O tape (Child Growth Foundation). Disability was classified using a standardised scheme16,17 into children who had severe disability, other disabilities, and no disability (with or without impairment). Children with severe disability had non-ambulant cerebral palsy, a BSID-II score of < 55 (more than 3 SD below the mean), blindness, or profound deafness. The “other” category comprised children with other functional loss or a BSDI-II score of < 70.
Data collation and analysis
Standard deviation scores (SD scores) for weight and OFC at birth and at EDD, and for weight, height, body mass index (BMI), and OFC at 30 months were calculated using a computer program based on UK population norms.18 Weight and OFC at birth in the surviving children were also compared with measurements from the 811 admitted babies. The standard deviation score for MUAC was calculated using WHO population standards.19
The findings at the 30 month assessment were collected using a standardised proforma and posted to the study centre. Data were encoded for computer analysis using double entry and comparison of files for accuracy. The data were explored and outliers checked before they were combined with the main study dataset for analysis.
Univariate and multivariate regression analyses were performed using STATA, version 5.0 (Stata Corp, College Station, Texas, USA).20 A forward stepwise procedure was used to establish independent factors associated with growth in the following sequential time frames: variables present before pregnancy, those arising or occurring during pregnancy, those present at birth (including birth weight and gestational age), those measured on the first postnatal day, during the neonatal stay until discharge, those arising after discharge, and social factors collected at follow up. For ordinal factors—for example, the duration of postnatal steroid treatment—the better of a binary or linear variable is quoted despite little statistically significant difference between them. Finally, logistic regression was carried out to determine the association with extremes of outcome. As there were a few extreme outcome measures and several small predictor groups, a few extreme values were truncated to values more appropriate to their quartile, 7 for head circumference, 3 for height, 3 for weight, and 4 for BMI. These truncated data were only used in the univariate results in the appendix (www.archdischild.com/supplemental), and the multivariate analysis of predictors of outcome at 30 months in table 5. It ensured that the outcomes all closely followed a normal distribution.
Ethical issues
Investigators obtained permission to participate in this study from their local research ethics committee before beginning the original data collection. Formal signed consent for the assessment at 30 months was obtained from all the families.
RESULTS
Growth parameters
Of the 283 children that were assessed, measurements were taken at birth (range 22+1 to 25+6 weeks) for weight (n = 283) and head circumference (n = 191), and around EDD (range 36 to 43+6 weeks) for weight (n = 244), length (n = 73), and head circumference (n = 236). At a median age of 30.1 months corrected for prematurity (range 27.97–39.93), measurements were obtained for weight (n = 271), height (n = 258), head circumference (n = 278), and MUAC (n = 278).
The birthweight distribution of the 811 babies admitted to neonatal units and the influence of gestational age, sex, and plurality have been described previously.13 Relative to published UK normative data, the mean (SD) birthweight SD score of the babies admitted at or below 23 weeks gestational age was +0.44 (1.03); at 24 weeks it was +0.14 (0.85), and at 25 weeks it was −0.15 (0.87).
The mean birth weight, after adjustment for sex and gestational age, of those who were assessed at 30 months relative to all neonatal admissions was 0.21 SD above the mean at ⩽ 23 weeks, +0.29 SD at 24 weeks, and +0.19 SD at 25 weeks gestational age (table 1). Equivalent scores derived from the published UK normative data for live births at these gestational ages gave SD scores of +0.85, +0.41, and +0.03 SD at each gestational age respectively (table 1).18 In contrast, compared with the total admitted population, the head circumference at birth of those assessed at 30 months was closer to the mean (+0.19, +0.20, and +0.03 SD at ⩽ 23, 24, and 25 weeks respectively). Compared with the UK published normative data, head circumferences at birth were relatively large at lower gestations (+0.68, +0.25, and −0.11 SD respectively), showing a similar relation to that of birth weight (table 1).
Children assessed at 30 months: growth parameters at birth, expected date of delivery (EDD), and 30 months of age expressed as mean (SD) standard deviation scores among 283 children born at 25 completed weeks gestation or less
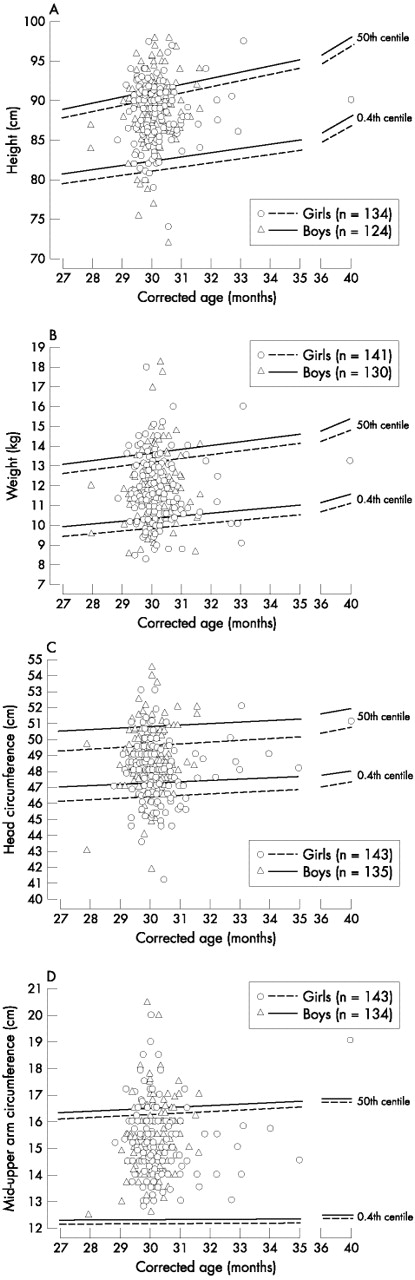
At 30 months of age corrected for prematurity, the children were smaller on average in each of the five growth measures with respect to the published population norms (table 1). Mean SD scores were −1.19 SD for weight, −1.40 SD for head circumference,–0.70 SD for height, −1.00 SD for BMI, and–0.75 SD for MUAC.
Figure 1 shows raw data relative to the 50th and 0.4th centiles for boys and girls, plotted against the age at assessment corrected for prematurity. The weight of 68 children (25%) was more than 2 SD below the mean, and for 22 (8%) below −3 SD. For head circumference, 103 (37%) had measures below −2 SD, and 43 (16%) below −3 SD. Fewer children had height, BMI, or MUAC below −2 SD (34 (13%), 54 (21%), and 19 (7%) respectively).

Raw growth data for height (A), weight (B), head circumference (C), and mid-upper arm circumference (D) plotted against age corrected for prematurity for children of 25 weeks gestational age or less.
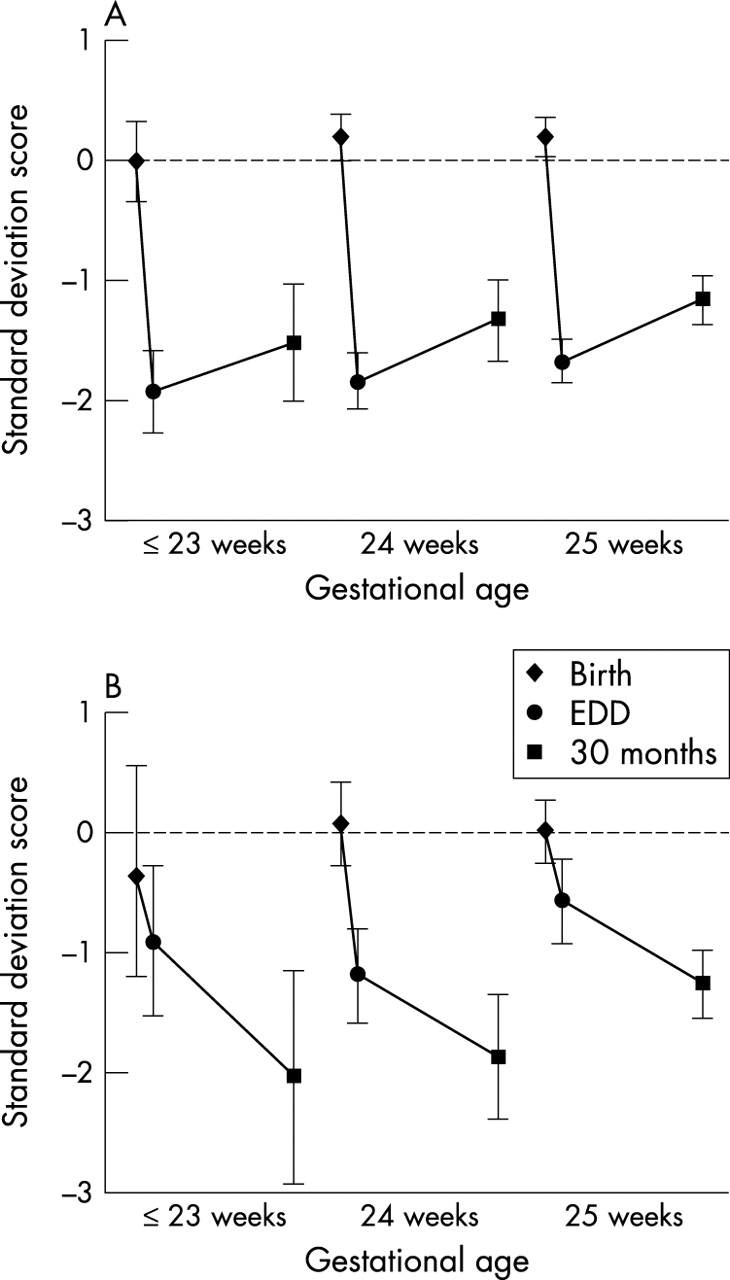
Figure 2 shows mean changes in SD scores over the study period for both weight (A) and head circumference (B), for children who had measures at each age. Relative to measurements on admission for neonatal intensive care, there had been an appreciable fall in weight and head circumference SD scores between birth and the EDD, irrespective of gestational age, with an overall mean difference in weight SD scores of −1.91 (95% CI −2.05 to −1.78; t = 27.46, p < 0.0001) and head circumference SD scores of −0.76 (95% CI −0.97 to −0.46; t = −5.83, p < 0.0001).

Mean (95% confidence interval) for weight (A; n = 233)) and head circumference (B; n = 145) standard deviation scores at birth, expected date of delivery (EDD), and 30 months of age corrected for prematurity for babies of ⩽ 23, 24, and 25 weeks gestational age. The data in (B) exclude those for infants with severe motor disability.
Weight SD scores show a small amount of catch up from EDD to 30 months of age corrected for prematurity (mean difference + 0.50; 95% CI 0.32 to 0.69; t = 5.34, p < 0.0001), although the children remained light for age at 30 months. In contrast, head growth velocity was less than expected between EDD and 30 months, the mean OFC SD score falling by −0.72 (95% CI −0.97 to −0.48; t = −5.83, p < 0.0001). These patterns of growth were similar for boys and girls.
Co-morbidity with poor growth at follow up
Feeding problems
The parents of 94 children (33% (95% CI 27.8 to 39.1)) reported continuing feeding difficulties at the time of assessment. For 81 children, the parents qualified this: 34 children were reported to have swallowing problems (12%), and 66 were reported to regularly refuse food (23%); 19 had both problems. One child was being fed through a nasogastric tube, and two children were fed by gastrostomy. Thirteen (5%) were receiving food/energy supplementation. No differences were noted in the incidence of feeding problems when analysed by gestational age, sex, or plurality. Children described by their parents to have a feeding problem had lower mean height, weight, BMI, head circumference, and MUAC SD scores at 30 months than the remainder of the population. Children reported by parents to have swallowing difficulties were lighter and had smaller head circumferences, and those reported to refuse food were likely to be shorter and lighter than the others (table 2).
Mean differences in standard deviation scores of growth parameters for age for children with feeding difficulties compared with those with no difficulties among children born at 25 weeks gestational age or less
Disability
The presence of severe motor disability compared with the rest of the population was associated with smaller head circumference for age at follow up (table 3). In those without concurrent severe motor disability, severe sensory/communications disability is not associated with poor head growth, whereas developmental disability has an intermediate marginally significant effect. Despite these associations, there was no linear correlation between head circumference and either of the BSID-II developmental index scores (correlation with psychomotor development index: r = 0.002, p = 0.98; correlation with mental development index: r = 0.1, p = 0.13).
Differences in mean (SD) head circumference standard deviation scores between children with and without disability born before 25 completed weeks gestational age
At 30 months, children with severe neuromotor disability were also significantly lighter and had lower BMI. These effects became smaller and lost significance after adjustment for feeding difficulties (for BMI), postmenstrual age at discharge (for weight), and last ultrasound scan (for height). Mean height and MUAC were not associated with neuromotor status.
Respiratory status
Children discharged home in oxygen had lower weight and head circumference at follow up than those discharged home in air (mean difference: weight, −0.34 (95% CI −0.67 to −0.01), p = 0.04; head circumference, −0.38 (95% CI −0.74 to −0.01), p = 0.04; in contrast with height (−0.25 (95% CI −0.55 to 0.05); p = 0.11), BMI (−0.21 (95% CI −0.57 to 0.15), p = 0.26), and MUAC (−0.01 (95% CI −0.24 to 0.22), p = 0.96)). No significant differences in growth at 30 months were found between those who were and were not oxygen dependent at 36 weeks postmenstrual age. However, the duration of supplemental oxygen after 36 weeks correlated inversely with height (r = −0.17, p = 0.03) and OFC (r = −0.18, p = 0.02), but not weight (r = −0.13, p = 0.07), BMI (r = 0.01, p = 0.93), or MUAC (r = 0.03, p = 0.65). Adjustment for the duration of use of postnatal steroids rendered none of these relations independently significant. Despite associations with early respiratory morbidity, there were no relations between growth measures and later respiratory problems assessed by the frequency of hospital admission or concurrent use of respiratory medications (table 4).
Mean (SD) standard deviation scores (SDS) for children of 25 weeks gestational age or less categorised by the number of hospital re-admissions and by the need for respiratory medication over the preceding 18 months at follow up at 30 months of age corrected for prematurity
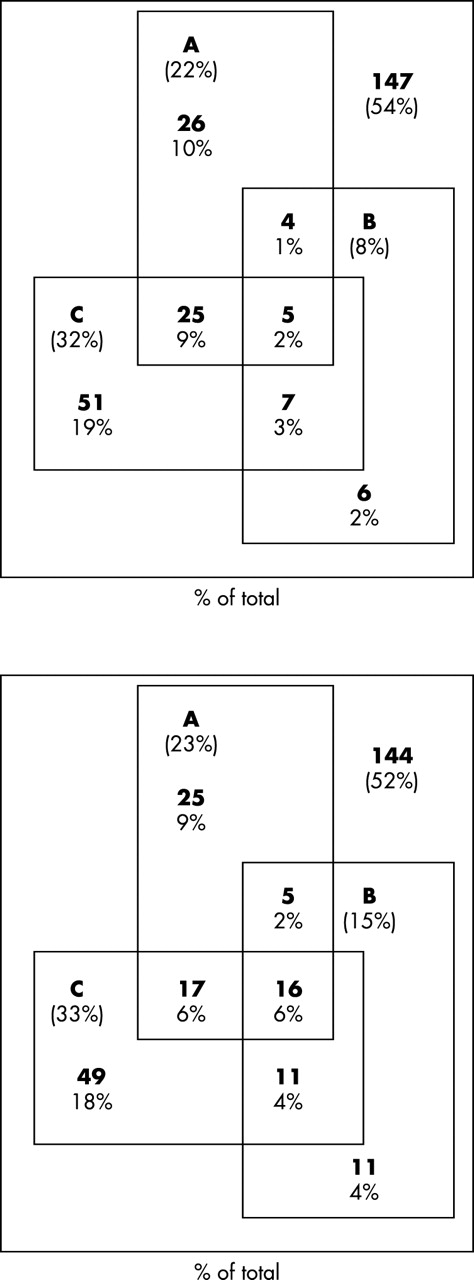
Figure 3 illustrates co-morbidity of feeding and growth problems with disability. Feeding difficulty was as likely to occur in the absence of other morbidity as in the presence of either weight/head circumference below −3 SD or severe neurodisability. The observation of lower growth attainment in children with feeding difficulties is thus only confounded by the presence of such problems in children with other disabilities in about half of the cases. The differences in weight, head circumference, and MUAC SD scores reported in table 3 tended to be greater in those reported to have swallowing difficulties than in those with reported food refusal.

Relation between severe disability, feeding problems, and poor growth in terms of weight (top; n = 271) and head circumference (bottom; n = 278) at 20 months of corrected age for children of 25 weeks of gestational age or less. A, severe neurodevelopmental disability; B, weight < −3 SD (top) or occipitofrontal head circumference < −3 SD (bottom); C, feeding difficulties.
Associations of basic and early clinical variables with poor growth at follow up
Univariate analysis was carried out to identify those pre-, peri-, and post-natal factors associated firstly with growth as continuous variables and secondly for those children with weight or head circumference < −3SD below the mean (8% and 16% children respectively). Perinatal factors were compared between those assessed at 30 months and the non-responders. Similar incidences of perinatal events were observed but there were more non-white children among the non-responders (16% v 6%). The variables entered and their univariate associations are shown in the appendix (www.archdischild.com/supplemental). Table 5 shows the results of multivariate analyses. The analyses are organised sequentially, considering those variables that are available to the clinical team at each successive time point, 30 month outcomes being entered in the last analysis. In several of the analyses, no new risk factors were added and, for the sake of clarity, these results are not included in the tables.
Results of multiple regressions arising sequentially using weight, head circumference, height, and body mass index standard deviation scores at 30 months of corrected postnatal age as dependent variables
In exploratory analyses the effects of several variables were dependent on others; the optimal variable is included in table 5. Multiple births and black ethnic group show some co-variance in relation to height measures independent of other ethnic groups. Similarly, except for BMI, any breast feeding after birth or the time to full enteral feeding and necrotising enterocolitis were related in that each showed an effect if the other was not included. As the effect of necrotising enterocolitis was strongest, despite involving only a small number of infants (n = 11), this is included in the tables. Of these 11, six had abdominal drains, six surgery, and one neither. However, breast milk is positively associated with weight at 30 months if cases of necrotising enterocolitis are excluded, and time to full enteral feeding is similarly related to height. Paradoxically, the children who had received short courses of postnatal steroids had larger heads at 30 months (although this was not significant), whereas long courses of postnatal steroids were significantly negatively associated with growth outcomes. Children with feeding problems at 30 months of corrected age had poorer growth in weight and head circumference, and, for the latter, this was independent of the association with neurological disability. Severity of early respiratory disease (as assessed by chest radiograph), the presence of necrotising enterocolitis, and cerebral ultrasound abnormality was each independently associated with poor growth in height, but only necrotising enterocolitis was associated with poor head growth.
DISCUSSION
For the parents of any child, poor somatic growth causes considerable anxiety. These data show that children who are born at 25 completed weeks of gestational age or less are at an increased risk of poor somatic growth and that co-morbidity, in terms of neurological and developmental difficulties, feeding problems, and, to a lesser extent, respiratory illness is associated with the poorest growth.
The EPICure study is a population based prospective study with a high rate of follow up. The data are presented according to gestational age therefore removing any confounding bias associated reporting outcome in terms of birth weight groupings,12 and data are expressed in standard deviation scores to remove any age related differences. In the initial data collection, weight, length, and OFC were requested at 4 weeks of postnatal age and at the EDD, but only weight and OFC at the EDD were reported with adequate frequency to be entered into the analysis. Although there is potential error in the measurements at 30 months from the use of multiple observers, we were careful to ensure that all paediatricians were trained together, used similar equipment in situations in which regularly calibrated height and weight measuring devices were not available, and used standard non-deformable measuring tapes. Any error associated with observer variation would tend to reduce the associations seen.
Growth parameters have been compared with the 1990 UK population standards, which should provide an accurate assessment of growth in childhood for this cohort, after correction for prematurity. These standards are based on relatively few data at these low gestations, hence we have also used our own population of admitted infants (n = 811) with validated gestational age13 to derive birthweight and birth head circumference SD scores. The growth curves to the EDD of the national data are derived from cross sectional birthweight data. Whether or not postnatal growth in preterm infants should be expected to follow these trajectories is unclear. What is undeniable is that we have shown profound growth failure in comparison with normal intrauterine growth during the third trimester of pregnancy. Furthermore, despite some evidence of catch up of weight, the values of growth for age at a corrected age of 30 months show consistently lower values than the UK population means: the children are generally shorter and lighter, with smaller head circumferences and lower BMI and MUAC values than term children. Of particular concern is the continued relative decline in head circumference from EDD to 30 months even in babies without developmental delay.
Data collected on feeding difficulties in these infants show that, in many cases, these problems coexist with abnormal growth patterns and with the presence of disability. The relation between these is unclear, however, as there are large numbers of children who have problems with one or two domains rather than all four (weight, head circumference, feeding, and disability). The presence of feeding difficulties was equally likely to occur if any of these other morbidities were present or not. Although the relation between reported feeding difficulty and subnormal growth could be confounded by the presence of disability, this was only a possibility in about half of the cases. The differences in SD scores for weight, head circumference, and MUAC that we have reported appeared to be worse in those with swallowing difficulties than in those who refused food. Although this may genuinely reflect the importance of the nature of the feeding problem, it also probably reflects the highly subjective nature of the reporting of such problems. This is likely to influence any conclusion that can be drawn from these data, and we would advise caution in the interpretation of information on feeding difficulties in the absence of a control group for comparison.
Population based growth data for preterm infants are available from a prospective national follow up study of 367 extremely low birthweight children born during 1990–1992 in Sweden (⩽ 1000 g and ⩾23 weeks gestation).21 At 36 months of age, an SD score of −2 or less was recorded for height, weight, and head circumference in 17%, 24%, and 10% respectively compared with 13%, 25%, and 38% in the EPICure cohort. We have thus identified similar distributions for height and weight but a considerable excess of small head circumferences. The growth of a further cohort of 58 children with birth weight < 1000 g (mean gestational age 27 weeks) born at one centre in Australia between 1988 and 1990 has been reported.4 At 2 years of corrected age, growth parameters were compared with those of full term children. An increased proportion of extremely low birthweight children had height and weight below the 3rd centile compared with controls (10% v 0% and 17% v 2% respectively) compared with 13% and 26% of the EPICure cohort. The third centile corresponds closely to −2 SD. The Australian study showed a difference in head circumference between extremely low birthweight and term children (5% v 0% < 3rd centile respectively), although this was not significant.
It is difficult to compare the results of the gestational age based EPICure cohort with these studies, as birthweight based cohorts will include more children who are small for gestational age and will have higher median gestational age. The growth outcomes for these more mature populations appear substantially less impaired for head circumference, while being quite similar for height and weight.
Developmental outcome has previously been shown to be related to poor head (and presumably poor brain) growth.22 Within the EPICure cohort, only when outcome was categorised by developmental scores for the whole population was there a clear association between head growth and development, but only for those with severely impaired developmental scores < 55. Despite the clear evidence of poor head growth, there was no linear relation with developmental quotient scores, as has been described by others.6,23 The larger heads of some disabled children in this study were not caused by hydrocephalus, and the removal of outliers did not change the relation. In addition, and perhaps surprisingly, other growth parameters were not associated with disability.
The overall rates of disability in both the Swedish and Australian cohorts were lower than those found in the EPICure children. It is likely that the early clinical course of the babies in our more immature cohort was more complicated, contributing to different associations between head growth and impairment.
In this study we have used multivariate analysis to examine the associations of early characteristics with growth at 30 months and examined the impact of other morbidity.
Results of the early analyses must be interpreted with some caution as the original EPICure database only collected detailed information over the first 24 hours after birth, and collection of potentially relevant data was limited thereafter. There was no systematic collection of information about episodes of infection, prolonged acidosis or hypoxia, or episodes of collapse requiring cardiopulmonary resuscitation, all being events that may well have a significant association with later morbidity.
Within the multivariate model, ethnicity and birth weight for gestational age were important determinants of weight, height, and head circumference. These are predictable from our understanding of growth in more mature infants.
Despite the small number of children who had suspected or confirmed necrotising enterocolitis, the growth failure in this group was severe and remained significant in all models, reflecting the long term nutritional consequences of this disease.
No other population based study has reported the association between chronic lung disease and growth in extremely preterm children. In cohorts of more mature preterm babies with lung disease, head growth has been reported to be poor into the second decade of life.9–11 We observed significant differences in weight and head circumference at 30 months between those children discharged with home oxygen therapy and those breathing air at discharge. The incidence of prolonged oxygen requirement in the EPICure population is very high. Breaking into the cycle of chronic lung disease and growth failure would seem to be an important challenge if we are to improve outcomes for these babies but is made more difficult by our lack of understanding of the reason for the growth failure. Increased energy expenditure has been shown in relation to early respiratory illness24 and also in established bronchopulmonary dysplasia when associated reduced energy intake and altered metabolic cost of growth suggesting differences in body composition have been noted.25 Although increased energy expenditure and impaired growth have been observed, there is evidence to suggest that impairment may still occur when energy intake is increased, and there are no data to suggest that it may be prevented by a planned increase in intake.26 We can only speculate as to whether the severity of the bronchopulmonary dysplasia is causally related to the associated morbidities and to the extent to which poor early nutrition and feeding problems continuing through infancy may contribute to continuing respiratory morbidity.
Examination of the effect of oxygen therapy in the multivariate model revealed significant effects for its duration in weeks, which disappeared when the effect of postnatal steroids was entered. In each model for height, weight, and head circumference, the detrimental effect of long courses of systemic steroids is evident. There is clear published evidence of the detrimental effects of postnatal steroid on linear growth.27 The effects of dexamethasone on insulin-like growth factor (IGF) I and IGF binding protein (IGFBP) 328,29 and direct effects on collagen turnover30 have both been implicated in the mechanism of this effect. Other studies have clearly shown that dexamethasone treatment is associated with a decrease in intestinal calcium absorption, an increase in urinary calcium loss, reduced vitamin D status, reduced bone density, increased urinary pyridinoline, and decreased plasma osteocalcin. These observations are consistent with an increase in osteoclast activity and a decrease in osteoblast activity.31 Details of the infants’ ventilatory requirements were not collected. However, steroids will have been given with the aim of accelerating extubation, and the children with the most severe lung disease are likely to have received the longest courses of steroids and the longest duration of ventilation. There is little doubt that postnatal steroids may have a significant impact on subsequent growth. The reduction of the frequency of use of postnatal steroid consequent on anxieties arising from its association with neurological impairments may help.27
There is evidence from randomised controlled studies in less preterm infants than these of developmental advantage for those fed with maternal breast milk and for those with better early growth. In this study, the ages at which parenteral and enteral nutrition were started and whether or not human breast milk was ever used were collected but did not show significant independent associations with the outcomes reported.
These data clearly show how common early growth failure may be, and how severe. A significant proportion of this extremely preterm cohort fails to thrive during infancy and early childhood, and significant failure to catch up by 30 months of corrected age is a particular feature of this group. Growth through to the teenage years is impaired in cohorts of children with birth weight < 1500 g without disability, with predicted adult height being reduced on average by 4.1 cm (95% CI 2.5 to 6.0).32 Within the EPICure cohort, there are associated high rates of severe disabilities, feeding problems, and intercurrent respiratory illness. The long term growth potential and the significance of their growth failure for the children themselves remain to be elucidated, and a further follow up period is necessary to determine the degree of catch up that does or does not occur. In order to advance, we need a more complete understanding of the control of growth and of how it is disturbed in this population. Early growth of the infant born prematurely is the result of a complex interplay of nutritional and endocrine factors that is incompletely understood. Differences in circulating levels of a number of hormones (IGFI, IGFBP3, and growth hormone33,34, cortisol, and thyroid hormones35) between the preterm and term newborn have been reported and have been linked to early growth failure in the preterm baby.36 The situation is further complicated by superimposed effects of illness and therapeutic interventions such as mechanical ventilation and the use of postnatal steroids. It is possible in the modern nursery to both weigh and measure babies receiving intensive care. Optimising both enteral and parenteral nutrition and better attention to the monitoring of early growth may improve some neurocognitive and health outcomes; studies designed specifically to address these issues are needed.
Acknowledgments
Steering group: P J Steer (Chair; London), K Costeloe (London), A T Gibson (Sheffield), I A Laing (Edinburgh), M J Lewins (Lincoln), N Marlow (Nottingham), P O D Pharoah (Liverpool), A R Wilkinson (Oxford).
Statistician: E M Hennessy.
Developmental panel: A J Bennett, R H MacGregor, M J Cruwys, B Mallya, M C Dick, M X Poblete, S Egan, J F Schulte, A F Livingstone, N Wood, L J Logie, C Lawson (psychologist), H Palmer (administrator).
REFERENCES
Supplementary materials
Web-only Appendix
The appendix is available as downloadable PDFs (printer friendly files).
If you do not have Adobe Reader installed on your computer,
you can download this free-of-charge, please Click hereFiles in this Data Supplement:
- [View PDF] - Appendix 1a Effects of factors on weight, head circumference, height, body mass index and mid upper arm circumference standard deviation scores at 30 months corrected postnatal age.a,, using univariate regression.
- [View PDF] - Appendix 1b Effect of factors on being of very low weight and and very small head circumference (SD score <_-3 at="at" _30="_30" months="months" postnatal="postnatal" corrected="corrected" age.="age." odds="odds" ratios="ratios" calculated="calculated" from="from" univariate="univariate" logistic="logistic" regression.--="regression.--" end="end" desc="desc" dc1="dc1" _2="_2" _--="_--">
Footnotes
-
↵* The EPICure Study Group comprises the paediatricians in 276 maternity units across the United Kingdom and Ireland who contributed data to the study, whose invaluable help we acknowledge. The steering group was responsible for overseeing the management of the study and the developmental panel performed the data collection and validation.
-
Funding: Serono Laboratories UK Ltd and BLISS.