Article Text

Abstract
AIMS To make non-invasive measurements of right to left (R-L) shunt and reduced ventilation/perfusion ratio (VA/Q) in neonates with pulmonary failure and to examine sequential changes in these variables after treatment.
METHODS Twelve neonates with pulmonary failure were studied. They ranged in gestational age from 24 to 37 (median 27) weeks and were 1–39 (median 4) days old. Shunt and reduced VA/Q were derived from their effects on the relation between inspired oxygen pressure (Pio2 ) and arterial oxygen saturation measured with a pulse oximeter (Spo 2). Pairs of Pio2 vSpo 2 data points were obtained by varying Pio2 in a stepwise fashion. A computer algorithm based on a model of pulmonary gas exchange fitted a curve to these data. With Pio2 on the abscissa, an increase in shunt produced a downward movement of the curve, whereas reducing VA/Q to < 0.8 shifted the curve to the right. The right shift gives a variable that is inversely related to VA/Q, the Pio2 − Pc̄ o 2difference, where Pc̄ o 2 is mixed capillary oxygen pressure.
RESULTS Ten of the 12 infants on the first study day had large shunts (range 5.9–31.0%, median 19.9%, normal < 8%) and large Pio2 − Pc̄ o 2differences (range 9.7–64.4 kPa, median 19.8 kPa, normal < 7 kPa) equivalent to a median VA/Q of 0.2 (normal median VA/Q = 0.8). Sequential improvement in shunt and VA/Q were shown in most infants after treatment. Sudden large changes in these variables were shown in two infants.
CONCLUSION This simple non-invasive method distinguishes between shunt and reduced VA/Q in neonates with pulmonary failure.
- shunt
- VA/Q
- non-invasive
- oxygen saturation
Statistics from Altmetric.com
A reduced ventilation/perfusion ratio (VA/Q) and an increased shunt cause quite different, but characteristic, effects on the relation between inspired oxygen pressure (Pio2 ) and arterial oxygen saturation (Sao2 ).1 ,2 A reduced VA/Q in the absence of shunt reduces both alveolar oxygen (Pao2 ) and oxygen saturation but increasing the Pio2 washes out alveolar nitrogen, restores Pao2 , and corrects desaturation. In contrast, an isolated shunt reduces oxygen saturation, but increasing Pio2 does not correct this because the shunted blood is never exposed to the increased Pio2 . The non-shunted blood is almost fully saturated, and even administering 100% oxygen adds only a small amount of dissolved oxygen, which cannot compensate for the effect of the shunt.
It may be important in neonates to differentiate between a reduced VA/Q and a shunt. For example, in an animal model of surfactant deficiency when surfactant was administered into the airways either as a bolus or as an aerosol, VA/Q worsened with the former but improved with the latter.3There may also be a prognostic significance of different degrees of VA/Q and shunt. However, existing methods of quantifying the relative contributions to oxygen desaturation of VA/Q and shunt are not suitable for routine clinical application in neonates.4-8
We have described1 ,2 ,9 a simple non-invasive method for the calculation of shunt and reduced VA/Q in adults which entails the simultaneous measurement of two variables, the inspired oxygen partial pressure (Pio2 ) and oxyhaemoglobin saturation using pulse oximetry (Spo 2). By changing the inspired oxygen partial pressure, pairs of Pio2 and Spo 2 values are obtained. The curve relating Pio2 to Spo 2 reflects the shape of the dissociation curve but always lies to the right, and its shape and position vary considerably when gas exchange is impaired.1 ,2 ,9-11 Thus, with Pio2 on the abscissa:
Increasing the shunt from 0 to 40% displaces the Pio2 v Spo 2 curve downwards (fig 1A). This reflects the inability of an increase in Pio2 to compensate for an increase in shunt.
Reducing VA/Q from 0.8 to 0.1 shifts the curve to the right (fig 1B) because the oxygen gradient increases between Pio2 and Pao 2 (or Pc̄ o 2, the mixed capillary oxygen). Increasing alveolar CO2 also shifts the curve to the right by Pco 2/R, where R is the gas exchange ratio. The right shift due to Pco 2/R is small, typically 6 kPa, compared with the effect of reducing VA/Q from 0.8 to 0.1, which causes a shift of 28 kPa.
Note that, in fig 1B, the Pio2 v Spo 2 curve representing a VA/Q of 0.8 corresponds to the curve in normal subjects and gives an Spo 2 of 97% breathing air.

(A) Increasing shunt (from 0 to 40%) lowers the curve. (B) Reducing VA/Q from 0.8 to 0.1 shifts the curve to the right. The right shift of each Pio 2 v Spo curve from the position of the dissociation curve (dashed line) is the PIO2 − Pc̄ o 2difference in kPa which includes Paco 2/R. The 0.8 curve represents the normal lung which intercepts a Pio 2 of 21kPa (vertical line) at 97% Spo 2.
We studied a group of neonates with pulmonary failure to see if we could derive shunt and VA/Q from the Pio2 vSpo 2 data pairs despite the expected circulatory and ventilatory instabilities in such infants. We then examined the day to day changes to see if we could show sequential improvements in shunt and VA/Q with continuing treatment.
Methods
PATIENTS
Twelve neonates, each with pulmonary failure requiring mechanical ventilation, were studied after local ethics committee approval had been obtained and informed consent obtained from the parents. In seven of these babies, up to four repeat studies were performed at intervals of up to 23 days.
The babies were being treated in the Neonatal Intensive Care Unit, Rosie Maternity Hospital, Addenbrooke's Hospital, Cambridge. All but one of the infants were preterm with intrauterine growth retardation and were admitted for ventilation for respiratory distress syndrome (table 1). All infants were being ventilated through a tracheal tube. A consultant neonatologist not involved in this study managed ventilatory support. One infant, delivered at 37 weeks gestation (infant A), had developed hydrops foetalis after parvovirus infection in utero. In most infants, surfactant had been administered when appropriate through a tracheal tube. Arterial blood gas and haemoglobin values were recorded independently as part of routine clinical management. Monitoring included measurement of inspired oxygen concentration and arterial saturation using the integral gas analyser in the Draeger Babylog 8000 ventilator (to give Fio2 or Pio2 ) and an Ohmeda Biox 3700e pulse oximeter (to give Spo 2). The Draeger automatically calibrates itself every 24 hours—for example, at 1100, using piped air and 100% oxygen. Each calibration takes 90 seconds and the instrument is accurate to 5% full scale deflection—that is, 21(1)kPa. The instrument sounds an alarm if the calibration exceeds this range. The routine arterial blood gas results were used periodically to check the pulse oximeter reading. Pulse oximeters are accurate to ±1% in the normal range but much less at low Spo 2 (see Discussion).
Summary of the clinical information on the first day of the study
PROCEDURE
Pio2 was varied in steps to cause the Spo 2 to vary between 85% and 96%. This level of oxygen has been used in previous research in the measurement of cerebral blood flow using near infrared spectroscopy.12The Pio2 was never reduced below 21 kPa.
DATA ANALYSIS AND INTERPRETATION
The pairs of Pio2 and Spo 2 data points for each study were recorded and analysed using a computer algorithm which gave a curve representing a single solution for each subject's data set.9 This curve is not a statistical line of best fit but is based on a model of gas exchange used by the computer algorithm to describe the Pio2 vSpo 2 data points by two variables of gas exchange:
virtual shunt using the shunt equation;
the difference between inspired oxygen and mixed pulmonary capillary oxygen pressures (Pio2 − Pc̄ o 2), a function of reduced VA/Q and Pco 2/R.
Figure 2 gives the inverse relation between right shift—that is, Pio2 − Pc̄ o 2—and VA/Q.

Inverse relation between VA/Q and the right shift of the Pio2 v Spo 2 curve.
The term “virtual” is used if shunt and VA/Q are calculated with assumed values of haemoglobin, carbon dioxide (Pco 2), respiratory quotient (R), and arteriovenous oxygen difference when the actual values are not available. In this study, R and arteriovenous oxygen difference were assumed.
Results
Table 1 shows the admission diagnosis, gestational age, days after delivery, and weight of the 12 infants.
Figure 3 shows a Pio2 v Spo 2 data set from infant I on the first study day (closed circles). A model curve (Mod) was fitted to these data by the computer algorithm which calculated a shunt value of 21.6%. A 21.6% shunt is shown by curve SH which, in the absence of VA/Q abnormality, asymptotes the dissociation curve D as shown in fig 3. The algorithm fits the SH curve to the data points by displacing it to the right of D by 26.6 kPa. This displacement is the Pio2 − Pc̄ o 2difference, which represents the combined effects of a reduced VA/Q plus Pco 2/R.

Example of data analysis from infant I. Curve D, the dissociation curve, corresponds to a 0% shunt (see fig 1A) and curve SH to a 21.6% shunt. When curve SH is moved to the right by a Pio2 − Pc̄ o 2difference of 26.6 kPa (dashed arrow), it superimposes the data points (closed circles) to give curve Mod.
Table 2 gives the calculated values of shunt and right shift (Pio2 − Pc̄ o 2) for all these infants on the first study day. This also shows the VA/Q derived from Pio2 − Pc̄ o 2and the r 2 value, which is the goodness of fit of the model to the data points.9
Details of shunt and right shift of the Pio 2 v Spo 2curve
The values for shunt and right shift—that is, Pio2 − Pc̄ o 2difference and thus VA/Q—for each baby shown in table 2all showed a good fit to the Pio2 v Spo 2 data points indicated by the r 2value.9 Figure 4 shows these data points and the computed curves for all 12 infants on the first study day. All these data are plotted on a grid where vertical and horizontal lines mark a Pio 2 of 21 kPa (air at sea level) and an Spo 2 of 90% respectively. Note that the normal curve, with a median VA/Q of 0.8, intersects the 21 kPa line at about 97% Spo 2, and this is equivalent to moving the dissociation curve (D in fig 3) to the right by about 6–7 kPa—for example, a normal Pco 2/R. The 95% confidence intervals of the fit of the curve are shown for shunt (upper part of the curve) and right lateral shift (lower part of the curve).

The Pio2 v Spo 2 curves from all 12 infants on the first day that they were studied. In every case the curve is shifted to the right of the line marking a Pio2 of 21 kPa, indicating a large reduction in VA/Q ratio. In infant L, there are two data sets, before (closed circles) and after tracheal aspiration (open circles).
Note that in every case the curve was shifted to the right of the vertical line marking a Pio 2 of 21 kPa (air at sea level). There was a good fit of the curve to the data points despite the considerable shunt and right shift, the most severe examples of which were in infants A, E, F, and H. Two curves are shown for infant L. The one on the right was recorded first and that on the left 20 minutes after tracheal suction (see discussion).
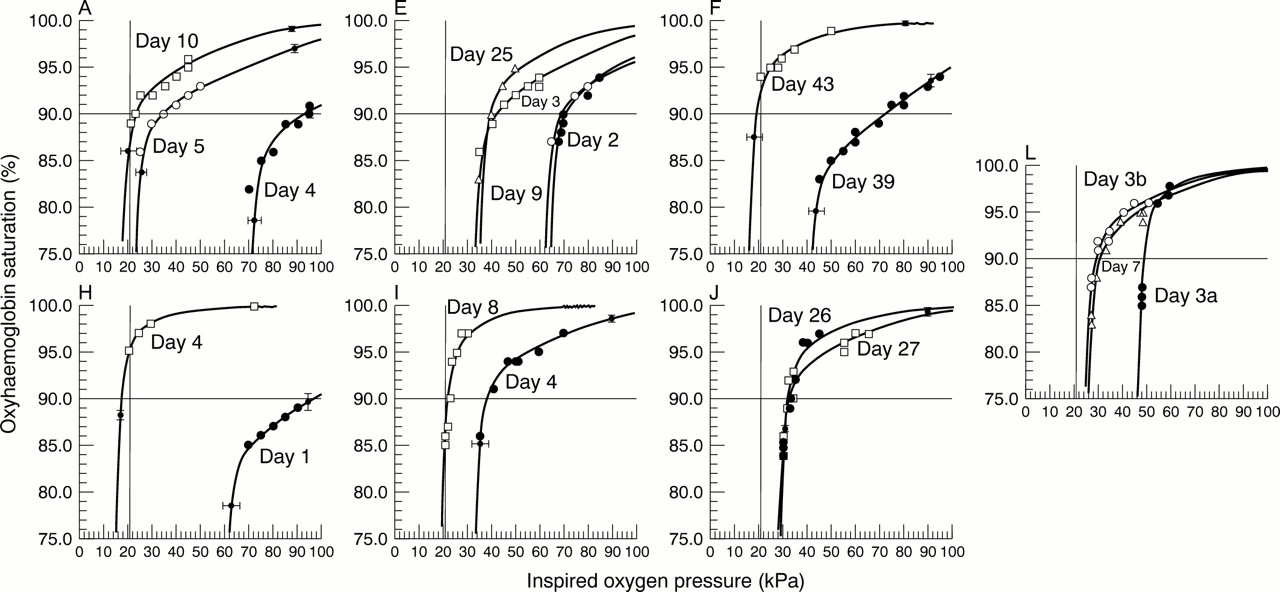
Seven babies were studied on more than one occasion (fig 5). Infant A, a neonate with hydrops foetalis secondary to anaemia following an intrauterine parvovirus infection, showed a considerable improvement from day 4 to day 5, and this improvement continued to day 10. The overall reduction in shunt was from 30.7% to 20.1%. More dramatically there was a decrease in Pio2 − Pc̄ o 2from 64.4 kPa to 11.4 kPa, equivalent to an improvement in VA/Q from less than 0.05 to 0.49.

Sequence of changes in Pio2 v Spo 2 data points and model fit in seven infants who were studied sequentially.
Infant E showed a very unstable clinical pattern with improvement (day 2 to day 3) followed by deterioration (day 3 to day 9). Eventually (day 25) there was the lowest value of shunt, 16.1%, but there was still a very large right shift—that is, a large Pio2 − Pc̄ o 2difference—which our gas exchange model equated to the perfused alveoli having a VA/Q of 0.13.
Infants F and H showed a considerable improvement over the days they were studied, with a reduction in both the shunt and right shift to near normal values.
Infant I, a 26 week old neonate with infant respiratory distress syndrome, was the only baby studied while dependent on a high frequency oscillator. From day 4 to day 8 there was an improvement in both shunt and right shift (figs 4 and 5 and table 2). The shunt decreased from 21.6% to 7.3% (normal), with the right shift being reduced from 26.6 kPa to 13.7 kPa—that is, a VA/Q of 0.14 improving to 0.4.
Infant J showed deterioration in shunt from day 26 to 27. A normal echo ruled out a patent ductus arteriosus. However, this baby was hypotensive and had suspected necrotising enterocolitis. Infant L showed a more stable picture, with little change between days 3 and 7.
Discussion
Our gas exchange model derives two variables of impaired gas exchange: shunt and the Pio2 − Pc̄ o 2difference representing the effect of a reduced VA/Q (0.05 < VA/Q < 1). In all 12 infants, we found a good fit of the model to the Pio2 v Spo 2 data points. With a few exceptions the curves were stable—that is, a single shunt equation fitted all the Pio2 v Spo 2 data points obtained from one subject during one data collection period. The results were similar to those seen in a variety of adult patients with pulmonary failure during anaesthesia,9thoracotomy,10 and after fat embolism.11
Reducing median VA/Q below unity causes a considerable increase in oxygen gradient.1 However, some workers, as recently as 1995, have assumed that the entire oxygen gradient is explained only by a shunt.13 ,14 This simplistic approach ignores the effect of an altered VA/Q distribution on the oxygen gradient and lumps together the effects of a reduced VA/Q with those of a shunt. In infants with respiratory distress syndrome,4 ,5 the nitrogen gradient method shows a considerable reduction in VA/Q, which explains about 30% of the oxygen gradient.5 Not only were VA/Q ratios as low as 0.05, but also, in one case, this accounted for almost the whole of an oxygen gradient of 65 kPa.5 This large gradient is similar in magnitude to the Pio2 − Pc̄ o 2difference seen in our infant A (table 2), which gave a VA/Q of 0.05.
In some of our infants, the increase in shunt (> 30%) and reduction in VA/Q (< 0.05) were considerable, the gas exchange abnormalities being as great as those previously seen during thoracic anaesthesia in adults in whom a considerable part of the lung was collapsed.10
Some infants showed considerable variability in the Pio2 vSpo 2 data. Three examples are as follows. (a) Infant L at the start of the data collection period showed a very large reduction in VA/Q causing a right shift of 40 kPa but with a very small shunt (fig 4). After tracheal aspiration, there was an improvement in VA/Q but with an increase in shunt from 6.6 to 17% (open circles fig 4). (b) In infant J, there were two episodes of sudden hypoxaemia when the Spo 2 fell precipitously necessitating the inspired oxygen concentration to be increased to 60%. These episodes may have been caused either by a transient opening of an R-L shunt or, more likely, a fall in cardiac output causing an increased shunt effect.9(c) At times, in an otherwise stable data set, there was more than 6% variability in Spo 2. This was particularly so when we were measuring Spo 2 on the steep part of the Pio2 vSpo 2 curve. This was consistent with our previous observations in postoperative adult patients15, for whom we reported a very unstable pattern of Spo 2 when the Pio2 lay on the steep part of the Pio2 v Spo 2 curve.
Severinghaus and Naifeh16 examined the accuracy of pulse oximeters. They found that the probe is accurate to ±1% in the normal range, but, with a sudden hypoxic episode, an Spo 2 reading of 55% may be 7% lower than the actual Sao 2 value. Because such inaccuracy occurs only on the very steep part of the oxyhaemoglobin dissociation curve, this has little effect on the derivation of the Pio 2 v curve in our studies. The derived Pio 2 v Spo 2 curve based on our model of gas exchange obviously does not fit every data point, and the r 2 value and the 95% confidence interval of shunt and right shift of the curve describe this variability (table 2).
The fetal dissociation curve is shifted to the left of the adult curve with a P50 of 2.7 kPa compared with the adult value of 3.6 kPa. This difference is reduced after birth and after blood transfusion. This means that the median value of the variable Pio2 − PÇ o 2, which for the whole study was 19.8 kPa, would have been underestimated by less than 1 kPa.
The model is sensitive to a reduced haemoglobin concentration and low cardiac output.9 The haemoglobin value for each infant was recorded from routine samples taken on the day of the study, and these values were used in the calculation of shunt and VA/Q. A cardiac output equivalent to an arteriovenous oxygen difference of 5 ml/dl was assumed.
We conclude that the method shows that the gas exchange model based on the oxyhaemoglobin dissociation curve provides a good fit to the Pio2 vSpo 2 data in the circumstances of our study. The model gave a non-invasive measurement of shunt and reduced VA/Q in neonates during mechanical ventilation and allowed the prediction of the effect on Spo 2 of changing Pio2 .
Acknowledgments
We thank Drs James Powell and Jackie Gedney for their assistance with this study. Dr Wilf Kelsall was consultant neonatologist at Addenbrooke's hospital in whose care were the infants described in this paper.