Article Text

Abstract
BACKGROUND Ventricular outputs cannot be used to assess systemic blood flow in preterm infants because they are confounded by shunts through the ductus arteriosus and atrial septum. However, flow measurements in the superior vena cava (SVC) can assess blood returning from the upper body and brain.
OBJECTIVES To describe a Doppler echocardiographic technique that measures blood flow in the SVC, to test its reproducibility, and to establish normal ranges.
DESIGN SVC flow was assessed together with right ventricular output and atrial or ductal shunting. Normal range was established in 14 infants born after 36 weeks' gestation (2 measurements taken in the first 48 hours) and 25 uncomplicated infants born before 30 weeks (4 measurements taken in the first 48 hours). Intra-observer and interobserver variability were tested in 20 preterm infants.
RESULTS In 14 infants born after 36 weeks, median SVC flow rose from 76 ml/kg/min on day 1 to 93 ml/kg/min on day 2; in 25 uncomplicated very preterm infants, it rose from 62 ml/kg/min at 5 hours to 86 ml/kg/min at 48 hours. The lowest SVC flow for the preterm babies rose from 30 ml/kg/min at 5 hours to 46 ml/kg/min by 48 hours. Median intra-observer and interobserver variability were 8.1% and 14%, respectively. In preterm babies with a closed duct, SVC flow was a mean of 37% of left ventricular output and the two measures correlated significantly.
CONCLUSIONS This technique can assess blood flow from the upper body, including the brain, in the crucial early postnatal period, and might allow more accurate assessment of the status of systemic blood flow and response to treatment.
Key messages
Key messages
Superior vena cava flow offers a non-invasive means to assess systemic blood flow in newborn infants
Superior vena cava flow increases over the first 48 hours in well term and preterm infants
- preterm infants
- superior vena cava
- systemic blood flow
- reproducibility
Statistics from Altmetric.com
A major problem in exploring the relation between early changes in the systemic blood flow and end organ injury, particularly to the brain in preterm newborn infants, is how to measure systemic blood flow. Blood pressure gives only a loose indication of systemic blood flow,1 and the effect of ductal shunts on left ventricular output and of atrial shunts on right ventricular output can cause either of these measures to overestimate the real systemic blood flow by up to 100%.2 ,3
The flow returning to the heart via the superior vena cava (SVC) offers a solution to this problem in that it represents flow to the upper body, approximately 80% of which goes to the brain.4 In addition, it is unaffected by the shunting that occurs at both ductal and atrial level in preterm infants in the 1st days of life. The SVC flow fulfils the requirements for Doppler volumetric measurement, with good windows for both flow velocity and vessel diameter measurements. Here, we describe a technique developed to measure SVC flow in newborn infants, assess its accuracy and reliability, and document the normal range of early postnatal SVC flow in both term and uncomplicated preterm infants. A subsequent paper describes the association between changes in postnatal SVC flow and intraventricular haemorrhage in a large cohort of very preterm infants.4A
Methods
NORMAL SVC FLOW
Normal SVC flow was studied in two groups of infants: the first group consisted of 14 infants born after 36 weeks' gestation who were well. They had a median gestational age of 40 weeks (range, 36–41) and median birth weight of 3418 g (range, 2050–3284). The second group consisted of 25 babies born before 30 weeks' gestation with a median gestational age of 29 weeks (range, 26–29) and median birthweight of 1250 g (range, 850–1600 g), all of whom had radiologically normal lungs and minimal or short term (less than 48 hours) requirements for oxygen or ventilatory support. These infants were part of a larger cohort of 126 infants born before 30 weeks studied to explore the relation between the changes in SVC flow and intraventricular haemorrhage.
ECHOCARDIOGRAPHIC DATA COLLECTION
The infants born after 36 weeks had two echocardiograms on days 1 and 2 of life. Echocardiography was performed on infants born before 30 weeks' gestation as close as possible to 5 hours, 12 hours, 24 hours, and 48 hours after birth, with the first ultrasound performed after medical stabilisation was complete.
An Acuson 128/XP10 ultrasound scanner was used with a 7 MHz vector array transducer incorporating colour flow and pulsed wave Doppler. The scan was recorded on to VHS videotape and the measurements then taken from the videotape. Structural normality of the heart was established on the initial scan.
SVC FLOW MEASUREMENT
The infants were placed in a supine position on a flat surface and were studied when resting quietly or asleep. The heart was imaged from a low subcostal view. The SVC flow was identified by angling the beam anteriorly until the flow into the right atrium from the SVC was seen using colour Doppler. This is close to, but usually just posterior to, the subcostal aortic view (fig 1). The angle of insonation was minimised by manoeuvring the transducer inferiorly to allow visualisation of the maximal amount of flow within the SVC before entry into the right atrium. It is important to place the transducer head as close as possible to the umbilicus. The pulsed Doppler recording was made at the junction of the SVC and the right atrium (fig 2). The Doppler range gate was manipulated in the SVC until the clearest ultrasound velocity spectral displays were obtained and a representative sample of 20–30 cardiac cycles was recorded on to videotape.
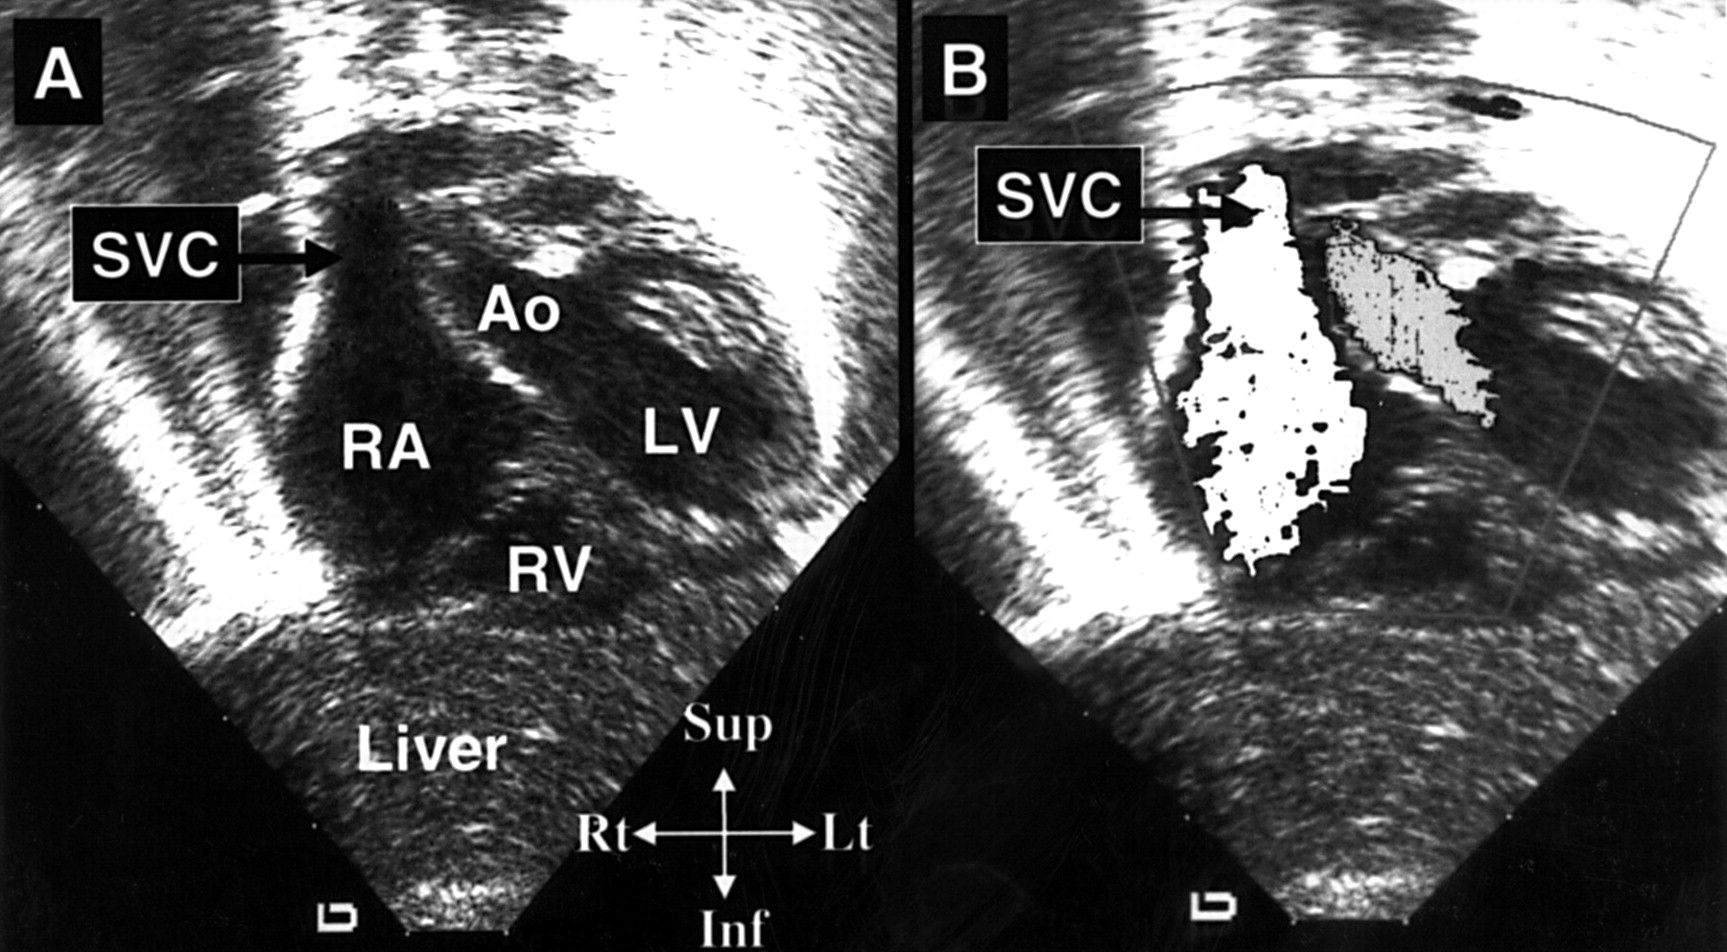
(A) The superior vena cava (SVC) entering the right atrium (RA) as seen from the subcostal view. (B) Colour Doppler mapping (grey area) highlighting the flow down the SVC and into the right atrium. Ao, aorta; LV, left ventricle; RV, right ventricle.

The Doppler range gate positioned at the junction of the superior vena cava (SVC) and right atrium. An example of the spectral display obtained is shown, with the S, D, and A waves (see text).
The SVC flow pattern was pulsatile with two peaks as described previously by Froysaker,5 the first associated with ventricular systole (the S wave) and the other with early ventricular diastole (the D wave). In addition, frequently there were short periods of reverse flow (the A wave), associated with atrial systole (fig 2). The mean velocity of blood flow was calculated from the integral of the Doppler velocity tracings and was averaged from 10 consecutive cardiac cycles to allow for variation in flow caused by respiration, and also for any variation within the cardiac cycle. Forward flow was positively integrated and any retrograde flow was negatively integrated6 using the incorporated Acuson software (fig2). The heart rate was derived from the intervals between cardiac cycles.
The SVC was then imaged entering the right atrium from the parasternal long axis view with the beam in a true sagittal plane and angled to the right of the ascending aorta (fig 3). The transducer sometimes needs to be moved towards the left and to be angled back to the right to avoid shadowing by the overlying right lung. In some infants, this view is progressively harder to obtain after the first 2 days of life because of interference by the overlying lung. The vessel was often identified by the presence of intraluminal echodensities moving towards the heart, which have been described previously, and have been postulated to represent red blood cell aggregates in slower flowing vessels.7 The SVC image was recorded on to videotape. The maximum and minimum internal diameters were measured from a frozen image showing the vessel walls clearly at the point that the SVC starts to open up into the right atrium, obtained from a frame by frame videotape analysis (fig 3). Because of the variation in vessel diameter through the cardiac cycle, as shown in fig 4, a mean of the maximum and minimum diameter within the cardiac cycle was used for calculation of flow. Most of the change in diameter occurred because of movement of the anterior wall of the SVC, and there was no evidence of complete collapse of the vessel between cardiac cycles (fig 4). Diameter measurements were averaged from three to five cardiac cycles. The diameter of the SVC varied by a mean of 22% (SD, 8%) throughout the cardiac cycle.
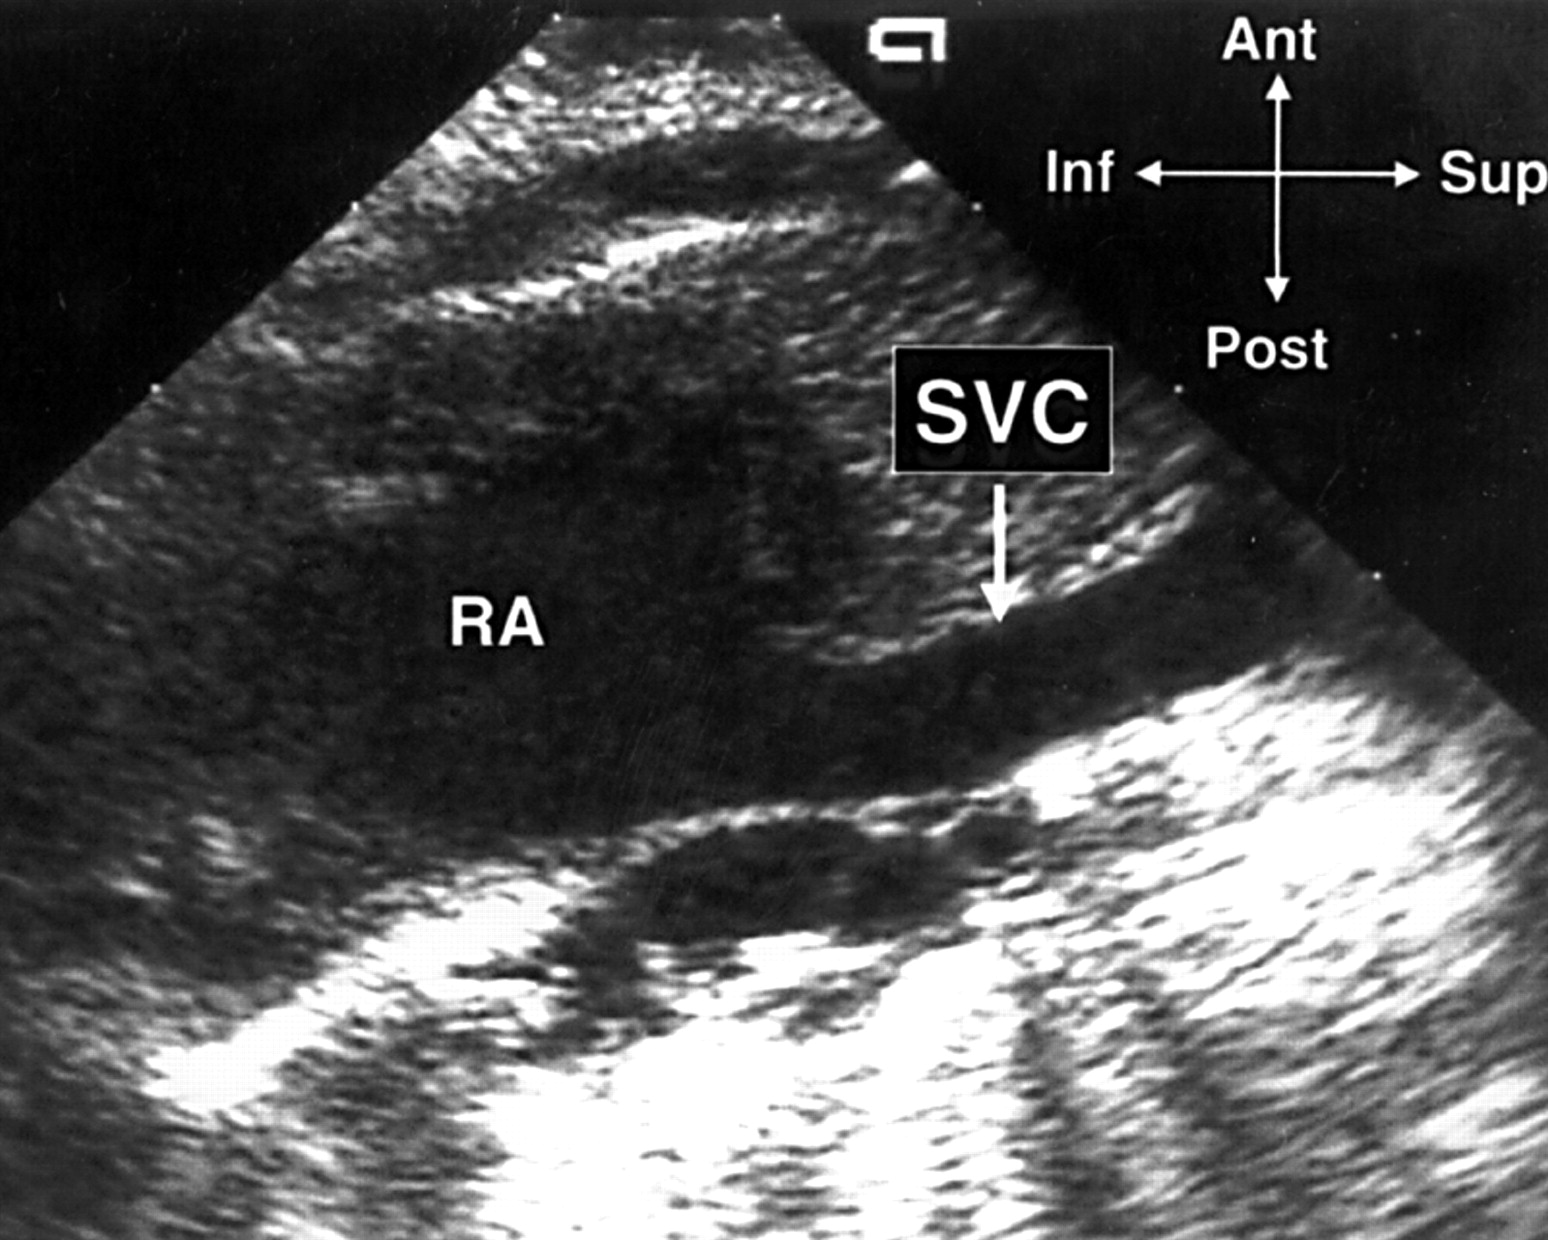
The superior vena cava (SVC) imaged from the parasternal long axis view as it enters the right atrium. RA, right atrium.

An M mode tracing through the superior vena cava (SVC) at the level where diameter measurements are taken. The movement of both anterior and posterior walls can be seen through the cardiac cycle, with the anterior wall being most mobile.
The SVC flow was calculated using the following formula: SVC flow = (velocity time integral × (π × (mean SVC diameter2/4) × heart rate)/body weight. The resulting figure was expressed as ml/kg/min, with accuracy to the nearest ml. Right and left ventricular output, ductal shunting, and atrial shunting were measured using techniques described elsewhere in the literature.8
REPRODUCIBILITY
Intra-observer variability
Twenty ventilated very preterm babies were studied on 35 occasions during the first 24 hours after birth. Their median gestation was 26.5 weeks (range, 24–29) and their median birthweight was 1021 g (640–1650). All were clinically stable at the time of our study. Two measurements of SVC flow were performed 10 minutes apart by the same observer (NE).
Interobserver variability
Twenty ventilated preterm babies were studied during the first 48 hours after birth. Their median gestation was 27 weeks (range, 24–36) and their median birthweight was 1031 g (560–2880). All were clinically stable at the time of our study. Two observers (NE, MK) performed separate measurements of SVC flow, one immediately after the other, alternating which observer studied the baby first. The studies were recorded on to separate videotapes and measurements were made independently.
SVC flow compared with left ventricular output
As a means of indirect validation, SVC flow measurement was compared with left ventricular output, a measure that has been validated directly.9 This was analysed in babies in whom the ductus was closed so that left ventricular output should represent systemic blood flow. Because of limited numbers of studies with a completely closed duct in the uncomplicated preterm babies, this analysis included all eligible studies from the whole cohort of 126 preterm babies.
STATISTICS
Data were analysed with a PC based statistics package (SPSS for Windows). Paired measurements were compared for bias using the Wilcoxon matched pairs signed rank test. Variability between the measures was the difference between the two measures expressed as a percentage of the mean of the two measures. Correlation was assessed using the Spearman correlation coefficient.
CONSENT
Our study was approved by the institutional ethics committees of both hospitals, and babies were studied with informed written consent of their parents.
Results
SVC FLOW IN INFANTS BORN AFTER 36 WEEKS' GESTATION
The median SVC flow rose from 76 ml/kg/min at 17 hours to 93 ml/kg/min at 42 hours of life (fig 5). The corresponding right ventricular output measures were 147 ml/kg/min (range, 102–258) and 160 ml/kg/min (range, 97–253). Table 1 shows summary data for SVC velocity time integral, minimum and maximum SVC diameter, and SVC flows.

A box and whisker plot of superior vena cava (SVC) flow on days 1 and 2 of life in the term babies. The box represents the interquartile range, the line in the box is the median, and the bars are the range. Outliers are shown as individual points.
Values for superior vena cava studies on 14 well term infants
SVC FLOW IN UNCOMPLICATED PRETERM INFANTS
The SVC flow also increased over the first 48 hours in the 25 uncomplicated preterm babies. Median SVC flow rose from 62 ml/kg/min at 5 hours to 86 ml/kg/min at 48 hours (fig 6). The lowest recorded SVC flow at each of these times was 30, 34, 42 and 46 ml/kg/min, respectively, at 5, 12, 24, and 48 hours of age. Table 2 shows summary data for SVC velocity time integral, minimum and maximum SVC diameter, and SVC flows.

A box and whisker plot of superior vena cava (SVC) flow at 5, 12, 24, and 48 hours in uncomplicated preterm babies. The box represents the interquartile range, the line in the box is the median, and the bars are the range. Outliers are shown as individual points.
Values for superior vena cava studies on 25 uncomplicated very preterm infants
INTRA-OBSERVER VARIABILITY
There was no significant difference between the two measurements (median SVC flow, 58 v 57.9 ml/min; p = 0.12). Median variability between the measurements was 8.1% (range, 1.3–32.8%). Ninety per cent of the measures were within 18% of each other.
INTEROBSERVER VARIABILITY
There was no significant difference between the two measurements (66 v 81 ml/min; p = 0.16). Median variability between the measurements was 14% (range, 2–57%). Ninety per cent of the measures were within 34% of each other. Measurement of velocity time integral (median variability, 7.4%) and diameter (median variability, 8.7%) contributed more to the variability than the heart rate (median variability, 1.8%).
SVC FLOW IN RELATION TO LEFT VENTRICULAR OUTPUT
In studies in preterm babies where the ductus arteriosus was closed (so that left ventricular output equals systemic blood flow), SVC flow was on average 37% (SD, 11%) of left ventricular output and there was a significant correlation between the two variables (r = 0.63; p < 0.0001) (fig 7). In the term infant group, the SVC flow made up a mean of 46% of the ventricular output at 17 hours and 52% at 42 hours.

A scatterplot of superior vena cava (SVC) flow against left ventricular (LV) output in preterm babies who had a closed duct at the time of our study.
Discussion
Our study has shown that SVC flow in premature and term infants can be measured by Doppler echocardiography. The superior vena cava is formed by the confluence of the left and right brachiocephalic veins, which drain blood from the arms, head, and brain. Approximately 80% of this blood is estimated to be returning from the brain in infants.4 Therefore, the measurement of SVC blood flow is potentially a marker of cerebral blood flow that can be performed rapidly and non-invasively by the bedside of sick infants.
The validity of Doppler measurement of flow in this vessel is an important issue. The use of Doppler ultrasound to measure cardiac output and flow in vessels is a well established and validated technique in neonates.9-11 The SVC fulfils both requirements for Doppler volumetric measurement of flow—the measurement of velocity with minimal angle of insonation and the determination of vessel diameter. Direct validation of this SVC flow measure with flow probes or thermodilution methods in preterm babies would be difficult. However, its validity as a true measure of flow was supported, in babies with a closed duct, by a significant correlation between the SVC flow and left ventricular output, a measure that has been validated,9 and which is a true representation of systemic blood flow in such babies. In addition, the proportion of left ventricular output represented by SVC flow in these infants without a ductal shunt was similar to other human data. Mohiaddin,12using cine magnetic resonance velocity mapping in healthy adults, found mean SVC flow was 35% of cardiac output; we found a mean of 37% in the preterm group in our study. Salim et alfound that the contribution of SVC flow to total cardiac output varied with age, and accounted for 49% in newborn infants, but used only maximum diameter, which would tend to overestimate the flow.13 We did find that SVC flow accounted for a higher proportion of ventricular output in the term baby group.
The median 8% intra-observer variability and 14% interobserver variability that we documented is comparable with other studies measuring the reproducibility of Doppler techniques.14-18The greater interobserver variability indicates that the use of a single observer, especially if pre-intervention and post-intervention studies are planned, would be prudent. Some of the observed variability might be caused by true fluctuations in the SVC flow over short time periods. Another potential source of error is the variation in SVC diameter through the cardiac cycle (fig 4); this averaged 22% compared with 8–15% for the main arteries. Because flow occurs throughout the cardiac cycle we allowed for this variation in the vessel diameter by averaging the maximum and minimum diameter. This probably results in an underestimate of the real flow, in that more flow will occur at maximum diameter; however, by using the same methodology in all babies, valid comparisons can be made. A review of the paired measurements with the greatest interobserver variation indicated the importance of the imaging window. Moving the transducer too far to the left of the patient may distort the diameter view of the SVC, resulting in an inaccurate diameter measurement. It is optimal to have the transducer as far to the right as possible, so that the vessel is imaged close to a true antero-posterior plane. We did find this view became more difficult with age in some ventilated babies because the right lung inflated over the ultrasound window. Another potential source of error is a persistent left SVC draining into the right atrium via the coronary sinus. This normal variant occurs in 0.3% of the general population,19 and so should always be looked for because it might result in an underestimation of the SVC flow by up to 50%.
Doppler echocardiography of the superior vena cava has been used previously to assess the function of the right heart in adults20-23 and children,24 ,25 and to understand the physiology of bidirectional cavopulmonary anastomoses.13 SVC velocity has also been measured in animals26 and human fetuses.27 However, apart from the studies of Mohiaddin12 and Salim,13only the SVC velocities were measured. Our study is the first to document the range of SVC flow in premature infants.
We have used a subgroup of uncomplicated preterm infants (born less than 30 weeks' gestation) enrolled in a larger study to define a normal range for SVC flow in the very preterm infant. These 25 infants were receiving no, or minimal, respiratory support and we have previously shown this group to have a relatively normal cardiac adaptation.28 In this group, we found that an increase in the SVC flow occurred throughout the first 48 hours, possibly as a result of the improvement in myocardial function that occurs as the heart adapts to extrauterine life. The increase might also reflect closure of fetal channels, in particular the ductus arteriosus, which might be shunting blood away from the systemic circulation. The term infant group generally had similar SVC flows to the well preterm group, confirming that well preterm and term infants have a similar circulatory transition to postnatal life.
We have shown that SVC flow can be measured in preterm infants and demonstrated the range seen in normally adapting term and preterm infants. The application of this method and normal range to the study of pathological haemodynamics in a population of sick preterm infants is described in our accompanying paper.4A SVC flow might also prove to be a useful means by which to assess the effects of circulatory support interventions on blood flow, particularly in the crucial early postnatal period, when ventricular outputs are likely to be confounded by shunts through the fetal channels.