Article Text

Abstract
AIMS To design and evaluate dosing guidelines for vancomycin based on data collected during routine use of the drug.
METHODS Following the observation that 66% of neonatal vancomycin trough concentrations were outside the target range, new dose guidelines were developed using a population pharmacokinetic approach. NONMEM (non-linear mixed effects model) was used to analyse dose histories and 347 concentration measurements collected during routine therapeutic drug monitoring in 59 neonates.
RESULTS Postconceptual ages in the patient group ranged from 26–45 weeks, weights from 0.57–4.23 kg, and creatinine concentrations from 18–172 μmol/l. The population estimate of vancomycin clearance (l/h/kg) was 3.56/creatinine concentration (μmol/l) with an interpatient coefficient of variation (CV) of 22% and volume of distribution 0.67 l/kg with a CV of 18%. Residual error was 4.5 mg/l. When the new recommendations on dosing were used prospectively in a separate group of neonates the proportion of acceptable troughs increased from 33% to 72%.
CONCLUSIONS The pharmacokinetics of vancomycin in neonates and young infants depend on weight and serum creatinine. Preliminary results from the new guidelines indicate an improvement on previous practice, but also an ongoing need to monitor concentrations.
- vancomycin
- population pharmacokinetics
- guidelines
Statistics from Altmetric.com
Although advances in technology have increased the survival of lower gestational age neonates with very low birthweights, such infants are at risk from infection due to environmental factors and an immature immune system. Nosocomially acquired infections are an important cause of morbidity and mortality in neonates in intensive care, and coagulase negative staphylococci are increasingly being recognised as a common cause of life threatening infections.1 2 These changes, coupled with the emergence of multiply resistant organisms, have led to increased vancomycin use. Not surprisingly, this has also resulted in the emergence of vancomycin resistant enterococci (VRE), some of which are resistant to all commercially available antibiotics.3 In the interest of limiting the spread of resistance and optimising response it is important that safe and effective vancomycin treatment is prescribed.
A target concentration strategy has been used to optimise vancomycin treatment in adults and as vancomycin is principally eliminated by renal excretion, initial doses are normally based on renal function.4 There is some controversy over the value of peak concentrations5; excessively high trough concentrations have been associated with nephrotoxicity6and, because vancomycin exhibits time dependent killing,5there is concern that efficacy may be compromised if trough concentrations fall below the minimum inhibitory concentration (MIC) for prolonged periods.
Studies that examined vancomycin processing in neonates have identified correlations between pharmacokinetic parameters and factors such as weight,5-15 postconceptual age,8-10 12-17 gestational age11 18 and serum creatinine.13 15-17 However, many of these studies are limited by small patient numbers and the results are difficult to compare due to differences in the patients’ characteristics, the factors examined, and the techniques used to analyse the data. Some studies involved simple linear or non-linear correlations between clearance, volume, or half life and individual factors12-14 17 while others used more complex techniques such as multiple linear regression8–11 or population analysis.18 Table 1 summarises the factors identified in these previous studies.
Estimates of vancomycin pharmacokinetic parameters from previous studies in neonates and young infants
Some authors have proposed dose guidelines for vancomycin use in neonates but little work has been done to evaluate these recommendations prospectively. Many are also based on arbitrary cutoff values for postnatal age, postconceptual age, weight and (rarely) serum creatinine concentration.7
Experience within our hospital suggested that the dose algorithm that was being used was not achieving target concentrations quickly (Guy’s, St Thomas’s and Lewisham Hospitals Paediatric Formulary, 4th Edition, London). This was in part due to failure to account for impaired renal function and in part because the complexity of dose selection led to errors in use. These concerns prompted us using a population approach, to design dose guidelines from vancomycin data collected during the routine use of the drug. These guidelines were then evaluated prospectively in a separate group of neonates.
Methods
All babies under 3 months old and requiring intensive care who received vancomycin for whatever reason were eligible for inclusion in the study. The protocol for the population study involved no additional blood samples or changes to treatment (except those made on clinical grounds) and was approved by the hospital ethics committee.
Vancomycin was administered as a one hour infusion, and starting doses were determined according to postconceptual age, postnatal age, and weight (Guy’s, St Thomas’s and Lewisham Hospitals Paediatric Formulary, 4th Edition, London). Dosing histories and blood sampling times were collected prospectively from drug administration record sheets that were completed by nursing staff on each occasion that vancomycin was administered, and by medical staff when a blood sample was taken for drug analysis. Biochemical data were obtained from case notes or computer records.
Blood samples for trough values were normally taken at the end of the dose interval, while “peaks” were measured one hour after the end of the infusion. Doses were adjusted by the clinical staff responsible for the patient to achieve target “peak” concentrations of 25–40 mg/l and troughs of 5–12 mg/l. Serum concentrations were analysed by fluorescence immunoassay (TDx, Abbott Laboratories) which had a coefficient of variation of 5.9% at a concentration of 7 mg/l, 3.3% at 35 mg/l, and 3.5% at 75 mg/l.
Detailed dose histories, sampling times, and vancomycin serum concentration measurements for each patient were recorded on a spreadsheet along with the following continuous clinical covariates: postnatal age; weight; postconceptual age; serum creatinine concentration; and gestational age. Records were also made of several categorical covariates: gender; concurrent dopamine use; 5 minute Apgar score; presence of confirmed infection; presence of cardiac disease; ventilation status; and method of feeding.
The pharmacokinetics of vancomycin were investigated using a simultaneous analysis of all concentration–time data using the population pharmacokinetic package NONMEM (non-linear mixed effects model)(Version IV).20 One and two compartment elimination models were compared. Interpatient variability in clearance, volume of distribution, etc, was assumed to be log linear, and additive, proportional, and combined error structures were compared for the residual error on drug concentration.
Individual estimates of vancomycin clearance and volume of distribution were generated by NONMEM after the population analysis. Scatterplots of these estimates against clinical characteristics were used to identify factors that might influence the processing of vancomycin. These factors were then included individually and in combination in the population model until the best description of the data was obtained. Statistical comparisons of hierarchical models were based on differences in the objective function value (OFV) produced by NONMEM. The OFV (minus twice the log likelihood of the data) falls as more parameters are introduced. Differences in OFV approximate to a χ2 distribution with degrees of freedom equal to the difference in the number of parameters. Significance was set at p<0.005 (a fall of 7.9 or more). If two models contained the same number of parameters, the model that gave the lower OFV was considered superior.
The population pharmacokinetic parameter estimates obtained using the final model were used to develop new dose guidelines (see ). These guidelines were then introduced into one of the intensive care areas and used to determine initial dose regimens for new patients who required treatment with vancomycin. Dose histories, sampling details, and serum concentration measurements were recorded for each patient and the results were assessed against the target concentration ranges.
Results
Data were initially collected from 70 patients of whom 11 were excluded from the analysis. Vancomycin was discontinued in one infant before a concentration was measured, full dose details were not available in six patients and three were more than 3 months old. Data from a further infant were removed after preliminary investigations identified this individual as an outlier. This patient had rapidly changing renal function associated with a fall in creatinine concentration from 459 μmol/l to 316 μmol/l over three days. The final data set used in the analysis comprised 59 patients and 64 courses of treatment. The clinical characteristics of these patients are summarised in table 2.
Clinical characteristics of patients included in population dataset (n=59)
The starting doses of vancomycin ranged from 15 mg/kg 24 hourly to 15 mg/kg three times daily. These complied with current guidelines (Guy’s, St Thomas’s, and Lewisham Hospitals Paediatric Formulary, 4th edn) and minor deviations were usually due to rounding of doses for ease of preparation. Three hundred and forty seven concentrations were measured of which 153 were peaks, 183 were troughs, and 11 were mid dose samples. Thirty three per cent of the first trough concentrations were within the range 5–12 mg/l and only 20% of patients had both their peak and trough concentrations within the desired target range.
The two compartment model had a lower OFV than the one compartmental model (difference 56.5), although there was no obvious difference in scatterplots between the two models. Residual error was best described by an additive structure. When CL, volume of the central compartment (V1), volume of the peripheral compartment (V2), and intercompartmental clearance (Q) were plotted against clinical characteristics, only three covariates (postconceptual age, weight, and serum creatinine concentration) exhibited obvious trends. Figure 1 illustrates that the relations with creatinine concentration and postconceptual age were non-linear while that with weight appeared linear.
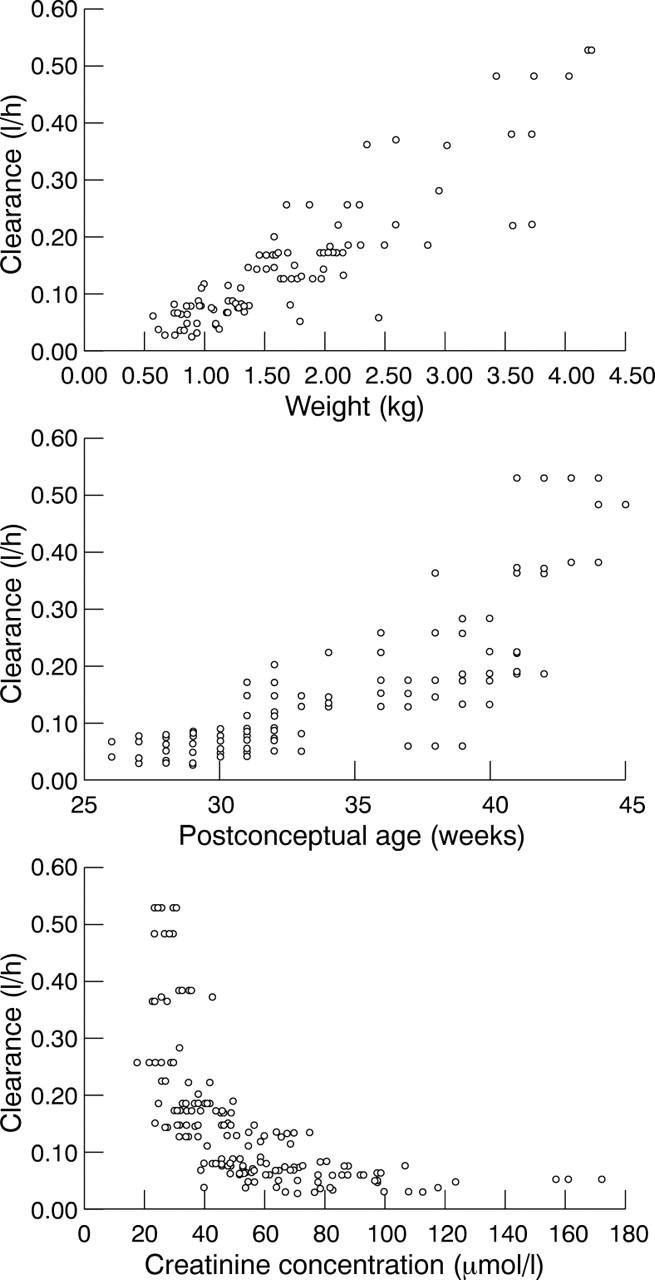
Scatterplots illustrating the relations between individual clearance estimates, weight, serum creatinine concentration and postconceptual age.
When added to the basic model, a linear relation with no intercept best described the association between clearance and weight, while non-linear models (CL = θ1 × factorθ2, where θ represents the parameter to be estimated) proved superior for both postconceptual age and serum creatinine concentration. The relation between clearance and creatinine concentration could be further simplified by using 1/creatinine concentration—that is, creatinine/1. Further improvements to the fit were observed when weight, postconceptual age, and creatinine were combined.
Scatterplots identified weight and postconceptual age as the factors most likely to affect volume of distribution and the best overall model related clearance to weight and creatinine concentration, and V1 to weight.
The final covariate model was then re-examined using a one compartment structure. Although the OFV was higher (difference 32.2), examination of residual plots suggested that there was little advantage in using the more complex model. The covariate analysis was repeated with the simpler model and it was again found that clearance depended on weight and creatinine concentration and volume depended on weight. Table 3summarises the principal models that were tested.
Summary of principal covariate models tested in population analysis (one compartment structure)
Inclusion of postnatal age, sex, infection status, cardiac status, ventilation status, 5 minute Apgar score, and dopamine use produced no significant effects, although an apparent effect of intravenous feeding on clearance was identified. Gestational age was examined using both continuous and categorical “cutoff” models and a further small effect on clearance was observed in infants with gestational ages less than 35 weeks. No other cutoff between 28 and 37 weeks was significant. Although the improvements in fit achieved with either nutrition or gestational age just achieved statistical significance, inclusion of these factors had little influence on scatterplots and interindividual variability. It was therefore decided to proceed using the model based on weight and creatinine. This model had the following form:
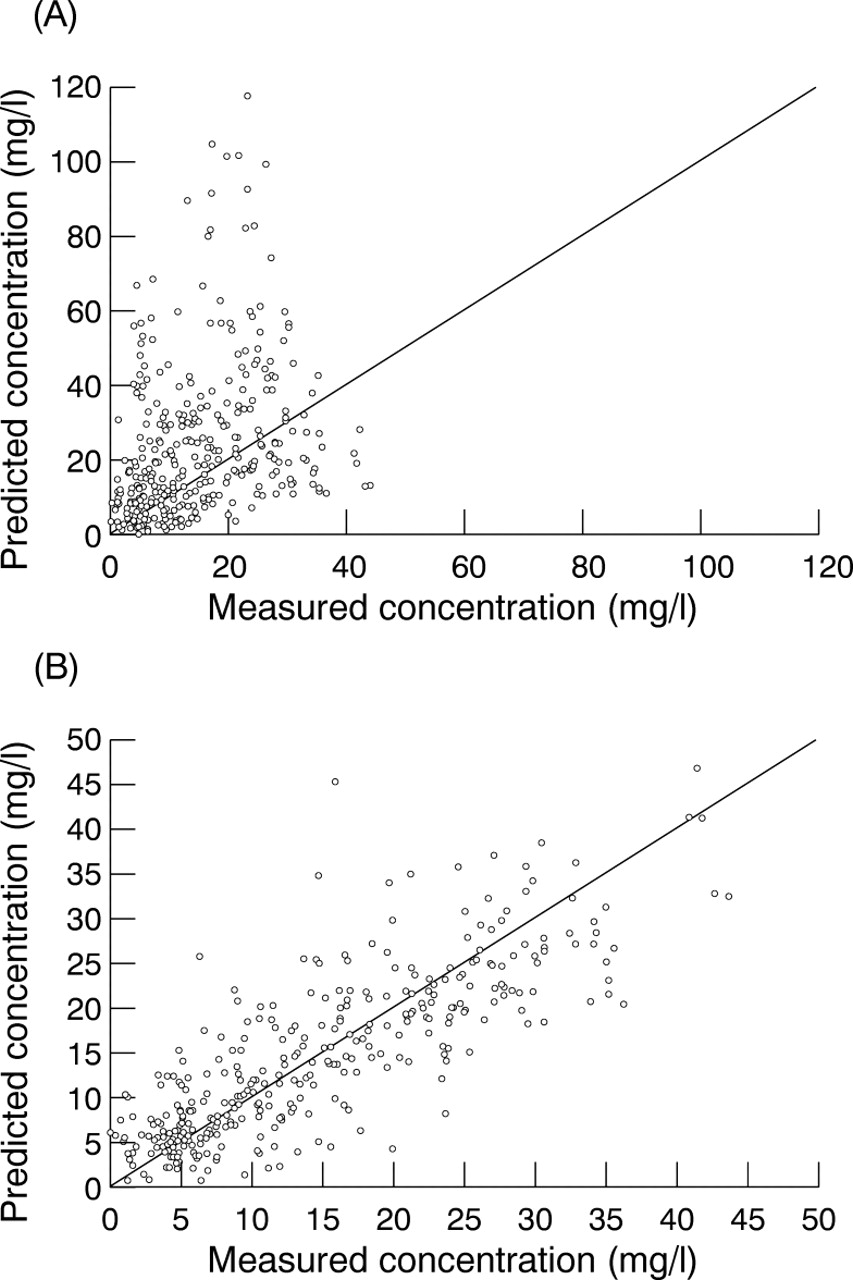
Population predicted vs measured concentrations obtained using the basic (A) and full (B) models.
Pharmacokinetic parameter estimates from basic and final models
As weight could be incorporated into the dose (mg/kg), the population analysis suggested that only creatinine concentration needed to be included in the dose recommendations. Doses that produced predicted peaks above 20 mg/l and troughs around 10 mg/l were identified, as described in the . Table 5 shows the final dose recommendations while fig 3 shows the typical population profile and 67% confidence intervals for a patient with a creatinine concentration of 45 μmol/l.
Vancomycin dose guidelines
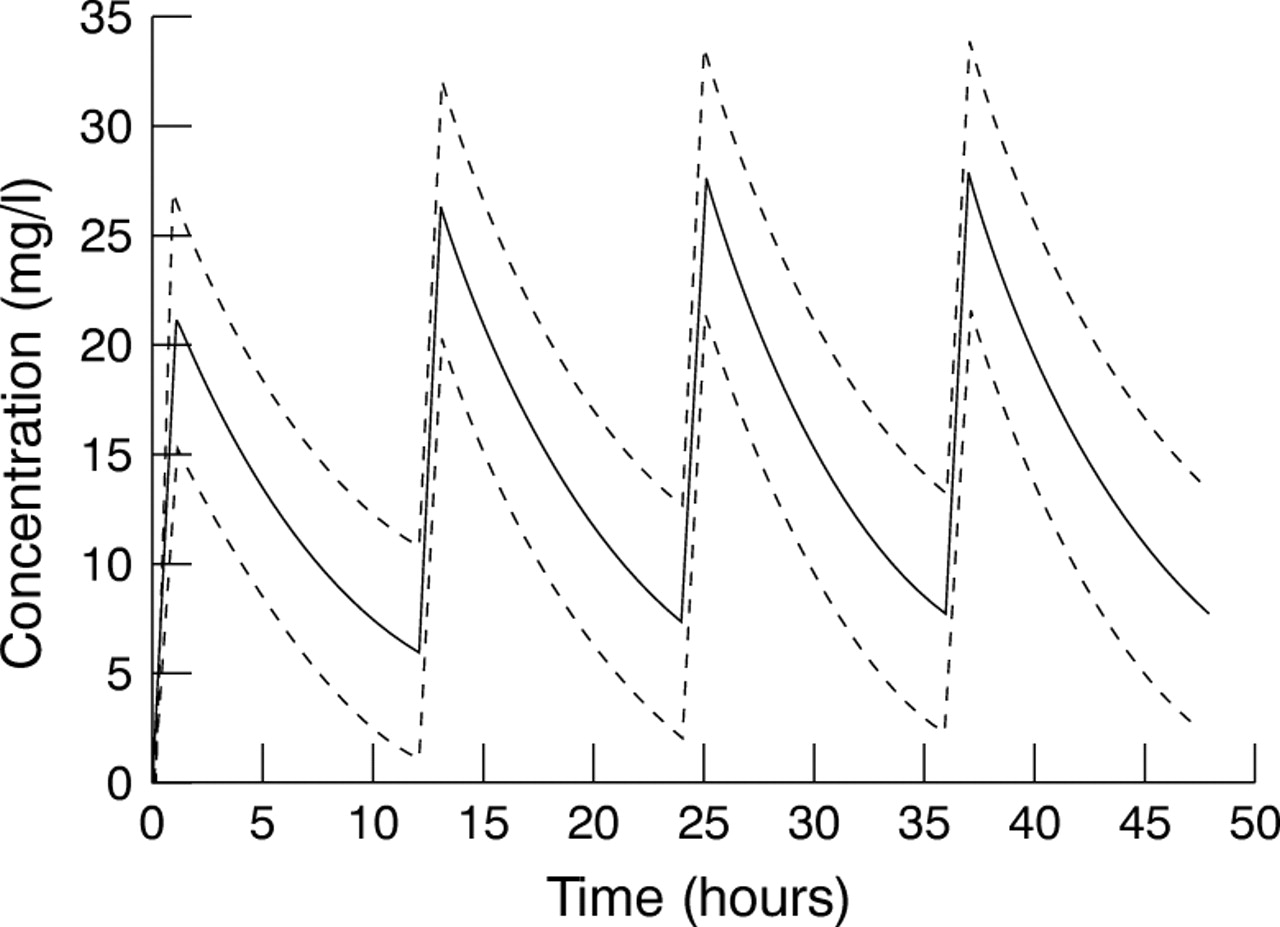
Typical population profile and 67% confidence intervals for a patient with a creatinine concentration of 45 μmol/l given a dose of 15 mg/kg 12 hourly.
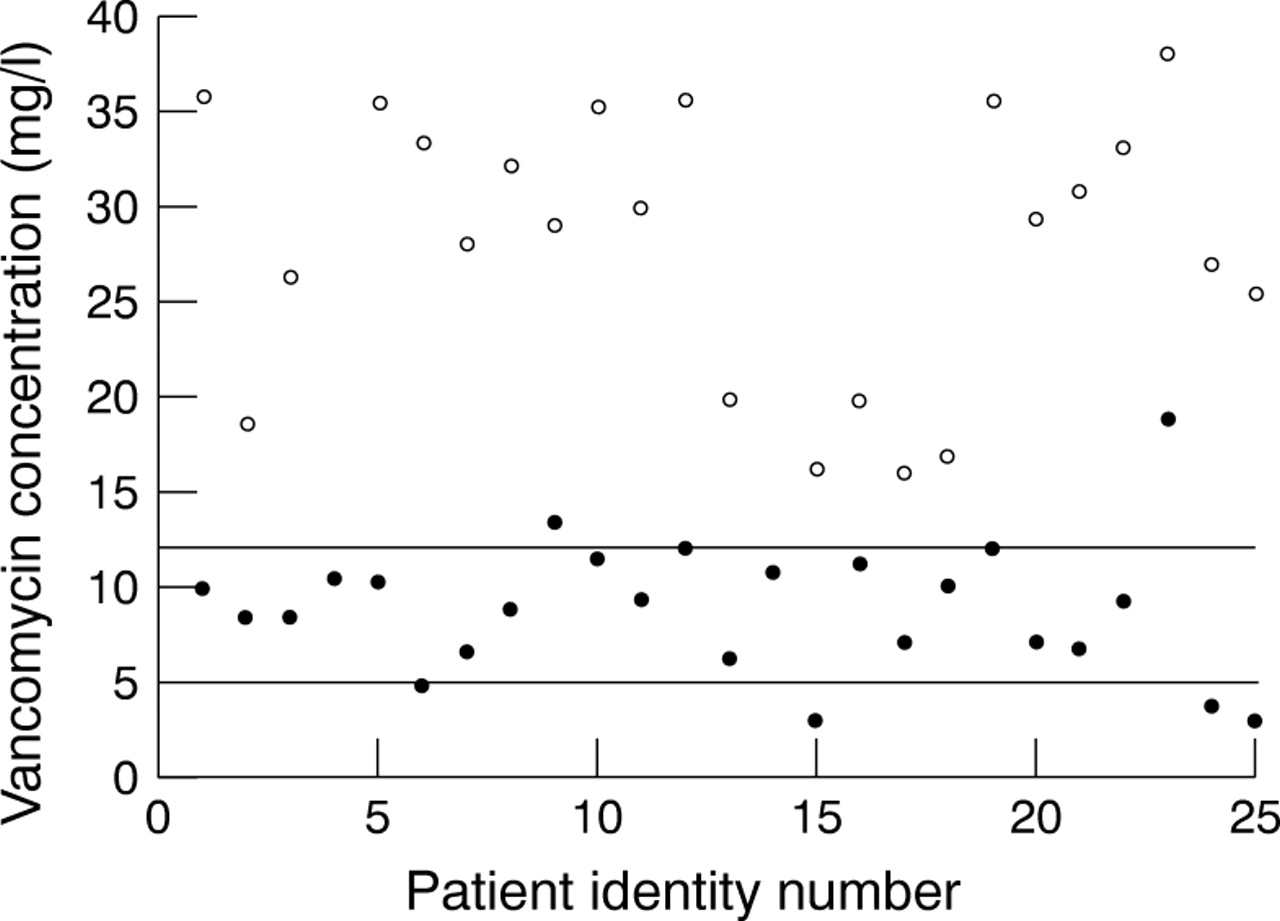
These new guidelines were used in 25 new patients and the first set of concentrations achieved in these patients is illustrated in fig4. The percentage of troughs in the range 5–12 mg/l had increased to 72% and only three troughs were less than 4.5 mg/l. Four peaks were less than 20 mg/l and none was above 40 mg/l.

Peak (o) and trough (•)concentration data observed in 25 neonates after new dose guidelines had been introduced.
Discussion
The study was initiated in response to clinical concerns about the high incidence of potentially subtherapeutic vancomycin trough concentrations. Data collected from the study population were consistent with these findings, with 30% of 122 vancomycin troughs being <5 mg/l, and only 33% of first troughs in the target range of 5–12 mg/l. Similarly, 38% of peaks were <20 mg/l and only 30% were within the target range of 25–40 mg/l used within the hospital at the time of the study. Even allowing for the current controversy over the need to measure vancomycin peak concentrations,5 the high incidence of low troughs was not desirable.
With 59 patients and 64 courses of treatment, this study compares favourably with many previous studies in which numbers ranged from 11–44 patients.8-17 Furthermore, in contrast to some earlier investigations, this study includes a wide range of gestational and postnatal ages, weights and renal function. The population approach that was used to analyse the data was also used by Seayet al,18 who recruited a larger group of 192 patients, but they did not identify an influence of renal function in their study.
One patient in the original dataset was an outlier. This patient had a very high initial serum creatinine concentration secondary to acute hypoxic insult which quickly resolved during treatment with vancomycin. As the rapid changes in renal function observed were unusual and compromising the analysis, this patient was removed from the file.
When the basic structural models were compared, the two compartment model appeared to be superior and was therefore used for the model building. However, comparison of one and two compartment structures using the full covariate model suggested that there was little advantage in using the more complex approach; thus a one compartment model was used to develop the dosing guidelines. These observations are consistent with the findings of Seay et al,18 who also found that a one compartment model was adequate. Others have concluded that the distributive phase is not clinically important in determining vancomycin clearance in neonates and infants if peak vancomycin concentrations are measured at least one hour after a 60 minute infusion.15 21 All “peak” concentrations in our study were drawn at least one hour after the end of the infusion.
Gestational age, postnatal age, postconceptual age and weight are related to maturational changes in neonates, and many studies have identified these factors as influencing vancomycin pharmacokinetics.8-18 Postconceptual age and weight had powerful effects on vancomycin clearance, when included as single covariates, and this is consistent with the findings of several studies.8 9 12 14 16 However, only four authors have previously identified an influence of creatinine concentration.13 15-17 As vancomycin is mainly cleared renally, the lack of significance in previous studies may reflect patient groups without impaired renal function. The wide range of creatinine concentrations in our study facilitated the identification of this factor. A slightly unexpected finding was the lack of an additional effect when postconceptual age was added to the model containing weight and creatinine. However, as weight and postconceptual age were highly correlated (correlation coefficient 0.89), this observation is perhaps not surprising.
Other factors, such as 5 minute Apgar score, ventilation status, and dopamine exposure were significant on initial analysis by Seayet al, 18 but only gestational age and dopamine exposure were required in their full model. They found that clearance was lower in infants under 33 weeks of gestational age and infants receiving dopamine. Only two patients in our study received dopamine and no effect was found. With gestational age, significance was achieved only when infants under 35 weeks were considered as a separate group. As lower cutoffs had no effect and the parameter estimates suggested an unexpected 27% increase in clearance, this is likely to be a spurious result. Similar concerns were associated with the apparent influence of form of nutrition. Infants who received intravenous feeding had estimated clearances 21% higher than infants receiving nasogastric or orogastric feeds, but inclusion of this factor had little effect on the overall fit of the data. Larger patient numbers would be required to confirm if this effect is real or spurious.
Both postconceptual age and weight significantly influenced volume of distribution, but weight had a more powerful effect and the addition of postconceptual age offered no advantage. Few authors have tried to identify a specific model for volume, but the findings concur with those of Reed et al 9 and Schiable et al.10
Interpatient variability in clearance at 22% was lower than the 36% variability found by Seay et al,18 but both interpatient variability on volume (18% vs 19%) and residual error (4.5 mg/l vs 3.8 mg/l) were similar.
The final guidelines comprised seven dosing categories, to ensure that at one standard deviation above average the trough should still be less than 15 mg/l. Particular difficulties were encountered in establishing a suitable dosing regimen for patients with serum creatinine values between 30 and 60 μmol/l. Figure 1 illustrates the reason for this by showing the rapid decline in vancomycin clearance as creatinine concentrations rise within this range. The new guidelines are simpler than those currently in use which are based on a combination of weight, postconceptual age, and postnatal age. It was felt that excluding postconceptual age as a criterion for dose selection was a positive finding, as precise gestational age is not always known and postconceptual age can be difficult to calculate in “long term” patients, thus leading to errors in dose calculation. A dose regimen based on creatinine and weight, which are easily measured, would hopefully reduce the potential for errors.
A limitation of using serum creatinine concentration is the influence of maternal creatinine which dominates for at least the first 24 hours of life. However, vancomycin is used in the treatment of infection caused by organisms such as coagulase negative staphylococci, which are frequently associated with invasive procedures such as the placement of long lines. It is seldom that such procedures become necessary, or that the clinical signs of nosocomial infection become apparent, within the first 48 hours of life, therefore vancomycin is rarely prescribed this early. As the median postnatal age was 20 days, maternal creatinine should not have confounded the results.
We considered it important to establish guidelines for dosing in renal impairment. Current experience suggests that infants with renal impairment may be given very low doses that produce troughs of only 1–2 mg/l. Conversely, babies with raised serum creatinine concentrations may be given “standard” doses that lead to troughs of 25 mg/l (or higher). Although creatinine values of up to 170 μmol/l were seen in the study, 100 μmol/l was chosen as the upper limit for the nomogram. Infants with higher serum creatinine concentrations are often clinically unstable, and although the guidelines advise a first dose of 15 mg/kg, they also direct medical staff to monitor the trough concentration until it falls below 10 mg/l.
As can be seen from fig 3, the pharmacokinetics of vancomycin are not easy to predict in an individual. The dose guidelines presented here therefore do not replace the need for serum concentration monitoring, although it was hoped that they might provide initial doses that were closer to the final requirements than those that have been used to date. This was investigated in a preliminary assessment of 25 infants. The results were very encouraging as 72% of “first” trough concentrations were within target range. However, three patients had potentially subtherapeutic concentrations and one patient had high concentrations which confirms the high variability that was identified in the population analysis.
In conclusion, a population analysis has shown that the pharmacokinetics of vancomycin in neonates and young infants depend on weight and serum creatinine. The results of this analysis were used to design a new set of dose guidelines. Preliminary results indicate an improvement on previous practice but also an ongoing need to monitor concentrations.
Acknowledgments
We thank Drs T Turner, B Holland, J Coutts and Mr G Haddock, and the neonatal surgical team, for their support, Dr C Lucas for her help in collecting the concentration results, and the medical and nursing staff of the neonatal intensive care wards at Yorkhill Hospitals for their help and cooperation.
DESIGN OF VANCOMYCIN DOSING GUIDELINES
Factors identified from the population analysis as having a significant influence on the pharmacokinetics of vancomycin were used to generate simulated “patients” who had the following creatinine concentrations: 20; 25; 30; 35; 40; 45; 50; 55; 60; 65; 70; 75; 80; 85; 90; 95; 100; 105; 110; 115 and 120 μmol/l. The expected steady state concentrations were then calculated for each “patient” using the population clearance and volume model and each of the following doses: 20 mg/kg; 15 mg/kg; 12 mg/kg; and 10 mg/kg. Intervals of 8, 12, 18 and 24 hours were tested for each dose.
Concentrations were calculated using the following equation:

These guidelines were used in conjunction with the structural and variance parameter estimates to produce mean and 67% confidence intervals of the predicted steady state concentration–time profiles for each dosing regimen. These profiles were examined visually, the draft guidelines were modified, and the process was repeated until the final dosing categories were achieved.