Article Text

Abstract
AIM To develop and evaluate a score which quantifies mortality risk in very low birthweight (VLBW) infants (birthweight below 1500 g) at admission to the neonatal intensive care unit.
METHODS Five hundred and seventy two VLBW infants admitted from 1978 to 1987 were randomly assigned to a cohort (n = 396) for score development and a cohort (n = 176) for score validation. Two hundred and ninety four VLBW infants admitted from 1988 to 1991 were used to compare risk adjusted mortality between the two eras.
RESULTS Using multiple regression analysis, birthweight, Apgar score at 5 minutes, base excess at admission, severity of respiratory distress syndrome, and artificial ventilation were predictive of death in the development cohort. According to regression coefficients, a score ranging from 3 to 40 was developed. At a cutoff of 21, it predicted death in the validation cohort with a sensitivity of 0.85, a specificity of 0.73, and a correct classification rate of 0.76. The area under the receiver operating characteristic curve was 0.86. There was no significant difference in risk severity and in risk adjusted mortality between the eras 1978–87 and 1988–91.
CONCLUSION The present score is robust, easily obtainable at admission, and permits early randomisation based on mortality risk.
- mortality risk
- scoring system
- very low birthweight
Statistics from Altmetric.com
Infant mortality is one of the leading public health problems in developed countries. Very low birthweight (VLBW) is a major cause of death in the first year of life.1 Most VLBW infants (birthweight below 1500 g) receive intensive care and neonatal mortality has diminished considerably during the past four decades.2 New therapeutic methods have been investigated in numerous clinical trials. But are the results comparable? In some randomised, placebo controlled surfactant trials results differed considerably between collaborating centres.3 4 The assumption that populations defined by birthweight and gestational age are comparable in all hospitals participating in a multicentre trial or during different time periods is questionable.
An approach towards quantifying mortality risk is to develop predictive models using logistic regression. These models sum up patient data related to anamnestic and clinical risk factors and to severity of disease, to assess the probability of a patient’s survival. Such models have been validated in adult (APACHE, TRISS) and in paediatric intensive care (PRISM, PeRF).5-9 Attempts have also been made to predict the death of inpatient VLBW infants from their initial disease severity.10-12 A score for neonatal acute physiology (SNAP) was developed by Richardson et al, using the severest physiological impairments in each organ system during the first 24 hours.13 Tarnow-Mordi et alpublished another scoring system, the clinical risk index for babies (CRIB), which takes into account birthweight, gestational age, maximum and minimum fraction of inspired oxygen (FIO2) and maximum base deficit during the first 12 hours, as well as presence of congenital malformations.14 The last two scores estimate the risk of dying in hospital with high accuracy, but cannot be assessed before 12–24 hours of age, during which time therapeutic interventions, such as surfactant substitution, or assignment to specific study groups, must already have taken place. The aim of this study was (1) to establish a score which quantifies mortality risk of VLBW infants on admission to the neonatal intensive care unit (NICU) and (2) to assess period specific changes in risk adjusted mortality in our NICU.
Methods
From 1978 to 1991, 978 VLBW infants with a median (5th; 95th percentiles) birthweight of 1150 (680; 1470) g and a median (5th; 95th percentiles) gestational age of 29.3 (25.0; 35.0) weeks were admitted to our NICU. Six hundred and fifty five of these infants were cared for from 1 January 1978 to 31 December 1987 and 323 from 1 January 1988 to 31 December 1991. Charts of infants admitted before 1 January 1987 were reviewed retrospectively; thereafter data were collected prospectively. One hundred and twelve infants (83 in the first and 29 in the second period) were excluded from this evaluation either because more than 10% of the required data were missing or because the infants’ gestational ages exceeded 33 completed weeks and the problems attendant on very immature babies were unlikely. Conditions incompatible with long term survival, such as severe malformations or inborn errors of metabolism, were not excluded. Infants born outside our perinatal centre and transported after birth were called outborns. The outcome variable “death in hospital” was defined as death during the first stay in hospital (range 410 days) following preterm birth. Gestational age was estimated from early ultrasound derived fetal morphometric data or from the given date of last menstruation or, if this information was not available or unreliable, from clinical criteria according to Finnström.15 Infants’ Apgar scores were assessed at 1, 5, and 10 minutes after birth.16 Immediately after admission to the NICU, rectal temperature was measured and arterial or capillary blood was drawn for gas analysis and determination of base excess and glucose. Respiratory distress syndrome (RDS) was diagnosed according to Hjalmarson and was graded according to Giedion et al.17 18 In none of the infants had surfactant been administered before admission. This study was approved by the local ethical committee.
SCORE DEVELOPMENT
To develop and validate a score for mortality risk we divided the 572 VLBW infants included between 1 January 1978 and 31 December 1987 into two cohorts using the random number generator of a personal computer, with a random split of about 70:30. This led to a cohort for score development of 396 infants and a cohort for score validation of 176 infants. Using forward stepwise multiple logistic regression analysis, with death in hospital as the dependent variable, the prognostic variables for the score were selected from the following variables obtained on admission to the NICU: inborn vsoutborn; delivery room resuscitation by a neonatologist; Apgar score; gender; gestational age; birthweight; rectal temperature; pH; PO2; PCO2; base excess; blood glucose; artificial ventilation; grade of respiratory distress syndrome. For logistic regression analysis, continuous variables were transformed into five categories each. In order to keep weighting of the variables balanced, artificial ventilation was categorised as 4, the birthweight class above 1499 g as 0 (table 1). The regression coefficients for categories of those variables which were significantly (P < 0.05) associated with death in hospital were converted into integers in a logistic model.19 A bivariate analysis was calculated to look for collinearity.
Mortality risk score for very low birthweight infants obtainable at admission to neonatal intensive care
SCORE VALIDATION
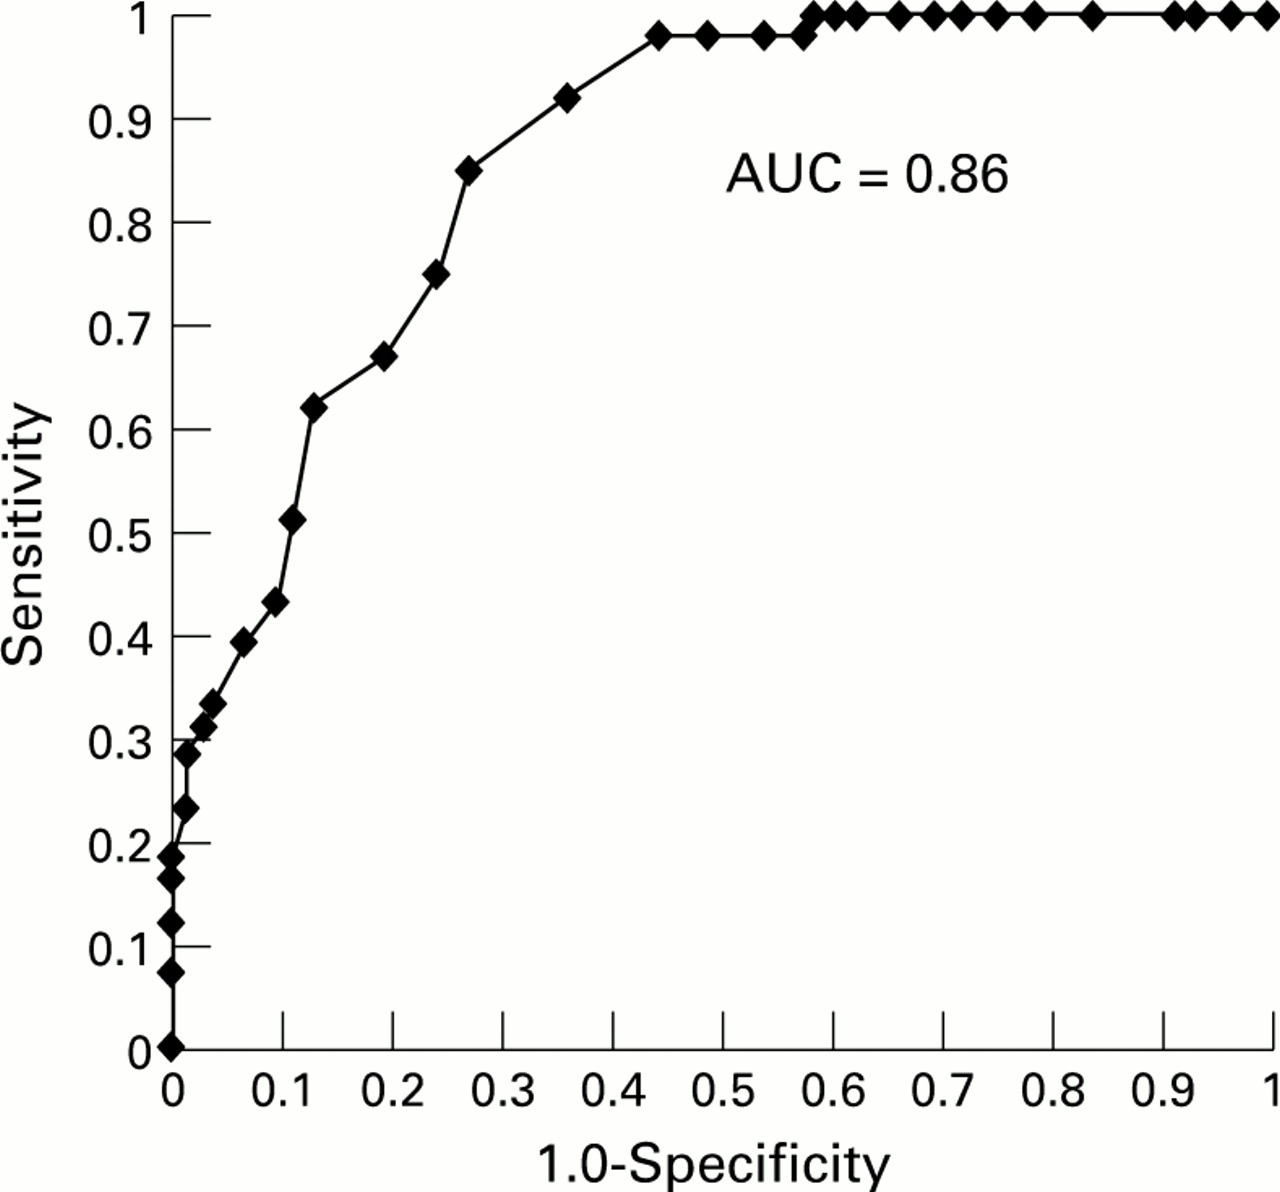
The score was validated in the other cohort of 176 VLBW infants born in the same period using the receiver operating characteristic curve.20 This curve represents the ability of a test to discriminate between populations (survivors vsnon-survivors). It plots the tradeoff between sensitivity and false positive rate (or 1 minus specificity) over the full range of cutoff points. A good test would have a high sensitivity (true positive rate) and include few false positives and the resulting area under the curve would approach 1.0.
STATISTICS
To establish the validity of the logistic regression and to check that the observed and predicted values were similar the Hosmer Lemeshow goodness of fit test was performed. This indicates where the score differs significantly from what is observed. A Mantel Haenszel stratified χ2 test was used to capture the common odds ratio between eras. Ranks of variables were compared using the Mann-Whitney U test and proportions using χ2 with Yates’ correction. The stratified Mantel Haenszel test was performed using the BMDP Statistical Software (University of California, USA). All other calculations were done using the software package SPSS-PC+ 3.1 (SPSS, Inc., Chicago, Illinois, USA).
Results
Table 2 shows the logistic β slopes, the standard errors, the regression coefficients, and the P values of the five factors found by stepwise logistic regression analysis to be predictive of death during first stay in hospital. The equation to predict mortality is also given in table 2. Although gestational age and mortality were significantly associated in a bivariate analysis, gestational age was not predictive of death when using multiple logistic regression analysis.
Stepwise forward multiple regression analysis showing effect of five independent variables on mortality in very low birthweight infants and resulting equation to predict mortality
Taking into account the regression coefficients obtained for the five predictors in the logistic regression analysis, we established a disease severity score up to a maximum of 40 points (table 1).
Figure 1 reveals the receiver operating characteristic curve resulting from the score’s sensitivity and specificity to predict mortality in the validation cohort at cutoff points from 3 to 40. The area under the curve, representing the score’s quality, was 0.86. The prevalence of death in hospital after preterm birth was 0.31 in our validation group. At a cutoff of 21 points we observed a sensitivity of 0.85, a specificity of 0.73, a negative predictive value of 92%, and a positive predictive value of 55%. At this cutoff, 76% of the patients were classified correctly. At a cutoff of 18 points, the positive predictive value was 44% and the negative predictive value 98%; at a cutoff of 29 points the positive predictive value was 80% and the negative predictive value 78%.

ROC curve for score to predict death in VLBW infants; AUC is area under curve.
For score application we defined four mortality risk groups: a score up to 18 points was classified as “mild risk” and a score from 19 to 23 points as “moderate risk.” Infants with 24 to 28 points were assessed to be at “high risk,” and with more than 28 points to be at “extreme risk” of death in hospital.
Characteristics of VLBW infants studied from 1978 to 1987 and from 1988 to 1991 are shown in table 3. Significant differences between the two periods were found for (1) the percentage of inborns; (2) qualification of the resuscitating physician; (3) gestational age; (4) pH, base deficit, and temperature at admission; (5) incidence of RDS; and (6) frequency of artificial ventilation.
Characteristics of very low birthweight infants at admission to intensive care unit in two time periods. (If not indicated otherwise, values are given as median (5th; 95th) percentiles)
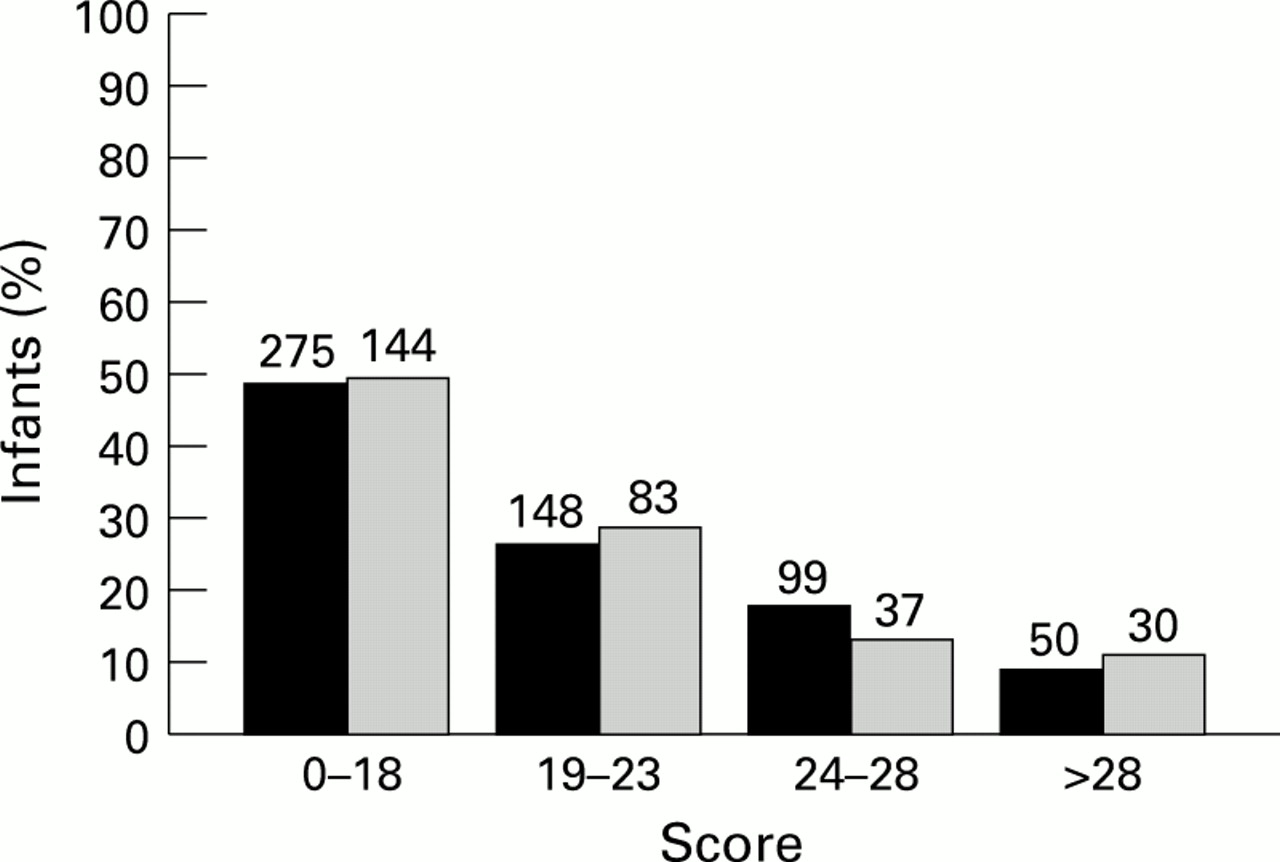
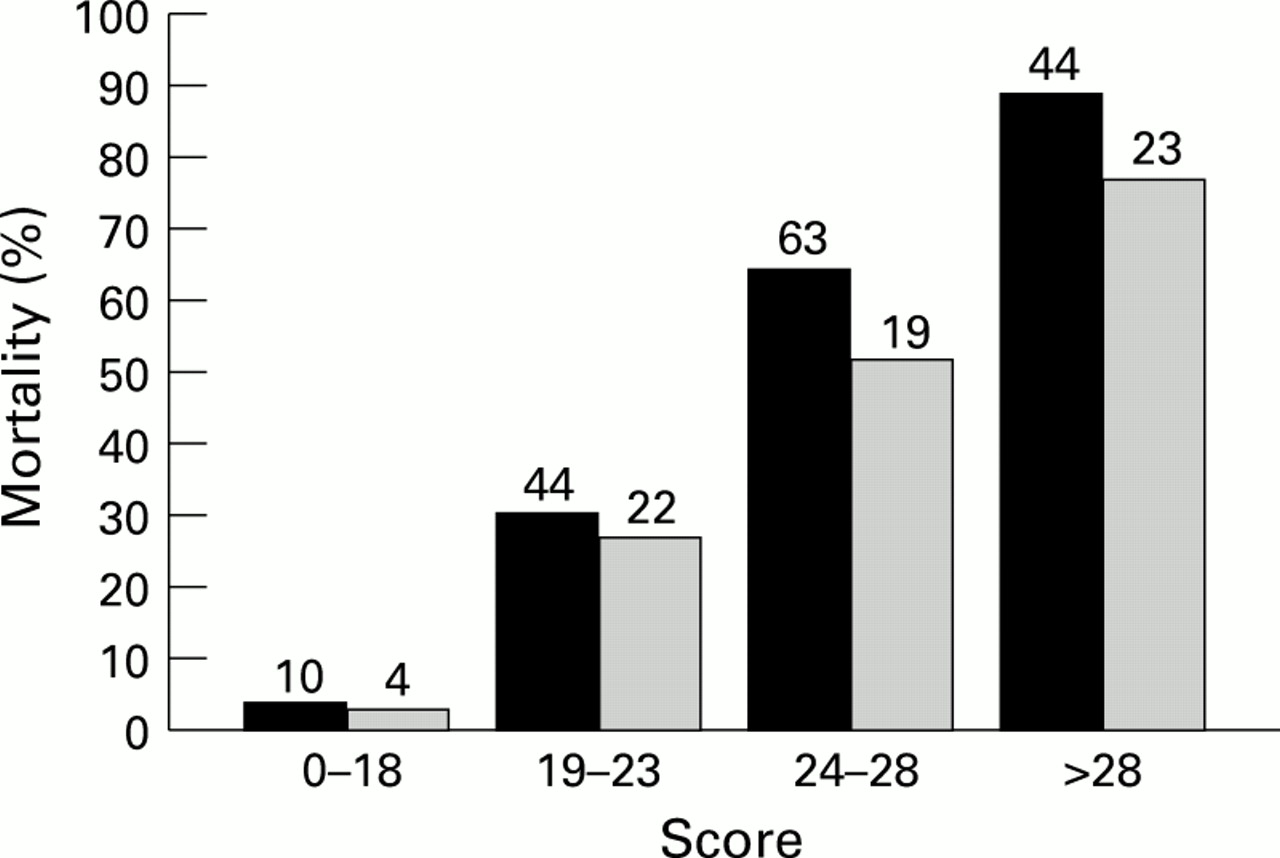
The distribution of infants to the ascending ranges of score in both periods did not differ significantly (fig 2), although there was a significant increase of infants with birthweight below 750 g in the later period (P < 0.01). In all four risk groups mortality was lower in the more recent period (fig 3). However, this difference did not reach significance (table 4).

Distribution of LBW infants to the ascending ranges of the score for mortality risks: ⩽ 18 = low risk; 19–23 moderate risk; 24–28 high risk; and > 28 extreme risk. Absolute numbers of infants admitted are shown above the columns. Solid columns indicate the period 1978–87 (n = 572) and dashed columns the period 1988–91 (n = 294).

Mortality of VLBW infants in relation to ascending ranges of the score for mortality risk: ⩽ 18 = low risk; 19–23 moderate risk; 24–28 high risk; and > 28 extreme risk. Absolute numbers of infants who died are shown above the columns. Solid columns indicate the period 1978–87 (n = 572) and dashed columns indicate the period 1988–91 (n = 294).
Comparison of risk adjusted mortality between 1978-87 and 1988-91
The Hosmer Lemeshow goodness of fit test showed that there were no significant deviations between observed and expected values for the development cohort (P = 0.56), the validation cohort (P = 0.99), and the most recent cohort of 1988–91 (P = 0.71).
Discussion
Crude comparisons of hospital or period specific mortality can be highly misleading. Reliable assessment of neonatal outcome is impossible without correcting for major risk factors, particularly birthweight and initial disease severity. Maddock et allooked at the outcome of mechanically ventilated newborn infants in two geographically defined regions.21 They found a clear difference in neonatal mortality after adjusting for birthweight. This could have been due to different ventilatory managements. However, higher mortality in one population may also be explained by lower disease severity in the other or by different numbers of extremely immature infants.
Our aim was to develop and validate a score which permits classification of VLBW infants according to their mortality risk as soon as possible after admission to the NICU. Using multiple regression analysis, five variables, all of which are easy to obtain on admission, were found to be highly predictive for death in hospital: birthweight; Apgar score at 5 minutes; base excess at admission; severity of RDS; and artificial ventilation. Surprisingly, gestational age was not significantly associated with death. We had expected that extremely immature babies would be more likely to die in hospital than more mature infants. However, other authors also found only a weak association between gestational age and death in hospital.12 14 As expected, the logistic regression analysis showed a collinearity between our predictive variables “grade of RDS” and “artificial ventilation.” However, if we abandoned the variable “artificial ventilation” in our calculation, the prognostic model had an inferior quality: the area under the ROC curve decreased from 0.86 to 0.81.
This scoring system permits the identification of VLBW infants with similar disease severity and similar mortality risk and the comparison of neonatal intensive care among different hospitals or time periods. In our study the cohort from 1978 to 1987 did not differ from that of 1988 to 1991 with respect to the initial mortality risk. The rationale for defining these two periods were major changes in perinatal and neonatal conditions, such as a regionalisation programme for high risk pregnancies and premature births, resuscitation by neonatologists, and surfactant therapy for respiratory distress syndrome. In this context we are aware that interpreting NICU mortality over 14 years is difficult due to increasing knowledge, developing techniques, and changing staff.
In each risk group mortality was lower in the period 1988–91 than in 1978–87. However, this difference did not reach significance. This may be due to too small numbers increasing the risk of type II error.
Like other authors, we did not achieve our goal of predicting death with an accuracy of 100%. The prevalence of death during first stay in hospital was 0.31 in our validation group. The positive predictive value was 55% at a cutoff of 21 points. This increased to 80% with a cutoff of 29 points. Within this score range, prediction was difficult although the infants were at high mortality risk. Below this range (⩽ 18) prediction of survival was accurate (negative predictive value 98%); a high score (> 28) implied death in hospital in about 80%. The area under the ROC curve, a quality criterion of the test model, was 0.86 for our score compared with 0.90 for the APACHE III and CRIB scores and 0.92 for the PRISM and SNAP-PE scores.6 8 14 22
Reports by Horbar et al, Maddock et al, Patterson and Halliday, Tarnow-Mordi et al, the International Neonatal Network, and Richardson et al, as well as our own study, strongly suggest that predictive models for outcome in VLBW infants can be developed that are robust and easily obtainable.10-14 21 22 The advantage of our score system is its very early evaluation of risk mortality, especially if infants have to be assigned to different study groups in the first hours after birth. In contrast to our score obtained on admission to the NICU, Tarnow-Mordi et al, the International Neonatal Network, and Richardson et al scored after 12 and 24 hours, respectively, during which time considerable therapeutic interventions in the NICU had already taken place.11 13 14 The therapeutic management in the NICU does not influence our score. However, it must be acknowledged that four components of our score—Apgar, grade of RDS, artificial ventilation, and base excess—are susceptible to therapeutic bias due to prior neonatal intervention, such as policies for resuscitation, elective intubation, surfactant therapy, administration of alkali in the delivery room, etc.
Our score may become an efficient tool for settling some problems affecting controlled clinical trials, especially if infants have to be assigned to different study groups soon after admission to the NICU. It may allow early randomisation based on risk of mortality. It also may help to differentiate treatment effects and variations in mortality risk over time. This score was not intended to limit care of the individual infant. Because of the obvious ethical issues involved, we want to emphasise that our score system is not sufficiently accurate to identify those patients who cannot be saved.
Acknowledgments
We thank in particular W Tarnow-Mordi, G Parry, P Stevens, and H Segerer for valuable suggestions, and W Hopfenmüller and A Mohnhaupt for statistical advice.
Supported by BMFT, Public Health 07PHF01, No B3.
References
Commentary
The authors of the “Berlin score” must be congratulated on developing a very promising tool for stratifying infants in individual hospitals in randomised controlled trials according to risk of mortality. However, it would be unwise to use it for making risk adjusted comparisons of mortality between hospitals or over time. The inclusion of ventilatory support before admission would only be valid in the score if all hospitals had similar policies. In fact, policies for artificial ventilation vary widely. Similarly, clinical assessments of respiratory distress syndrome and Apgar scores may vary with local practice. As these three items account for up to 60% of the maximum risk, their inclusion in the score could lead to significant bias when adjusting for risk of mortality between hospitals or over time. This would be of little importance in randomised controlled trials if infants were stratified by risk within individual hospitals.
The ideal scoring system for neonatal risk requires items which are prognostically accurate, objective, routinely available, measured at the moment of birth and independent of the quality of prior care. Unfortunately, this holy grail is never likely to be achieved. Measures of risk based on physiological derangement or illness severity can be standardised, thus reducing bias due to interobserver variation. However, it is impossible to disentangle whether measures of illness severity reflect intrinsic disease, the effects of antenatal or early neonatal care, or a combination of all three. Even demographic measures of risk like gestation and birthweight are not inured from this problem as they also reflect prior quality of care. For example, variations in rates of very preterm delivery may reflect differences in obstetric management. Furthermore, variations in use of antenatal steroids1-1 may lead to substantial variations in gestation specific severity of illness. Unless the use or neglect of antenatal steroids is accurately accounted for, variations in gestation specific mortality could wrongly be attributed to differences in neonatal care. Scores which include illness severity measured shortly after birth can account for variations in use of antenatal steroids1-2 and predict mortality more accurately than demographic variables alone.1-3-1-5 They can therefore adjust more reliably for differences in prior risk, treatment, and illness severity than demographic variables alone, allowing more reliable inferences about differences in subsequent quality of care to be drawn. However, these inferences can only be made about quality of care givenafter the point when risk has been measured.
Discrepancies in mortality after adjusting for risk at different points in the continuum of perinatal care can offer fascinating insights. When adjustment for risk is made using only gestation or birthweight, comparisons of outcome take no account of information after birth. More accurate adjustment for risk can be made using CRIB,1-3 1-5which takes account of events up to 12 hours after birth. In unpublished data, risk adjusted hospital mortality was compared in very low birthweight or preterm infants admitted to neonatal units in the UK and a developing country. Mortality was twice as high in the developing country after adjusting for risk using birthweight, but similar after adjusting for risk using CRIB. One explanation is that provision of antenatal or immediate neonatal care was worse in the developing country, but that neonatal care from up to 12 hours after birth was equally effective. (Tarnow-Mordi WO, Gould C, Parry GJ, et al, for International Neonatal Network. Risk adjusted league tables in neonatal intensive care. Proceedings of the First International Conference on the Scientific Basis of Health Services, London 1995).
It is interesting to speculate why the authors of the Berlin score found no fall in mortality after adjusting for risk on admission between 1978–87 and 1988–91, despite presumed advances in neonatal care. There was an improvement in acid base status and rectal temperature and in the rate of respiratory distress syndrome on admission over those periods. This could reflect improved antenatal care, more skilled resuscitation by trained neonatologists, or both, particularly if gestation or birthweight specific mortality fell in the second period. Otherwise the lack of improvement in mortality could imply that the samples were too small to show a difference, that there was no significant improvement in any aspect of management before or after admission, or that the score was not valid in adjusting for changes in risk over time. Table 3 shows that the decrease in respiratory distress syndrome accompanied an increase in artificial ventilation at admission between the two periods. Clearly, a more aggressive approach to starting ventilatory support before admission was adopted in the second period. An intriguing possibility is that the score underestimated the true level of risk associated with this aggressive approach. This may have masked a real improvement over time in risk adjusted outcome after admission.
What advances can we expect in the development of new neonatal scoring systems? Prognostically accurate measurements of illness severity as soon as possible after birth remain a priority, as the authors of the Berlin score have emphasised. One exciting new measure of illness severity in the newborn which merits serious consideration is blood lactate, which seems a better indicator of tissue perfusion and prognosis than either pH or base excess.1-6 The more neonatal units which invest in equipment to measure blood lactate routinely, the sooner it will be feasible to test its prognostic value in new neonatal scoring systems.
Acknowledgments
I thank Martin Ward Platt, Michael Weindling and members of the UK Neonatal Staffing Study Steering Group for helpful suggestions.