Article Text

Abstract
Objective To determine whether improvements in school age outcomes had occurred between two cohorts of births at 22–25 weeks of gestation to women residents in England in 1995 and 2006.
Design Longitudinal national cohort studies.
Setting School-based or home-based assessments at 11 years of age.
Participants EPICure2 cohort of births at 22–26 weeks of gestation in England during 2006: a sample of 200 of 1031 survivors were evaluated; outcomes for 112 children born at 22–25 weeks of gestation were compared with those of 176 born in England during 1995 from the EPICure cohort. Classroom controls for each group acted as a reference population.
Main outcome measures Standardised measures of cognition and academic attainment were combined with parent report of other impairments to estimate overall neurodevelopmental status.
Results At 11 years in EPICure2, 18% had severe and 20% moderate impairments. Comparing births at 22–25 weeks in EPICure2 (n=112), 26% had severe and 21% moderate impairment compared with 18% and 32%, respectively, in EPICure. After adjustment, the OR of moderate or severe neurodevelopmental impairment in 2006 compared with 1995 was 0.76 (95% CI 0.45 to 1.31, p=0.32). IQ scores were similar in 1995 (mean 82.7, SD 18.4) and 2006 (81.4, SD 19.2), adjusted difference in mean z-scores 0.2 SD (95% CI −0.2 to 0.6), as were attainment test scores. The use of multiple imputation did not alter these findings.
Conclusion Improvements in care and survival between 1995 and 2006 are not paralleled by improved cognitive or educational outcomes or a reduced rate of neurodevelopmental impairment.
- neonatology
- epidemiology
- neurology
- psychology
Data availability statement
Data are available upon reasonable request. Data are available subject to the EPICure Data Sharing Policy (http://www.epicure.ac.uk) and will be available as part of the RECAP preterm Cohort Platform (https://recap-preterm.eu).
Statistics from Altmetric.com
What is already known on this topic?
Survival following birth before 26 weeks of gestation has increased steadily since 1995 in the UK.
It is unclear whether long-term outcomes have changed.
Between 1995 and 2006, survival without impairment had increased and estimated developmental test scores had improved at 3 years of age.
What this study adds?
At 11 years of age in two national cohorts, the prevalence of neurodevelopmental impairment was unchanged.
Mean test scores for IQ and academic attainment were similar in both cohorts.
Improvements in survival between 1995 and 2006 were not paralleled by improved long-term outcomes.
Survival for babies born at extremely low gestational ages is continually increasing in the UK1 and in many other countries.2 3 Allied with this, there is an expectation that long-term outcomes will begin to improve. In our analysis of outcomes at 3 years of age for births of <25 weeks of gestation in England, we identified that between 1995 and 2006, there was an increase in survival without impairment for liveborn babies and an 8-point (0.5 SD) increase in developmental test scores, although the rates of severe impairments were unchanged.4 Recent studies indicate that the prevalence of impaired outcomes in both early5 and middle childhood6 remains unchanged, and that educational and cognitive outcomes may even have deteriorated for extremely preterm (EP)/extremely low birthweight children born in 2005 compared with those born in the 1990s, despite improved survival.6 7 Meta-analyses also indicate no improvement in cognitive outcomes for children born very preterm despite increasing survival.8
Predicting outcomes from infancy to middle childhood both in terms of categories of impairment9 and absolute scores10 remains relatively poor but is better from early school age,11 12 underscoring the need for longer-term assessment. In light of the suggestion of improved outcomes in our population at 3 years,4 we report neurodevelopmental and educational outcomes at 11 years for a sample of EP births in England during 2006 (the EPICure2 Study) and compare the prevalence of impairments between this group and those of the original EPICure Study of EP births in 1995.13 Based on the findings of our 3-year assessment, we hypothesised that we might see improved outcomes in middle childhood for EP babies born in 2006 compared with those born in 1995.
Method
Population
The EPICure2 Study comprised births at 26 completed weeks of gestation or lower in England during the calendar year of 2006.14 We undertook an evaluation of a sample of survivors at 11 years of age using similar methodology to that used in the 11-year follow-up of the EPICure study cohort.13 Of 1041 EP survivors to discharge, invitations to take part in the 11-year assessment were sent to parents of 482 children admitted for care in 17 of the 45 NICUs and their networked hospitals operating in 2006,15 based on study centres in London and Leicester, respectively. The original EPICure population investigated outcomes for all children born in the UK and Ireland over 10 months in 1995. For the purposes of this comparison, we restricted participants to those born to women residents in England at the time, comprising 176 of the 219 children examined at 11 years.
Study procedures
Similar consent and evaluation processes were used in each study13 (see online supplemental appendix).
Supplemental material
Assessment procedure
IQ was measured using the Kaufman Assessment Battery for Children (1995 cohort: first edition, 2006: second edition) and academic attainment using the Wechsler Individual Achievement Test, second edition (for details, see online supplemental appendix). Medical history was abstracted from parent-report questionnaires, including the Gross Motor Function Classification System (GMFCS)16 and the Manual Abilities Classification System (MACS).17 Impairments were categorised in the same manner in both cohorts. Severe impairment comprised any one or more of an IQ score of <−3 SD of controls, cerebral palsy with GMFCS or MACS levels 3–5, blindness or profound deafness; moderate impairment comprised any one or more of an IQ score of <−2 SD to −3 SD of controls, GMFCS or MACS level 2, visual impairment but not registered blind or wearing hearing aids but not with profound hearing loss. Children with less severe impairments or no functional limitations were categorised without or with mild impairment. The overall level of impairment was categorised by the most severe impairment for each child. Wechsler Inidividual Achievement Test – Second edition (WIAT-II) scores were categorised as impairments using the SD banded categories derived using contemporary controls. Socioeconomic status was determined by the Index of Multiple Deprivation (IMD) derived from small area indices of income, employment, education, health, crime, housing and the living environment. IMD values for the 1995 cohort at 11 years were estimated using 2007 IMD codes (https://www.gov.uk/government/collections/english-indices-of-deprivation).
Data processing
Data were entered and managed using the REDCap electronic data capture tool18 hosted at University College London, and data were transferred and combined with the main EPICure Study dataset for analysis with STATA V.15.1 (www.stata.com). All analyses were carried out within the UCL Data Safe Haven or performed on anonymised data.
Analysis
Because we had sampled the EPICure2 population, and to account for missing data, we performed regression and multiple imputation19 as sensitivity analyses to account for selective dropouts and missing information at 11 years when estimating major outcomes in children who were not assessed by the research team. Missing data were imputed by chained equations using the STATA ‘MI’ procedure. Imputation model variables, percentages of missing values and models for predicting missing values are listed for both cohorts in online supplemental table S5. Imputation models were based on the missing at random assumption. Although five imputed datasets may be sufficient on theoretical grounds,20 a larger number may reduce sampling variability from the imputation process.21 Twenty imputed datasets were created for this analysis.
Results
Of the 482 invitees, families of 220 agreed to participate. Due to difficulties in scheduling assessments, we evaluated 200 of the 1031 EPICure2 children known to have been alive at 3 years at a mean age of 11.8 years (SD: 0.5 year). This represented a 41% response rate and the sample comprised 19% of the whole cohort; 112 were born ≤25 weeks of gestation and therefore were available to compare to outcomes from the 1995 cohort (figure 1). From the original EPICure cohort of 219 participants evaluated at 11 years, 176 were born to women residents in England, 75% of the original population and examined at 10.9 (0.5) years.
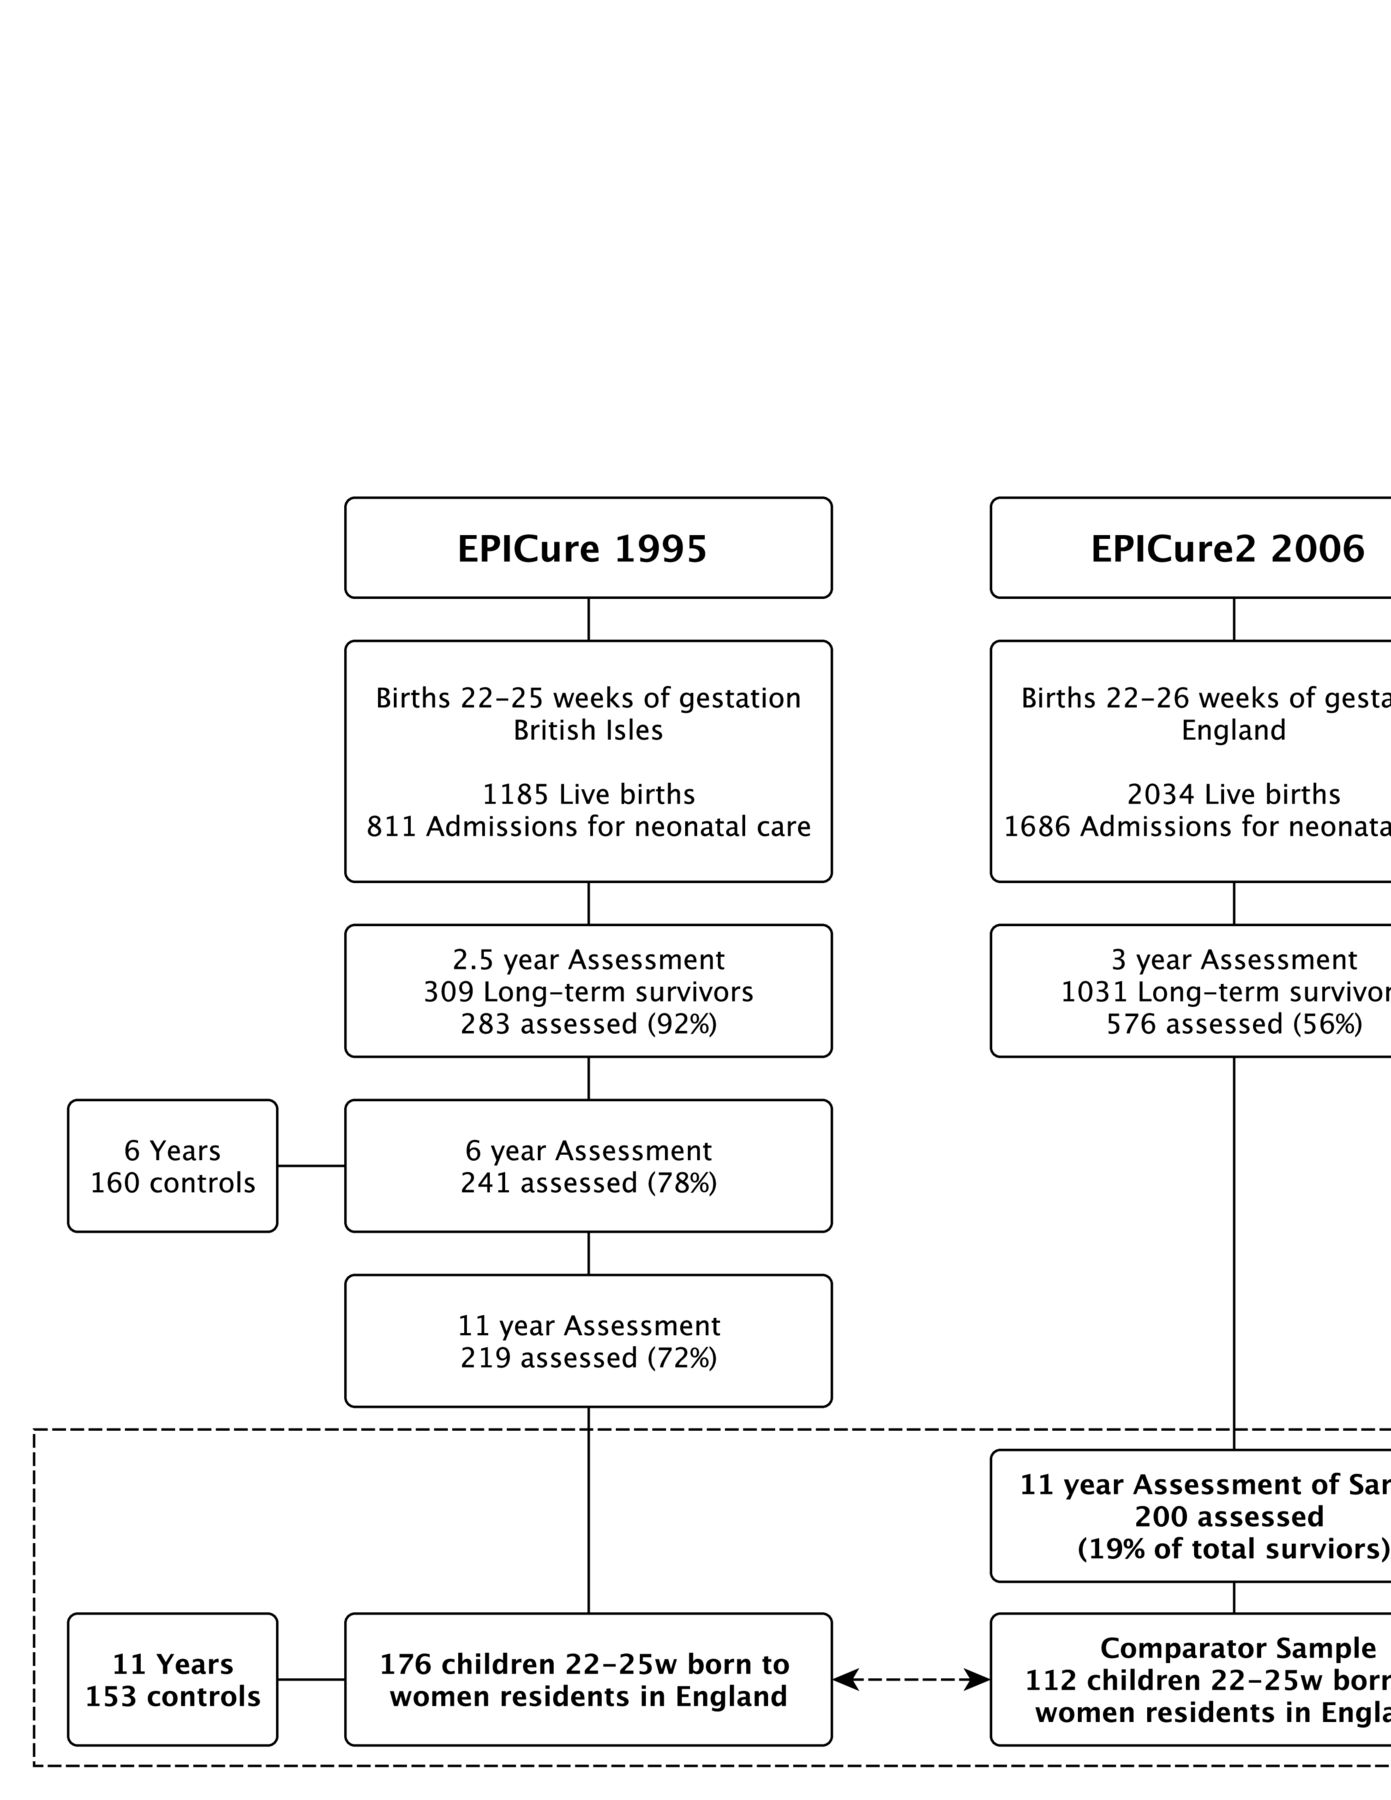
Derivation of the two samples of extremely preterm children at 11 years born in England in 1995 and 2006.
Evaluation of dropouts
Within each cohort, we compared the characteristics of dropouts with those assessed for births of ≤25 weeks of gestation to women residents in England. We observed only small differences between perinatal characteristics, maternal age and IMD for the whole sample of English births of ≤25 weeks of gestation and those evaluated in both cohorts (online supplemental table S1). In the 2006 cohort, the whole sample examined at 11 years, including those born at 26 weeks of gestation, was similar across a range of perinatal characteristics to the sample examined at 3 years of age.
Neurodevelopmental impairment
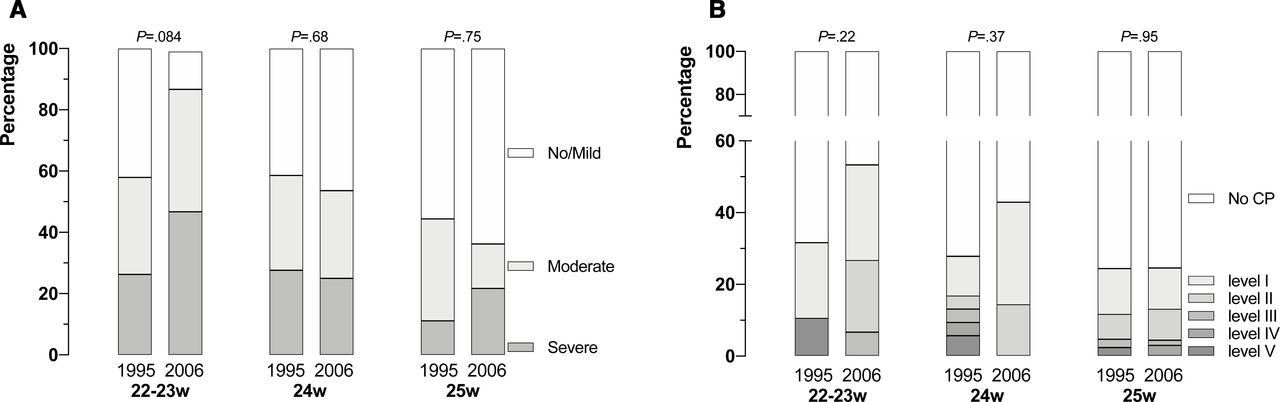
In EPICure2, including births at 26 weeks of gestation, 36 children (18%) had severe and 40 (20%) had moderate impairment as defined earlier. Among the subgroup of children born before 26 weeks, 26% had severe impairment, 21% moderate and 53% no/mild impairment (table 1 and figure 2A). This compared with 18%, 32% and 49%, respectively, of births in England in EPICure. The relative risk ratio (RRR) of severe impairment in EPICure2 compared with EPICure was 1.34 (95%CI 0.73 to 2.44) and for moderate impairment 0.62 (95%CI 0.35 to 1.11). After adjustment for gestational age, birth weight z-score, male sex, multiple birth, maternal age and IMD at 11 years of age, RRRs were essentially unchanged. Combining the moderate and severe categories, the adjusted odds of neurodevelopmental impairment were 0.76 (96% CI 0.45 to 1.31, p=0.32).

Prevalence of categorisation of overall impairment (A) and Gross Motor Function Classification System levels (B) by gestational age at birth at 11 years in the two EPICure cohorts born 22–25 weeks of gestation in 1995 and 2006, respectively. CP, cerebral palsy.
Categories of impairments among EPICure (1995) and EPICure2 (2006) cohorts of births at 22–25 weeks of gestation in England at 11 years of age
There were no significant differences in the frequency of motor or sensory impairments between the two cohorts, but there was a reduction in the proportion of children with moderate cognitive impairment in EPICure2 compared with EPICure, before and after adjustment for baseline characteristics and multiple testing. This was offset by an increase in children with severe impairment (table 1). Combining moderate and severe categories reduced these differences further. Considering the rates of impairment at each gestational week, there were no significant differences between the two cohorts, although there was a trend both towards higher rates of impairment (figure 2A) and higher prevalence of milder levels of functional motor impairment (figure 2B) at 23 weeks or below in EPICure2 (table 2 and online supplemental table S2).
Mean scores for IQ and academic attainment for the two EPICure cohorts at 11 years of births in England
Cognitive scores
Children in the control group had similar MPI scores in EPICure, using the KABC-I (mean 104, SD 11) to those in EPICure2 using the KABC-II (mean 103, SD 12; table 2), and these were similar between the cohorts at each gestational week (online supplemental table S3). Using control group data as a contemporary reference to calculate z-scores in each cohort, there was a 1.9 SD (95% CI 1.6 to 2.2) deficit for EP children versus controls in EPICure compared with a 1.8 SD (95% CI 1.4 to 2.1) deficit in EPICure2; the difference in means of MPI z-scores between the two cohorts was 0.1 (95%CI −0.3 to 0.5) points.
Academic attainment
In contrast to MPI scores, both the EP and control groups had higher WIAT-II reading and mathematics scores in EPICure2 compared with those in EPICure. However, using z-scores calculated from cohort-specific controls as the reference, we found there was a 1.5 SD (95% CI 1.9 to 1.2) deficit in reading scores for EP children in EPICure compared with a 1.3 SD deficit (95% CI 1.7 to 0.9) in EPICure2, giving an adjusted difference between cohorts in mean z-scores of 0.2 SD (95% CI −0.2 to 0.7, p=0.3). Results were similar for mathematics with an adjusted difference of 0.3 SD (95% CI 0.0 to 0.7, p=0.06) (table 2 and online supplemental table S4).
Overall, there were no significant differences in the proportion of children with impaired reading or mathematics scores (p=0.13 and p=0.13, respectively), although there was a significantly reduced RRR for moderate reading impairment in EPICure2 compared with EPICure (0.32, 95% CI 0.11 to 0.93) after adjustment for baseline differences.
Results after multiple imputation
There were small changes in both overall impairment rates and in the prevalence of cognitive impairment (table 3). In particular, the frequency of severe impairment was increased in the 2006 cohort, but with a corresponding fall in the moderate category, such that there were no statistically significant differences in the prevalence of no impairment or mild impairment overall.
Comparison of outcomes at 11 years for babies born at 22–25 weeks’ gestation in England in the two EPICure cohorts: results of imputation and a sensitivity analysis including maternal age at delivery in the imputation model (see online supplemental table S8 for variables and missingness)
Discussion
We report outcome at 11 years of age for the EPICure2 cohort of EP births in England in 2006. Outcome for babies born before 27 weeks of gestation is still attended by a significant risk of neurodevelopmental impairments, both in terms of deficits in IQ and academic attainment, and in motor impairment or cerebral palsy.
In this analysis, we compared outcomes for babies born 22–25 weeks of gestation in two cohorts of births 11 years apart. The prevalence of impairment in reading in EPICure2 appeared lower relative to those of the original EPICure study of births in 1995 but relating cognitive and educational scores to those of contemporary controls led to the conclusion that there are few differences. Therefore, we concluded that there were no significant changes in the prevalence of neurodevelopmental impairments or academic attainment over 11 years, despite over a decade of improvements in neonatal care; this has to be set alongside the significant improvements we have seen in survival and that have continued since.
Comparing cohorts separated by 11 years has its challenges. The cognitive test used in the first cohort had been superseded necessitating use of the second edition of the test in the 2006 cohort. Differences in content between the two tests may have impacted on the results despite a similar theoretical construction. The same test of academic achievement was used in both cohorts, making these data directly comparable; however, scores had risen markedly in the 2006 cohort among both groups. This may be due to a phenomenon sometimes termed the Flynn effect,22 whereby standardised population scores drift upwards over time, making it necessary to continually reappraise standardisation data to produce contemporary normed scores. To counteract bias, we included standardised educational as well as cognitive tests to triangulate the differences observed and used contemporaneous classmate controls to examine deficits in both cohorts to account for any upward drift in test scores over time. Using these methods, we found few differences across standardised cognitive, reading or mathematics scores between the two cohorts. Both samples showed significant attrition, and it seems unlikely that this occurs at random. In EPICure2 at 3 years of age, there was a higher dropout of families with social disadvantage,4 as found in most studies,23 24 but the dropout analysis for both studies shows good matching on baseline characteristics. We used multiple imputation to account for other differences between the two populations but found essentially similar proportions with impairment in both cohorts.
Other studies have found little change between cohorts of EP or VP births over time. Most studies do not report outcomes in middle childhood, reporting instead infant outcomes using developmental tests. However, the Victorian Infant Collaborative Study reported outcomes from three cohorts of EP (<28 weeks of gestation)/ELBW infants born between 1991 and 2005 at 8 years of age and concluded that moderate/severe impairment had not changed over the three cohorts, in contrast to their infant data at 2 years.25 Their data suggested even poorer educational outcomes, executive functions and motor performance at 8 years of age in EP/ELBW children born in 2005 compared with those in the 1990s.7 26 Our data do not support this finding, instead identifying no discernible change in either IQ or academic attainment between EP children born <26 weeks of gestation in 2006 and 1995.
Among more mature preterm infants, a meta-regression identified 71 studies of school age outcomes for very preterm populations (<32 weeks of gestation) and found no association between birth year and cognitive outcomes.8 The authors suggested that the major contributory factor was differences in bronchopulmonary dysplasia rates between studies. It is interesting that the rate of use of supplemental oxygen at 36 weeks, the most commonly used definition for bronchopulmonary dysplasia was very similar in both the EPICure cohorts.4
We would have greater confidence if these national studies had achieved higher follow-up rates. Following large cohorts of children scattered across the country is expensive and fraught with difficulty. Routine clinical follow-up to 2 years remains patchy in the UK,27 despite being recommended for many years. Recent guidance recommends that routine outcome evaluation in the UK should include an IQ test at preschool age to provide a more robust measure for those born EP.28 An interesting option is to use nationally collected educational data which are considerably more consistent and complete and which have been shown to be associated with gestational age.29 These data may provide the opportunity to evaluate changing patterns of outcome robustly, as long as evaluation criteria remain the same.
Difficulties in study retention and corresponding small sample sizes also make it difficult to explore interactions and subgroup analyses, so it is possible that improvements are emerging among certain groups, but this is not affecting overall outcome. For example, it is possible that improvements in outcome have occurred among those from higher SES backgrounds with greater family resources, but such analyses are not possible in smaller datasets.
Despite major advances in improved organisation and delivery of neonatal care between 1995 and 2006, and in survival, this has not yet been paralleled by improved investment in developmental follow-up or in educational support.30 If improving neonatal care is not resulting in the gains in neurodevelopmental outcomes once expected, then perhaps it is time to look at improving the provision of longer-term developmental, parent and educational support31 32 as interventions to optimise long-term outcomes.
Data availability statement
Data are available upon reasonable request. Data are available subject to the EPICure Data Sharing Policy (http://www.epicure.ac.uk) and will be available as part of the RECAP preterm Cohort Platform (https://recap-preterm.eu).
Ethics statements
Ethics approval
Approval was granted by both the UCL Research Ethics Committee (reference: 10175/001) and University of Leicester Research Ethics Committee (ref: 10225); UCL sponsored the study.
Acknowledgments
We thank all the EPICure participants and families, our Participant Advisory Group and members of the EPICure research team not otherwise named. NM receives part funding from the Department of Health’s National Institute for Health Research Biomedical Research Centre’s funding scheme at UCLH/UCL.
Supplementary materials
Supplementary Data
This web only file has been produced by the BMJ Publishing Group from an electronic file supplied by the author(s) and has not been edited for content.
Footnotes
Contributors NM conceptualised and designed the study, obtained funding, drafted the first version of the manuscript and revised it for important intellectual content. YN conducted the statistical analyses and critically reviewed and revised the manuscript for intellectual content. RL, ES, JT, MB, JL and AF assisted in the design of study, collected the data, and reviewed and revised the manuscript for intellectual content. JRH, DW, SJ and JM, contributed to the conceptualisation and design of the study, and critically reviewed and revised the manuscript for intellectual content. All authors approved the final manuscript as submitted and agreed to be accountable for all aspects of the work.
Funding This study was supported by Medical Research Council (MR/N024869/1).
Competing interests All authors declare no financial relationships with any organisations that might have an interest in the submitted work in the previous three years and no other relationships or activities that could appear to have influenced the submitted work. NM declares consultancy fees from Novartis in the past 3 years outside this study; the other authors have no other relationships or activities that could appear to have influenced the submitted work.
Provenance and peer review Not commissioned; externally peer reviewed.
Supplemental material This content has been supplied by the author(s). It has not been vetted by BMJ Publishing Group Limited (BMJ) and may not have been peer-reviewed. Any opinions or recommendations discussed are solely those of the author(s) and are not endorsed by BMJ. BMJ disclaims all liability and responsibility arising from any reliance placed on the content. Where the content includes any translated material, BMJ does not warrant the accuracy and reliability of the translations (including but not limited to local regulations, clinical guidelines, terminology, drug names and drug dosages), and is not responsible for any error and/or omissions arising from translation and adaptation or otherwise.