Article Text

Abstract
Objective: To validate Clinical Risk Index for Babies (CRIB) and CRIB II mortality prediction scores in a UK population of infants born at ⩽32 weeks’ gestation, and investigate CRIB II calculated without admission temperature.
Methods: Infants born at 22–32 weeks’ gestation to mothers resident in a UK region in 2005–2006 admitted for neonatal care were identified. Predictive probabilities for mortality were calculated using CRIB, CRIB II and CRIB II without admission temperature (CRIB II(-T)) using published algorithms and after recalibration.
Predictive performance was investigated overall and for groups defined by gestation and admission temperature and summarised by area under receiver-operating curve, Cox’s regression, Brier scores and Spiegelhalter’s z-scores.
Results: 3268 infants were included: 317 (9.7%) died before discharge. Using published algorithms each score showed excellent discrimination (area under the curve = 0.92). The total number of deaths was predicted well for CRIB (324.4) but for both versions of CRIB II the number of deaths was underpredicted (255.2 and 216.6). All scores performed poorly for subgroups.
After recalibration CRIB II displayed excellent predictive characteristics overall (Spiegelhalter’s z-score p = 0.52) and in the gestation groups (p = 0.44 and 0.57) but not for the temperature groups (p = 0.026 and 0.97). CRIB II(-T) displayed excellent predictive characteristics for all groups: overall p = 0.53; gestation groups p = 0.64 and 0.42; temperature groups p = 0.42 and 0.66.
Conclusions: The published algorithm for CRIB II was poorly calibrated but simple linear recalibration provided good results. The CRIB II score without admission temperature showed good predictive characteristics once recalibrated and this version of the score should be used when benchmarking mortality in neonatal intensive care units.
Statistics from Altmetric.com
In-hospital mortality among very preterm infants is often used to benchmark the care provided by neonatal intensive care units (NICUs).1 It is known that the comparison of crude mortality rates can be misleading, and that the use of risk-adjustment scores allows like-for-like comparisons to be made, both between units and over time. The Clinical Risk Index for Babies (CRIB) score has been widely used to quantify the risk of mortality among very preterm infants.2 In 2003 the score was updated and simplified with the publication of CRIB II.3 The update was to both recalibrate the score to take into account advances in neonatal care and to remove the fraction of inspired oxygen (FIO2) as one of the components. FIO2 was excluded since, to allow true comparisons of the quality of care, risk-adjustment scores must not include variables which can themselves be influenced by the care given. However, one component of CRIB II (temperature at admission) can also be influenced by early neonatal care.4
What this study adds
A simple recalibration of Clinical Risk Index for Babies (CRIB) II, both with and without temperature at admission, produces well-calibrated predicted probabilities for in-unit mortality.
A recalibrated version of CRIB II without temperature at admission should be used to benchmark mortality in neonatal intensive care units.
External validation of predictive scores is important as scores often do not perform as well on new data as on the data used to develop the score.5 For a score to be useful it should demonstrate both good calibration and good discrimination properties. These properties should hold for important subgroups of observations as well as the whole population.6 Two studies from Italy have reported comparable discrimination from CRIB and CRIB II scores7 8 but the calibration of the scores has not been examined.
The aim of this study was to validate and compare the performance of CRIB and CRIB II in predicting mortality for very preterm babies admitted for neonatal care in a geographically defined UK population, and to investigate the performance of CRIB II calculated without temperature at admission.
Methods
Data
The Neonatal Survey (TNS) is a population-based survey of neonatal intensive care based in the East Midlands and Yorkshire Regions of the UK.9 The survey covers a population of >8 million and around 110 000 births each year. All 30 NICUs contribute to the survey and units adjacent to the area permit data collection on relevant infants. The data are collected by nine part-time research nurses who visit each of the neonatal units on a regular basis and complete a standardised dataset about each infant.
All admissions for births in 2005 and 2006 at 22+0 to 32+6 weeks’ gestation to mothers resident in the survey area were identified. Infants were excluded if their final live discharge recorded by the survey was somewhere other than home (eg, general paediatric ward, surgical ward). Deaths due to congenital malformation were also excluded.
Measures of model performance
Three versions of the CRIB score were calculated: CRIB, CRIB II and CRIB II without temperature at admission (CRIB II(−T)). The predicted probability of death (p) was calculated for each of the scores using the published prediction algorithms3 10:
logit(p) = −4.070+0.445×CRIB
logit(p) = −6.476+0.450×CRIB II
logit(p) = −6.476+0.450×CRIB II(−T)
Since no prediction algorithm had previously been published for CRIB II without temperature at admission (CRIB II(−T)) the values for the coefficients reported for the full CRIB II were used. It was recognised that these predictions using CRIB II(−T) were, therefore, likely to be poor.
There is no single statistic that will fully quantify the predictive performance of a model. Therefore, different measures are reported which investigate different aspects of the model.
The overall predictive performance of the scores was assessed by the Brier (or mean probability) score11:

where xi represents the observed outcome, pi represents predicted probability for baby i and n is the total number of babies. A low value for the score shows close agreement between the observed and predicted outcomes. Differences between Brier scores were tested using the method of Redelmeier et al.12 The compatibility of the predictions with the observed outcomes was investigated by Spiegelhalter’s test statistic,13 with a p value of <0.05 taken as evidence of poor prediction.
The discriminatory performance of the scores was quantified by the area under the receiver-operating curve (AUC), equivalent to the concordance index. This value represents the probability of a randomly selected death having a higher predicted probability of death than a randomly selected baby discharged alive; 0.5 represents a discriminatory performance no better than chance alone, whereas 1 shows prefect discrimination. A value >0.8 is usually seen as representing excellent discrimination.14 The differences in the value of AUC were tested for statistical significance.15
The calibration of the scores, that is, its performance in assigning the correct probability to events, was investigated using Cox’s calibration regression.16 For Cox’s calibration regression the following model is used:
observed log odds = α+β×predicted log odds
The value of parameter α represents the overall calibration of the model if β = 1 and the calibration at a prediction of 0.5 if β≠1. The value of β represents the variability of the predicted probabilities. Three significance tests are performed: α = 0 and β = 1 representing perfect prediction; α = 0 conditional on β = 1 representing perfect calibration; β = 1 conditional on the estimated value of α (ie, β = 1|α) representing the correct degree of variation.
The Brier score can be partitioned to investigate the predictive performance of a severity score in more detail.13 17 Calibration-in-the-large quantifies whether the overall number of predicted events matches that observed and calibration-in-the-small measures the tendency for the predicted probabilities to match the observed rates across strata of risk. In both instances a reduction in their values represents an improvement in calibration. Calibration-in-the-small was presented visually by plotting the observed proportion of deaths against the predicted proportion for groups of observations categorised by predicted probability of death. Any departure from a 45° slope indicates suboptimal calibration.
The three scores were first investigated using all of the data. Next, the performance of each score across gestational age was examined by looking at two groups based on gestational age at birth: ⩽27 completed weeks and ⩾28 completed weeks.
Recalibrated models
If a predictive model is found to be poorly calibrated, simple updating of the predictive probabilities is recommended.18 This was achieved by specifying the score as the only covariate in a logistic regression model and using the TNS data to re-estimate the slope and intercept of the predictive algorithm. The predicted probabilities from these models were then investigated as described above. By definition, Cox’s calibration methods and calibration-in-the-large will indicate perfect calibration for the whole dataset, but performance in the subgroups may be examined for all indicators.
Temperature at admission
Excluding temperature at admission from CRIB II may produce poor estimates in particular for those with non-optimal temperatures. Using the recalibrated scores the predictive performance of CRIB II and CRIB II(−T) was investigated by looking separately at the predictive probabilities for those infants with temperature at admission within the range of optimum temperature as defined by CRIB II (36.1°C–37.5°C), and those with a temperature outside of this range.
Statistical software
Stata V.9.2 was used to estimate the Brier score and its partitioning and the SAS software V.9.1 was used for all other analyses.
Ethics committee approval
The Neonatal Survey has multicentre research and Patient Information Advisory Group (Section 60 of the Health and Social Care Act, 2001) approvals in place.
Results
Data
In total, 3542 infants were identified. One hundred and forty-three (4%) infants had a final recorded discharge other than to home and were excluded. A further 37 infants with lethal congenital malformations and 94 with no admission temperature recorded were excluded. Therefore, 3268 infants were included in the analyses, of whom 317 (9.7%) died before discharge.
Published algorithms
All three scores showed outstanding discrimination when applied to the whole cohort: AUC = 0.92 (table 1). When the data were analysed by gestational age group the scores still showed excellent discrimination: AUC = 0.80–0.83. There was no evidence of any underlying differences in the values of AUC between the three scores (p>0.1).
Discrimination and calibration statistics from published predicted probability algorithms
For the whole cohort the original CRIB score showed good calibration by all measures while both CRIB II and CRIB II(−T) showed evidence of poor calibration (Spiegelhalter’s z-score and Cox’s calibration regression: table 1) with the scores underpredicting the number of observed deaths. However, when the data were investigated by gestational age group, all of the scores showed evidence of poor calibration, with the exception of CRIB II for the 28–32 weeks group. For the whole cohort and the 22–27 weeks group there was evidence of a statistically significantly higher Brier score for CRIB II(−T) than for either of the other two scores (p<0.01 in both cases). This difference was not seen for the 28–32 weeks group.
Recalibrated scores
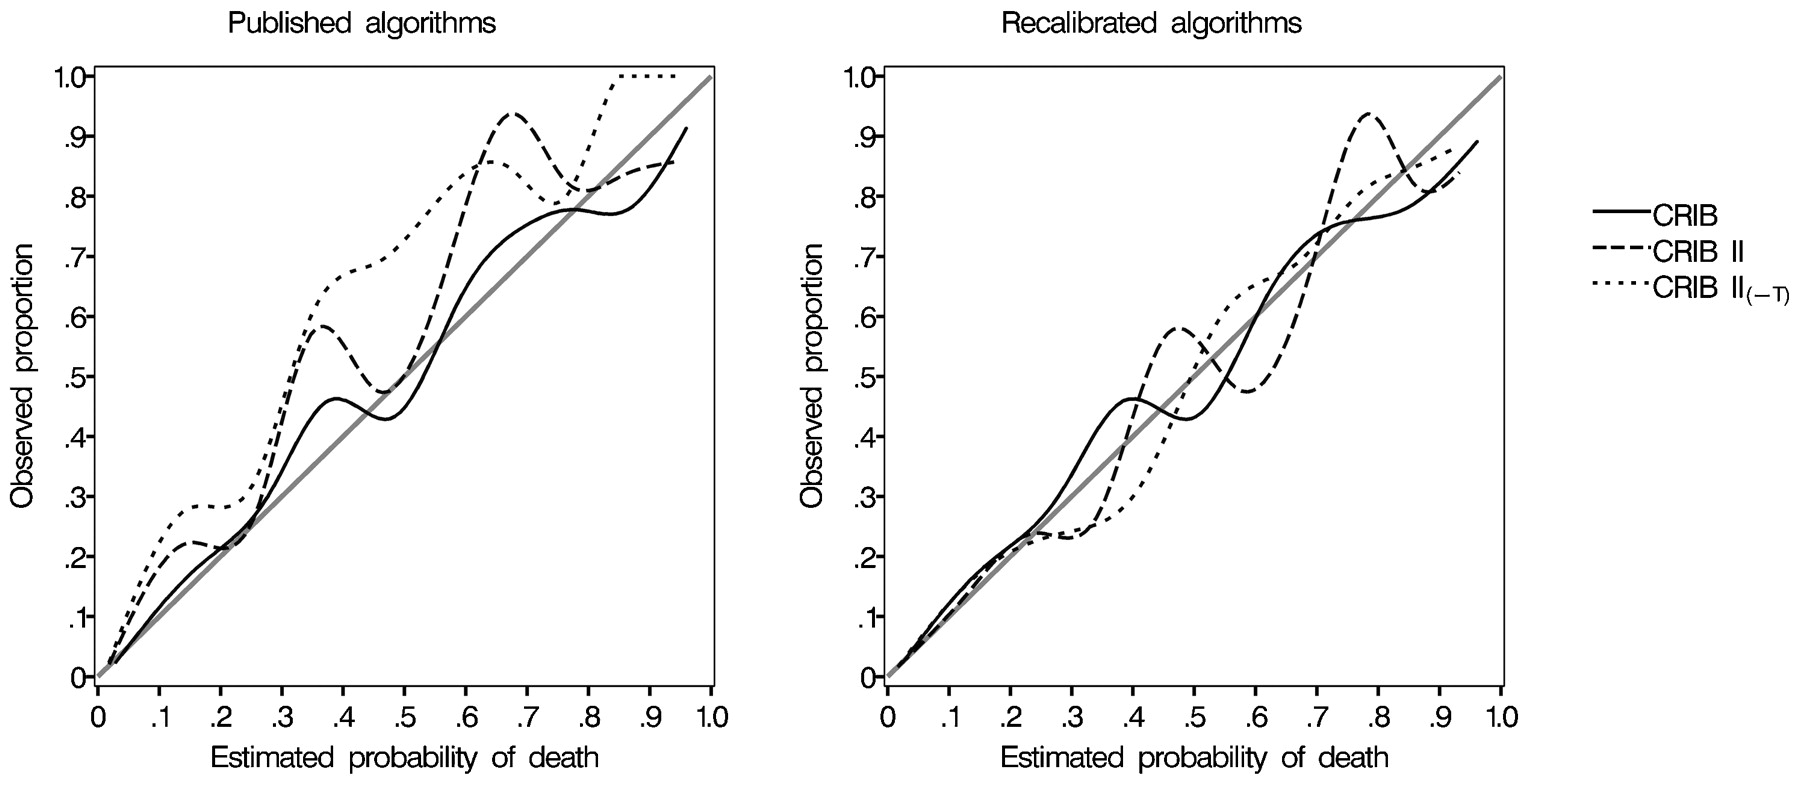
Following recalibration, all of the scores displayed excellent calibration for the whole cohort (table 2 and fig 1). The recalibrated algorithms were:
Calibration plots by decile of predicted probability of death for each of the three scores using the published and recalibrated algorithms. CRIB, Clinical Risk Index for Babies; CRIB II(−T), CRIB II without temperature at admission.
Discrimination and calibration statistics from recalibrated predicted probability algorithms
logit(p) = −4.302+0.479×CRIB
logit(p) = −6.524+0.488×CRIB II
logit(p) = −6.616+0.523×CRIB II(T)
When investigated by gestational age group CRIB showed evidence of poor calibration by all measures, underpredicting the number of deaths among those infants 22–27 weeks’ gestation at birth and overpredicting for the 28–32-week infants (table 2). CRIB II and CRIB II(−T) continued to be well calibrated in both groups. There was no evidence of any differences in the Brier score between any of the predictive algorithms (p>0.1).
Temperature at admission
In total, 2289 (70%) infants had a temperature at admission between 36.1°C and 37.5°C, the range considered optimum by CRIB II. CRIB II underpredicted the number of deaths in those infants with temperatures within the “optimum” range (141.3 vs 167) and overpredicted for those with temperatures outside that range (175.7 vs 150) (table 3). This was also evident from Cox’s calibration regression: test α = 0, β = 1: p = 0.021 and p = 0.011. CRIB II(−T) showed no evidence of poor calibration.
Discrimination and calibration statistics from recalibrated predicted probability algorithms
Discussion
It is important that clinical risk scores demonstrate both good discrimination and calibration in data beyond those used to develop the score. In particular, good calibration means that the probability assigned to a group of babies accurately predicts their eventual outcomes. This is important when, for example, using the score to identify babies for interventions or for inclusion into a clinical trial.
All three scores showed excellent discrimination as measured by the AUC. As recalibration does not alter the discriminatory performance of a score, this still held after recalibration.
However, all of the scores showed poor calibration using the published algorithms. The good calibration shown by the published original CRIB score for the whole dataset was not evident when the data were inspected by gestational age group.
It was unsurprising that CRIB II(−T) underpredicted the number of deaths when applying the published algorithm parameter estimates for the full CRIB II score. Extreme admission temperatures always add positive points to CRIB II so for any infant its value for CRIB II(−T) will always be less than or equal to that of CRIB II. It is less clear why using the full CRIB II score produced an underestimate of the number of deaths. This may be due to different inclusion and exclusion criteria between the sample used to develop the score and that investigated in this study or to differences in definitions and recording.19 After excluding “deaths that might not be reasonably attributed to care in the neonatal unit”,3 7.9% of the sample used to develop CRIB II died before discharge, less than the 9.7% seen in this cohort. There are a number of potential explanations for this difference. CRIB II was derived from babies born in 1998 and 1999. In the interim, an increasing number of high-risk infants are being admitted for neonatal care but this change is unlikely to have been captured by a score as simple as CRIB II. In addition, CRIB II was derived from a random sample of neonatal units rather than a geographically defined population. Selection bias and problems in appropriately including transferred babies may have introduced bias into their sample. It may be that babies in our study area had particularly poor outcomes due to poor neonatal care. However, this seems unlikely as CRIB II-adjusted outcomes across all 30 units (comprising the majority of four neonatal networks) are known to be consistent across the whole region. No information was available for babies whose last recorded transfer was to somewhere other than home but including them, as survivors, did not change any conclusions.
This study has shown that a simple recalibration of CRIB II and CRIB II(−T) produced predictive probabilities with good characteristics. This held when the cohort was split by gestational age. That CRIB II without temperature at admission performed better among those babies with abnormal temperatures was a surprising result. An association between admission temperature and poor outcome has been previously shown.20 21 This relationship was seen in the data here but disappeared after adjustment for the other variables. Admission temperature can be the result of poor neonatal care or reflect a prolonged resuscitation in a very sick baby; therefore its link to disease severity is complex. Hence it is plausible that temperature at admission is unrelated to in-unit mortality once the other variables are included in the model and that the relationship found by the score developers only arose by chance. Alternatively, the abnormal temperatures found in the TNS data could reflect simply poor attention to early thermoregulation rather than be a true measure of an infant’s morbidity.
Apart from the difference between the two versions of CRIB II in the groups defined by admission temperature, there is little evidence of differences in the predictive performance of CRIB II with and without admission temperature. Given uncertainty about any mechanism linking admission temperature to disease severity and death and the concern that admission temperature can be influenced by early neonatal care, it is recommended that it is not included when the score is used to benchmark neonatal care.
While both versions of the recalibrated CRIB II score appear to demonstrate good predictive performance in these data, their predictive performance should be investigated in other populations before any conclusions can be drawn on their wider applicability. Nevertheless, the tables presented here should provide the basis for further comparisons.
Maximum base excess in the first hour is included in all of the models investigated in this paper. This too can be influenced by early neonatal care and, therefore, might also be considered unsuitable for inclusion in predictive models. However, the potential for maximum base excess to be influenced by early care is more limited and hence it was felt it should remain in the model.
Conclusions
The CRIB score with or without the component for temperature at admission shows good predictive characteristics once recalibrated to new data. This version of the score without admission temperature should be used when benchmarking mortality in NICUs.
Acknowledgments
We acknowledge the continuing help and collaboration of the hospitals delivering perinatal care in the East Midlands and Yorkshire and adjacent regions.
REFERENCES
Footnotes
Funding The Neonatal Survey is one of the Infant Mortality and Morbidity Studies, which are funded by the Primary Care Trusts of the East Midlands and Yorkshire.
Competing interests None.
Provenance and Peer review Not commissioned; externally peer reviewed.
Ethics approval The Neonatal Survey has multicentre research and Patient Information Advisory Group (Section 60 of the Health and Social Care Act, 2001) approvals in place.
Linked Articles
- Fantoms