Article Text

Abstract
The mechanical characteristics of the ventilated lung can only be interpreted when the volume of the lung, the elastic properties, and the degree of airway obstruction have been accurately quantified by pulmonary function testing. More gentle ventilation strategies (permissive hypercapnia) are used, and the efficacy of mechanical ventilation can be verified in the intensive care unit. Pulmonary function testing brings new insights, awareness, and applications, but its limitations need to be taken into account when interpreting the acquired data.
- lung function testing
- ventilation
- respiration
- PFT, pulmonary function test
- RDS, respiratory distress syndrome
- CLD, chronic lung disease
- ETT, endotracheal tube
- PEEP, positive end expiratory pressure
- Ptcco2, transcutaneous carbon dioxide tension
- Petco2, end tidal carbon dioxide tension
- Cdyn, dynamic compliance
- Re, dynamic resistance
- FRC, functional residual capacity
Statistics from Altmetric.com
- PFT, pulmonary function test
- RDS, respiratory distress syndrome
- CLD, chronic lung disease
- ETT, endotracheal tube
- PEEP, positive end expiratory pressure
- Ptcco2, transcutaneous carbon dioxide tension
- Petco2, end tidal carbon dioxide tension
- Cdyn, dynamic compliance
- Re, dynamic resistance
- FRC, functional residual capacity
Many advances have been made in pulmonary function testing during mechanical ventilation in infants and the techniques and equipment necessary are readily available for bedside ventilatory measurements. The complex interrelationship of lung volume, airway resistance, and lung tissue characteristics is summarised by the term viscoelastic properties of the lung. Currently, there is no “optimal” pulmonary function test (PFT) for bedside monitoring. Such a PFT would consist of a single minimally invasive procedure that would produce accurate data, and the technology should be sensitive enough to measure absolute values and detect important changes in variables being measured. Most of the sophisticated measurement techniques available are for research purposes; they are not clinically applicable and do not directly improve the care of the ventilated patient. This review explores the measurement techniques in ventilated infants and the routine use of PFT. Oxygen therapy and its monitoring are discussed in the article in this series by Kotecha and Allen.
“Most of the sophisticated measurement techniques available are for research purposes; they are not clinically applicable and do not directly improve the care of the ventilated patient.”
Before any PFT measurement, we need to know: (a) the clinical question; (b) how we can quantify the degree of a respiratory disorder; (c) how we can show the physiological effect of an intervention such as the administration of a bronchodilator or change in ventilation mode; (d) how we can monitor the evolution of lung disease; (f) whether we can predict outcome. In general there are three major groups of respiratory disorders requiring mechanical ventilation in the newborn infant:
-
respiratory distress syndrome (RDS) of the preterm infant with surfactant deficiency, which may progress to chronic lung disease (CLD);
-
the structurally abnormal lung as seen in infants with congenital diaphragmatic hernia and hypoplastic lungs;
-
acquired respiratory disease such as lung infection or meconium aspiration syndrome.
The changes in lung compliance and lung volume that occur after the administration of surfactant to infants with RDS have been described elsewhere.1,2 Several authors have attempted to predict the development of CLD following RDS using PFT measurements during mechanical ventilation.3 Expiratory resistance is increased in respiratory infections in which administration of aerosolised bronchodilators has been investigated. Only a few studies have shown a beneficial effect.4 However, it seems reasonable to administer a bronchodilator on a trial basis to individual patients with airway obstruction and measure the clinical response with PFT. These are some examples of successfully applied PFT in research. But can lung function testing be used clinically? For detailed technical descriptions of equipment and measurement procedures, we refer the reader to standard lung physiology textbooks.5
Some important concepts of infant lung physiology and lung function testing need to be discussed before we can use any specific test. Lung mechanics do not follow linear rules; the relation between airways and the tissue is known as the mechanical interdependence. As the lungs are inflated during mechanical ventilation, the airways distend because of their attachment to the collagen matrix of the lungs. Thus airway resistance decreases as the volume increases. In contrast, during mechanical ventilation, the resistance imposed by the tissues of the lungs and chest wall increases progressively during inspiration. Furthermore, the respiratory system exhibits frequency dependent behaviour. Improvement or deterioration in the clinical condition of a ventilated infant usually leads to adjustment of the ventilator settings. Such adjustments can mask the changes in lung mechanics, which are due to the underlying disease process. The presence of an endotracheal tube (ETT) further complicates the measurement of PFT. For instance, the size and length of the ETT add significantly to the overall airway resistance. Lung volumes measured through an ETT may be greater than during spontaneous breathing because of the airflow limitation during expiration leading to incomplete emptying and hence to intrinsic positive end expiratory pressure (PEEP). Leaks around the ETT also complicate measurements of respiratory mechanics. Applying gentle cricoid pressure usually abolishes small leaks.
TRANSCUTANEOUS (Ptcco2) AND END TIDAL (Petco2) CO2 MONITORING
Infants with RDS and developing CLD are quite often managed on a ventilator for several weeks. For optimal ventilatory management in the infant, blood gas analysis is the ideal but because of obvious restrictions (sample size for blood gas tensions), non-invasive measurement of Pco2 is useful in neonatal intensive care units. Changes in Pco2 are almost always due to alterations in alveolar ventilation. Ptcco2 gives a good estimate of the true arterial Pco2 if skin perfusion is satisfactory. However, Ptcco2 is limited only to monitoring and provides no direct information on lung function. Petco2 is best measured by inline infrared spectroscopy and can be used to evaluate respiratory pattern, ventilatory dead space, ETT placement, and mechanical ventilator failures. The dead space of the connectors must be reduced to less than 1 ml. An increase in Petco2 is usually associated with hypoventilation in relation to CO2 production, but may rarely be caused by a sudden change in cardiac output.6 A decrease in Petco2 may reflect an improvement in ventilation distribution, sudden pulmonary hypoperfusion, or an obstruction or disconnection of the ETT/ventilator. When the Petco2 is displayed against time (capnogram), the shape of the curve provides important information on physiological dead space. However, there are major limitations to Petco2: it deviates significantly from Paco2 in patients with severe pulmonary impairment and ventilation/perfusion mismatching or shunt.7 This can be estimated by measurement of the alveolar-arterial oxygen gradient. The Pao2/Pao2 ratio can be calculated at the bedside, with the formula which can be simplified to: 713 × Fio2−Pao2. Petco2 is a direct estimate of Paco2 (Petco2 = Paco2 ± 3.4 mm Hg) if the ratio between Pao2 and Pao2 is greater than 0.3.
A further specific feature of the Petco2 signal in infants is the distinct shape of the CO2 waveform (fig 1). The CO2 waveform has three phases (fig 1A). CO2 waveforms from a preterm infant and from a 6 month old infant are shown in fig 1B. The shallow upward sloping of phase III and the absence of a plateau in the preterm infant compared with the older infant are attributed to the longitudinal gas concentration gradients within the airway and to the interaction between gas convection and molecular diffusion, airway geometry, and diffusion of gas from blood. Age related changes in the slope of phase III may reflect growth of the alveolar airway cross section. The respiratory dead space is remarkably constant over age in ventilated healthy children, with a ratio of dead space to tidal volume of 0.25–0.29.8 The effective dead space of a ventilated infant is about 1–2 ml/kg, and the tidal volume 5–8 ml/kg.

(A) The CO2 waveform has three phases. Petco2 remains zero as gas from the anatomic dead space leaves the airway (phase I); it then rises sharply as alveolar gas mixes with dead space gas (phase II); as purely alveolar gas is exhaled, the curve levels (phase III). (B) The CO2 waveform from a small preterm infant (bold line) without an alveolar plateau (phase III), compared with that in a 6 month old infant (thin line) where the phase III is present.
What are the conclusions for bedside management? Permissive hypercapnia is a strategy for the management of patients receiving assisted ventilation in which relatively high levels of Pco2 (Pao2 < 7.5 kPa and pH > 7.2) are accepted to avoid high tidal volumes, and pulmonary overdistension to decrease lung injury.9 Only Ptcco2 qualifies for Paco2 monitoring in such circumstances because infants being treated with permissive hypercapnia are likely to have a low Pao2/Pao2 ratio.
MEASUREMENT OF TIDAL VOLUME, DYNAMIC COMPLIANCE, AND RESISTANCE
During the acute phase of a lung disease and treatment with surfactant lung volumes for example, compliance and resistance change rapidly, which may lead to overdistension of some parts of the lung and may be the cause of ventilator induced pneumothorax. It is important to monitor such rapid changes in the viscoelastic properties of the lung. Most sophisticated ventilators equipped with accurate flow meters measure tidal volumes. Ventilation strategy in neonatology is mainly based on the prevention of barotrauma (inspiratory pressure limitation). A different approach is the prevention of volutrauma (excessive inspiratory lung volume). The volume versus pressure issue is a semantic one, because transpulmonary pressure determines alveolar volume. A more scientific approach is to describe the relation between distending pressure and volume. Dynamic compliance (Cdyn) of the lung is defined as the change of volume per unit change in pressure measured during mechanical ventilation. Dynamic resistance (Re) is calculated accordingly with the pressure change per flow. Static compliance and resistance of the lung can be obtained by very slow inflation of the lung, a procedure that is not feasible in the sick patient. Re and Cdyn are best determined by multiple linear regression analysis of the breath by breath pressure, flow, and volume signal using a least squares fit of the equation of motion of the passive respiratory system.10 Newer types of ventilators provide a measurement of compliance and resistance, but most of them use the Mead-Whittenberg technique, which assumes that Re and Cdyn are constant throughout inspiration and expiration and bases its estimates of mechanics on only two points within the respiratory cycle. It must be emphasised that compliance is a function not only of the elastic properties of the lung but also of its volume. Therefore, its value varies with different volumes depending on the shape of the pressure-volume (PV) curve and on alteration of mechanical ventilation settings, including respiratory frequency and inspiratory and end expiratory pressure. The measurement of Re and Cdyn provides two pieces of important information: (a) the change in elastic properties of the lung—for example, after the application of surfactant; (b) it guides changes to the ventilator settings to avoid over-recruitment—that is, hyperinflation—of the lung with each ventilatory cycle if the patient is ventilated above the lower inflection point of the PV curve.
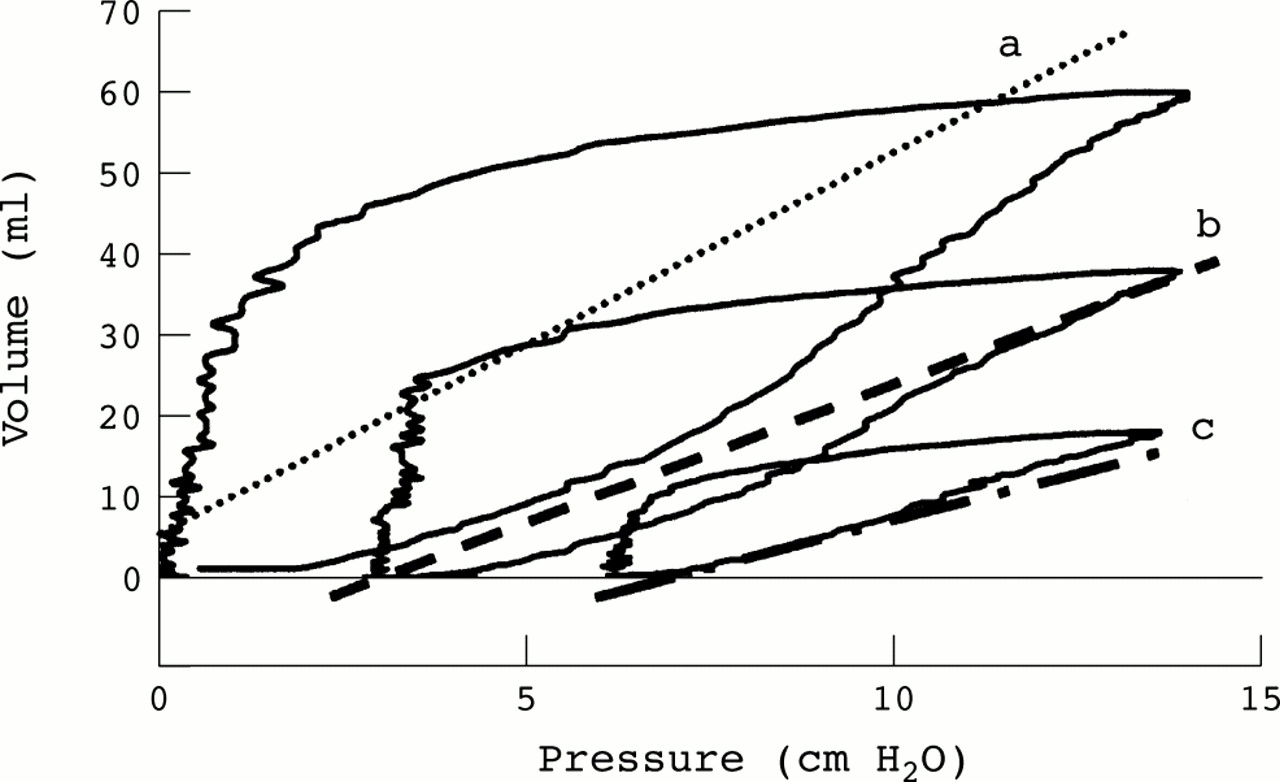
Figure 2 illustrates the effect on lung volume and lung mechanics of alterations in ventilator settings in a full term infant with normal lungs. The measured Cdyn increased and Re decreased as PEEP increased. This example illustrates that Cdyn is dependent on lung volume and should ideally be corrected for functional residual capacity. If the ventilator pressure settings remain unaltered and a large increase in lung volume occurs after treatment, with surfactant for example, the infant may be overventilated, and dynamic compliance may remain low because of the influence of the stiff, overdistended lung units. Increased PEEP may improve lung recruitment so that the recruitment interval (lower inflection point) disappears (fig 3). Unfortunately, there are no published normal values for Cdyn for healthy infants, but as a rule of thumb, the normal respiratory system compliance of an infant is about 1 ml/cm H2O/kg. The same care is required if resistance is measured during mechanical ventilation. Also, when a patient with some airway obstruction and hyperinflation is given a bronchodilator and subsequently decreases absolute lung volume, then improvements in airway calibre and therefore resistance resulting from treatment may be offset by an increase in resistance caused by the fall in lung volume.

Three different pressure-volume curves of an infant (3.2 kg) with normal lungs during mechanical ventilation are shown. Positive end expiratory pressure has been changed from 0 (curve a) to 3 (curve b) and to 6 cm H2O (curve c). Cdyn, Re, and functional residual capacity were: curve a, 4.4 ml/cm H2O, 0.031 cm H2O/ml/s, and 60 ml; curve b, 3.0 ml/cm H2O, 0.025 cm H2O/ml/s, and 81 ml; curve c, 2.0 ml/cm H2O, 0.021 cm H2O/ml/s, and 92 ml.

The pressure-volume curve of the same infant as in fig 2. When the lung is ventilated at 0 positive end expiratory pressure (PEEP) (A), a lower inflection point can be seen (crossing of line a and b). With increasing inspiratory pressure, the lungs are inflated and the pressure-volume relation becomes linear (line c). If PEEP is set to 6 (B), most of the inspiratory limb of the pressure-volume curve is linear.
Tidal volume, Re, and Cdyn are easily and quickly assessed in the intensive care unit. They provide useful information both for monitoring pulmonary function for ventilation strategies, such as permissive hypercapnia, and on the disease process, as long as their limitations are appreciated.
FUNCTIONAL RESIDUAL CAPACITY (FRC)
As discussed above, lung volume is an important variable, and, without its knowledge, lung mechanics such as Re and Cdyn are difficult to interpret. The empirical application of PEEP in diseased lungs is usually based only on clinical judgment such as blood gas analysis, chest expansion on x ray film, and pressure volume loops. Many studies11 have shown that, at higher levels of PEEP, FRC increases, areas of collapsed lung re-expand, and air trapping may be decreased. Higher PEEP levels may also change the mechanical properties of the already open lung units by increased distension and surfactant production as well as alteration of the time constant within these lung units. Pulmonary vascular resistance depends on FRC, and overdistension of the lung with increased PEEP may cause increased pulmonary vascular resistance and decreased cardiac output, resulting in decreased delivery of oxygen to peripheral tissues. The presence of severe collapse/consolidation may lead to overdistension of the relatively healthy parts of the lungs, if FRC is “normalised” with high PEEP. Currently, the volume at end expiratory level (FRC) is the only volume that can be accurately measured in infants during mechanical ventilation. FRC can be measured using a closed circuit helium (He) dilution technique, an open circuit nitrogen (N2) technique, or sulphur hexafluoride (SF6) washout. All three techniques can be used during both spontaneous breathing and mechanical ventilation. The helium dilution technique is not further described in this review because of its limited application at the bedside. The nitrogen washout technique is based on washing out the N2 from the lungs by increasing the Fio2 to 1. If the amount of N2 washed out is measured and the initial alveolar N2 concentration is known, then the lung volume from which point the washout started can be calculated.
Recently newer techniques using SF6 as a tracer gas have been developed.12,13 SF6 is an inert gas, which is fed into the inspiratory limb of the ventilator circuit. The concentration of SF6 is measured breath by breath using an infrared analyser or an ultrasonic flow meter (fig 4). The expired SF6 volume is calculated by integrating SF6 flow (area under the curve), and FRC is obtained by dividing the expired SF6 volume by the end tidal SF6 concentration before washout. The shape of an inert tracer gas washout provides important information on ventilation distribution (fig 4). In patients with lung disease, non-uniform ventilation results in a curved plot because different lung units have their tracer gas diluted at different rates. Thus, the well ventilated lung units cause a rapid fall in the tracer gas concentration whereas slowly ventilated air spaces are responsible for the long tail of the washout. There are numerous indices to describe such a washout curve, the most popular being the lung clearance index, the pulmonary clearance delay, and moment ratio analysis. A full description of these indices would exceed the intention of this review, but they are very useful for discrimination between normal and abnormal ventilation distribution.14–18

(A) An SF6 washout using an ultrasonic flow meter. (B) An SF6 washout of an infant with severe ventilation inhomogeneity. The SF6 concentration (log scale) is plotted against the number of breaths. There is an initial fast lung compartment (line a) followed by a slow emptying one (line b).
Which technique can be used for bedside ventilatory management? The N2 washout technique allows very accurate measurement of FRC but is limited to patients with Fio2 < 0.65.19 The N2 washout technique needs bulky equipment (two ventilators and a mass spectrometer) and is therefore not for the routine bedside use. Newer equipment using SF6 is now commercially available. The same equipment can be used in spontaneously breathing infants to measure lung volume and ventilation distribution. Lung volumes are of interest in lung hypoplasia and when PEEP needs to be adjusted in infants with lung disease. The measured FRC in spontaneously breathing healthy infants and children is in the range 16–22 ml/kg (mean 20.4 ml/kg).20 The values obtained for ventilated healthy children are up to 50% more than this.11.
SUMMARY
The mechanical characteristics of the ventilated lung can only be interpreted when the volume of the lung (FRC), the elastic properties (Cdyn), and the degree of airway obstruction (Re) are accurately quantified with pulmonary function testing. More gentle ventilation strategies (permissive hypercapnia) are used and the efficacy of mechanical ventilation can be verified by Ptcco2, Petco2, and the measurement of FRC, Cdyn, and Re in the intensive care unit. Pulmonary function testing brings new insights, awareness, and applications, but its limitations need to be taken into account when interpreting the acquired data.