Article Text

Abstract
Aims: To determine the refractive status and ocular dimensions of a cohort of children at age 10–12 years with birth weight below 1701 g, and also the relation between the neonatal ophthalmic findings and subsequent refractive state.
Methods: 293 low birthweight children who had been examined in the neonatal period were assessed at 10–12 years of age. The examination consisted of autorefraction, keratometry, and A-scan. Results of right eyes were compared with published normative data.
Results: 293 of the birth cohort of 572 children consented to participate. The average mean spherical equivalent (MSE) in the low birthweight cohort was +0.691 dioptre, significantly higher than the control data (+0.30D, p = 0.02). The average change in MSE over the 10–12 year period was −1.00 dioptre (n = 256), but only 62.1% of cases showed a shift in refractive error of the appropriate magnitude and direction. The presence of any retinopathy of prematurity (ROP) increases the risk of developing anisometropia sixfold.
Conclusions: Low birth weight and ROP both significantly impact the refractive state in the long term. At age 10–12 years children born preterm have an increased prevalence of all refractive errors. In low birthweight children refractive state is relatively stable over the first decade of life with a shift towards myopia of 1 dioptre.
- DC, dioptres cylinder
- DS, dioptres sphere
- MSE, mean spherical equivalent
- ROP, retinopathy of prematurity
- refractive error
- retinopathy of prematurity
- myopia
- low birth weight
- DC, dioptres cylinder
- DS, dioptres sphere
- MSE, mean spherical equivalent
- ROP, retinopathy of prematurity
- refractive error
- retinopathy of prematurity
- myopia
- low birth weight
Statistics from Altmetric.com
- DC, dioptres cylinder
- DS, dioptres sphere
- MSE, mean spherical equivalent
- ROP, retinopathy of prematurity
- refractive error
- retinopathy of prematurity
- myopia
- low birth weight
- DC, dioptres cylinder
- DS, dioptres sphere
- MSE, mean spherical equivalent
- ROP, retinopathy of prematurity
- refractive error
- retinopathy of prematurity
- myopia
- low birth weight
Ocular growth is associated with preterm birth resulting in an eye size and also refractive errors that are different from those in children born at full term. There is a significant increase in myopia in preterm children which has been linked to preterm birth and separately to retinopathy of prematurity (ROP)1–3 and its treatment.4–6 The increase in refractive errors is not confined to those with severe ROP,6 implicating different mechanisms for the development of refractive errors within the low birthweight population, such as arrested growth of the anterior segment.2,6,7
There are few reports on the prevalence of hypermetropia, anisometropia, and astigmatism8,9; only one longitudinal study which combines both measurement of refractive status and ocular components was found in the literature.9 Here we present a long term (10–12 years) follow up of children previously studied prospectively who were born in the East Midlands, England.10 In addition to the ophthalmic examinations during the neonatal period an examination was performed at 6 months corrected age which included cycloplegic retinoscopy.11 This cohort provides natural history data on low birthweight children with and without ROP as only one eye of one child was treated with cryotherapy.
The aims of this follow up study at 10–12 years were, firstly, to determine the refractive status and ocular dimensions of a cohort of 293 children whose birth weight was below 1701 g and, secondly, to analyse the relation between the neonatal ophthalmic findings and subsequent refractive state.
METHODS
Between 1 July 1985 and 31 May 1987, a prospective study of ROP was undertaken in the East Midlands.10,11 From the original cohort of 572 low birthweight infants (<1701 g), 458 were also assessed at 6 months corrected age. In addition, 293 consented to the follow up examination at age 10–12 years. In addition to these two research examinations many of the cohort had intervening ophthalmic care. There was no significant difference between the 293 children tested and the 279 children not tested but known to be alive in terms of the birth weight, gestational age, or severity of ROP (p>0.1 in all cases).
Ophthalmic investigations
The follow up examination at 10–12 years was carried out in a mobile vision laboratory at home or school. Refraction and keratometry of each eye were measured after instillation of cyclopentolate 1% when no pupil constriction to light could be demonstrated, using an hand held autorefractor and autokeratometer (Nikon Retinomax K-plus, Tokyo, Japan) which has been shown to be comparable with objective retinoscopy.12–14 Refractive state is calculated as the mean of eight readings. Measurements were repeated until the “confidence readings” reached the manufacturer’s recommendations of at least eight out of a possible 10 which ensured that the child had maintained good fixation. The Retinomax-K also calculates mean corneal curvature measurement along the horizontal and vertical meridia from eight readings. Refractive errors are defined by the mean spherical equivalent (MSE = sphere + ½ cylinder) as myopia (MSE <0.0D, < denotes a greater magnitude of myopia), hypermetropia (MSE >0.0D), high hypermetropia (MSE >+3.00D). Astigmatism is defined as ⩾1DC and anisometropia as ⩾1D difference in the MSE.
Ocular components were measured by A-mode ultrasound (Compuscan LT; Storz, St Louis, MO, USA). Other ophthalmic tests undertaken are reported elsewhere.15,16
Control data
The mean age of our cohort was 11.5 years; thus comparison was made with the published normative data, at age 11 years, for refractive state and ocular dimensions.17
Statistical methods
Right eye data only were used except for the analysis of anisometropia which requires analysis of both eyes. Statistical analyses were carried out with SPSS (version 10). The mean, standard deviation, percentages, and 95% confidence intervals of the MSE were calculated. The t test was used in the case of normally distributed variables and dichotomous variables. For non-normally distributed variables the Kruskal-Wallis test was performed. Relative risk analysis18 was carried out to determine which factors are risk factors for the development of refractive errors.
RESULTS
In the low birthweight cohort the average MSE was +0.67D (SD 1.62D) (n = 289 eyes) with the MSE ranging from +5.88 to −7.75D, with 19% (n = 55 eyes) being myopic and 6.6% (n = 19 eyes) with high hypermetropia. The published data of control children had a significantly lower MSE +0.30D (1.34D) (n = 129, t = 2.39, p = 0.02).17 A total of 64 (22 myopic, 42 hypermetropic) children in the low birthweight cohort had been prescribed spectacles as part of their clinical care; however, all analyses presented here are based on the cycloplegic refraction.
Results of refraction at 6 months were available for 258 of the children (n = 256 eyes) seen at 12 years. To study the change in MSE between 6 months and 11 years the 6 month measurements were subtracted from the measurement at follow up. On average there was a 1 dioptre sphere shift in the MSE towards myopia over the 10–12 year period (mean −0.948 dioptre, 95% CI −1.122 to −0.774). The MSE at 6 months was +1.68 dioptre (SD 1.41), 41.4% of eyes exhibited only plus or minus 0.75DS change, with 52.7% shifting 1 dioptre or more towards myopia and 5.8% shifting 1 dioptre or more towards hypermetropia. There was less change in the amount of astigmatism, where 75.1% remained within plus or minus 0.75DC of their original measurement at 6 months. However, simply studying the magnitude of the astigmatism may not reflect a change in astigmatism as the magnitude may remain the same but the direction may alter. Therefore, a vector analysis19 was performed to analyse the overall change in astigmatism. The mean (SD) of J0 and J45 were −0.04 (0.47) and −0.03 (0.39), respectively, demonstrating that on average there was little change in direction and amount of the astigmatism.
Studying the amount of change in the refractive state of the whole cohort can be misleading as emmetropisation occurs in both myopia and hypermetropia. Table 1 shows in total only 62.1% of eyes demonstrated a change towards emmetropia of the appropriate magnitude (numbers in bold in table 1). Of the five eyes that were myopic at 6 months the myopia reduced in only one case, with only one eye actually becoming hypermetropic. The majority of eyes (79.7%) were in the +0.25 to +3.00 range at 6 months and in 78.9% (n = 161) of these eyes there was a shift towards myopia; however, in 3.9% (n = 8) of cases the myopic shift was more than 3 dioptres, ranging up to 8.5DS of change. Of the 39 eyes that were above +3.00 at 6 months the hypermetropia increased in 20.5% (n = 8).
Number of eyes within each category of original power of sphere and the amount of change in the sphere
Birth weight and gestational age
There is a significant difference in gestational age between the classifications of refractive status (Kruskal-Wallis, p = 0.04). However, there was no significant association between birth weight and refractive status (Kruskal-Wallis, p = 0.3). Table 2 shows that the lowest mean birth weight was in the category of those with high myopia.
Birth weight and gestational age distribution according to refractive status
ROP
Owing to the small numbers of eyes with severe ROP (stage 3, 13; stage 4, 1), stages 3 and 4 are combined for the purposes of statistical analysis and classed as severe ROP. There is a significant difference (Kruskal-Wallis, p<0.001) in the MSE according to the different stages of ROP (no ROP = +0.71D, stage 1 = +0.85D, stage 2 = +1.07D, stage ¾ = −1.18D). Further analysis shows that only the severe ROP group are significantly different from those with no ROP, or mild ROP (stages 1 and 2). The box plot in figure 1 shows the change in MSE over the 10–12 year period, which is not significantly different according to the severity of ROP (Kruskal-Wallis, p = 0.4).

Change in mean spherical equivalent over 10 year period.
There were more myopic eyes associated with severe ROP (table 3) than no ROP, stage 1 or stage 2, and analysis shows this association to be significant (χ2trend = 42.9, p = <0.001) and remains after adjusting for birth weight and gestational age (likelihood ratio test, p = 0.0005).
Distribution of refractive errors by severity of ROP, n (% of stage of ROP)
Relative risk analysis
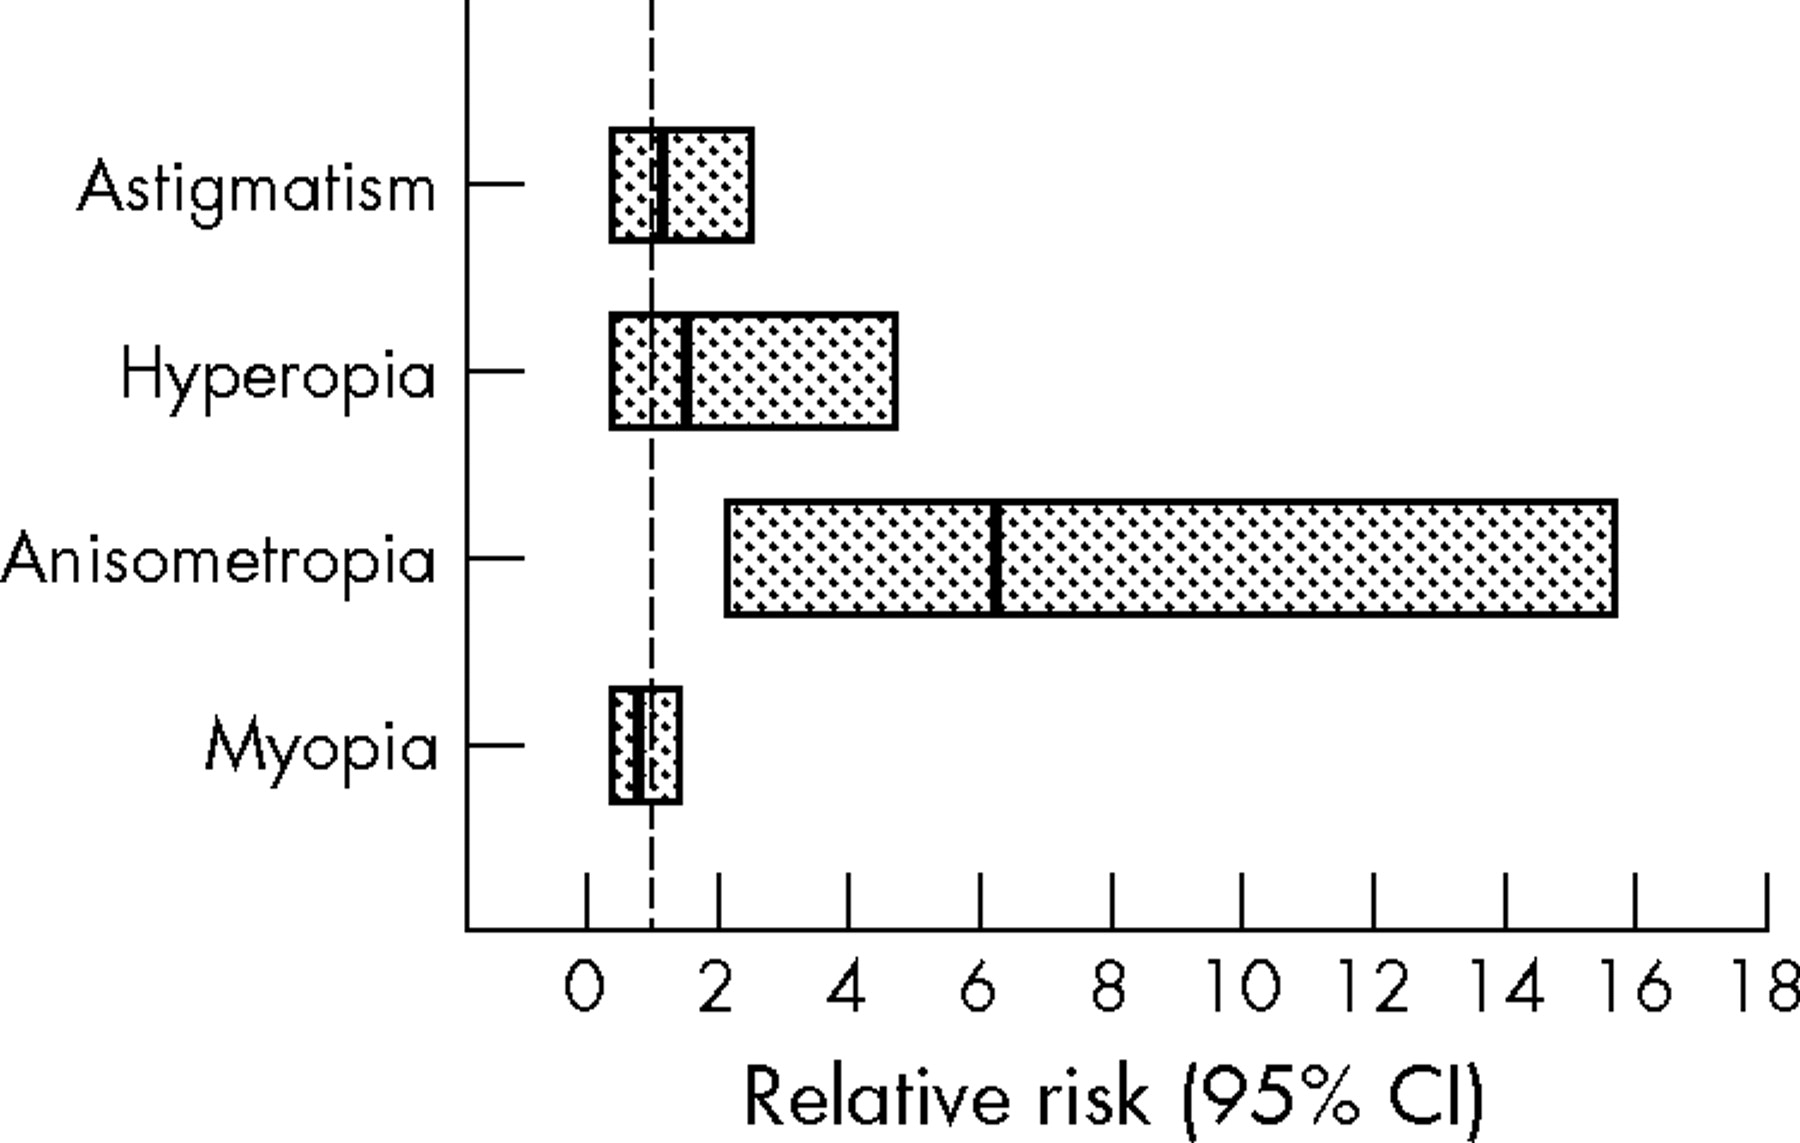
A relative risk analysis was performed to determine whether the presence of ROP of any severity is a risk factor for the development of refractive errors. Figure 2 illustrates that ROP of any stage increases the risk of anisometropia by sixfold but the risk of the development of myopia, hypermetropia and astigmatism is not affected by the presence of ROP within this low birthweight cohort. Further analysis showed that the presence of severe ROP did not increase the risk of the development of a refractive error.

Relative risk (line through box) and 95% confidence intervals (edges of the box) for the development of refractive errors. If the confidence interval includes 1 (crosses the broken line) it means ROP is not a significant risk factor for the development of that refractive error.
Ocular dimensions
Ocular components were measured in 236 children, in two eyes only the axial length could be measured, as one was a blind eye and the other was aphakic. Three children only allowed measurement of one eye and three eyes were not measured because of technical difficulties. Table 4 shows a significant difference in axial length between the groups (Kruskal Wallis, p<0.001) with the most myopic eyes having the longest axial lengths.
Ocular dimensions for eyes in study cohort (n = 236 children) compared to previously published normative values
There was no statistically significant relation between any ROP on the axial length (Kruskal-Wallis, p = 0.8) although those with severe ROP had the largest eyes (axial length: no ROP = 22.51 mm, stage 1 = 22.41 mm, stage 2 = 22.39 mm, stage 3/4 = 22.63 mm). In addition, there was no significant association between birth weight and axial length (Kruskal-Wallis, p = 0.1).
DISCUSSION
We have studied the refractive development of children at age 10–12 years who were born preterm, with birth weight less than 1701 g. The prevalences reported here of myopia (18.9%), high hypermetropia (6.6%), astigmatism (13.7%), and anisometropia (9%) are considerably higher than the data from Larsson et al’s9 control group of children born at term (myopia 11.1%, hypermetropia 0.9%, anisometropia 0.9%, and astigmatism 4.1%) using the same criteria. In addition, over the first decade of life there is a 1 dioptre shift towards myopia, and ROP increases the likelihood of developing anisometropia sixfold. The strength of this study is the detailed knowledge of ophthalmic status during the neonatal period, at 6 months corrected age and also at 10–12 years, permitting analysis across time and detailed comparison between those without and with ROP. An important limitation however is the small number of eyes with severe ROP and this small number may account for an absence of an association between severe ROP and with the development of any other refractive errors such as myopia.
Previous studies on children born prematurely have focused predominantly on the development of myopia,6,20–24 in particular myopia of prematurity.25 However, the refractive sequelae of preterm birth are not confined to this state, and increased rates of myopia, hypermetropia, astigmatism, and anisometropia have all been reported in epidemiological studies, although rates differ.9,26 These differences can be largely attributed to the difference in birthweight criteria and prevalence of severe ROP. In addition, our study was undertaken before the introduction of cryotherapy for ROP treatment, which has been reported to be associated with myopia.27,28 The most comparable studies are by Larsson et al9 and Holmstrom et al8 as the data were collected at the age of 10 years. The definition of clinically significant myopia in the Swedish study of Larsson et al9 was ⩽−1DS, and when this criterion was applied to our UK population the prevalence of myopia (12.6%) is still higher than in the Swedish cohort (7.0%).
There is a potential bias in this UK study as the response rate after 10–12 years was lower than anticipated. However, as previously discussed15,16 analysis showed that this sample appeared to be representative of the original cohort.
Another possible source of variation is that cycloplegic autorefraction, as opposed to retinoscopy, was performed in this study; however Cordonnier et al13 demonstrated that for the Retinomax the 95% limits of agreement were plus or minus 1 dioptre which were very similar to those obtained by retinoscopy. The Retinomax has been shown to have a slight positive bias14—that is, the measurement is slightly more positive compared to retinoscopy. This may be attributable to the automatic blurring mechanism designed to eliminate accommodation when used without cycloplegia. The effect on this study would be to show a slight reduction in the true prevalence of myopia; however, as a low defining criterion for myopia was used this bias would be minimised.
Irrespective of the potential bias in the prevalence rates of the refractive errors, as a result of the factors discussed, there still remains a large sample in which to study the change in refractive state over a 10–12 year period. Between the ages of 6 months and 10–12 years on average there was a shift towards myopia, which is to be expected as the eye grows and axial length increases17; however, 20.5% of the eyes became more hypermetropic and only one of the eyes that were myopic at 6 months corrected age became hypermetropic. The process of emmetropisation is linked to genetic29,30 and environmental factors.31,32 In addition, early visual acuity may also influence this process via a feedback mechanism that fine tunes eye growth. These issues cannot be addressed here because information of the family history of refractive errors was not collected, and it was not within the scope of this study to analyse environmental factors. However, there is a limited amount of data available of visual acuity measurements at 6 months corrected age (n = 65 eyes). Only seven eyes fall below the lower limit of the normal acuity range (as defined by Salomao et al33) but in all seven eyes, whether myopic or hypermetropic to begin with, there was a reduction over the 10 year period of the MSE—thus hypermetropia reduced and myopia increased. In the 58 eyes with initially normal acuity the MSE also reduced in 81.1% of eyes, again irrespective of initial refractive error. This suggests that a factor, or factors, associated with preterm birth have a greater impact in the process of emmetropisation than early acuity.
It has been suggested previously that preterm birth impacts on the process of emmetropisation2,4,34 through arrested development of the anterior segment,1,2,5,7 which has been speculated may be caused by a temperature deficit during the development of corneal growth4 or mechanical restriction as the result of biological stress caused by the retinopathy.7 Therefore, the anterior segment biometric characteristics found in our study of children at 10–12 years represent arrested development that impacted emmetropisation. This anterior segment developmental anomaly adversely affects growth of the eye as a whole and may account for the reduced axial length in the mild myopia group compared to children born at full term. In addition, the lack of association between the birth weight and eye size demonstrates that these are not just small eyes in small children but that there is a specific disturbance of ocular growth.
As expected there was an increase in myopia associated with severe ROP. Lue et al22 postulated either that after ROP the retina is rendered dysfunctional and therefore affects eye growth signals, or that ROP might halt or delay the normal migration of the photoreceptors from the fovea resulting in alterations of the microscopic topography of the central retina with a subsequent effect on acuity sufficient to alter the visually driven feedback mechanism in emmetropisation. However, neither theory accounts for the increase in myopia in children without ROP found in this cohort.
Also the relative risk analysis highlights that the presence of any ROP only increases the risk of developing anisometropia, which suggests that other factors or a combination of factors, relating to preterm birth exert a greater influence on the eye growth and subsequent refractive state. However, the finding that ROP increases the risk of developing anisometropia by a factor of 6 reinforces the need for continued assessment of the children with ROP.
In summary, the preterm child is at greater risk of the development of all types of refractive error and the disruption to the emmetropisation process appears to occur at an early age and result in long term changes to the eye growth.
REFERENCES
Footnotes
-
Permission for this study was obtained from Nottingham University Hospital Ethics Committee and informed consent was obtained from all parents.
Linked Articles
- BJO at a glance