Article Text

Abstract
Aims: To determine the body size of extremely low birth weight (ELBW, birth weight 500–999 g) subjects in early adulthood.
Methods: Cohort study examining the height and weight of 42 ELBW survivors free of cerebral palsy between birth and 20 years of age. Weight and height measurements were converted to Z (SD) scores.
Results: At birth the subjects had weight Z scores substantially below zero (mean birth weight Z score −0.90, 95% CI −1.25 to −0.54), and had been lighter than average at ages 2, 5, and 8 years. However, by 14, and again at 20 years of age their weight Z scores were not significantly different from zero. At ages 2, 5, 8, 14, and 20 years of age their height Z scores were significantly below zero. Their height at 20 years of age was, however, consistent with their parents’ height. As a group they were relatively heavy for their height and their mean body mass index (BMI) Z score was almost significantly different from zero (mean difference 0.42, 95% CI −0.02 to 0.84). Their mean BMI (kg/m2) was 24.0 (SD 5.2); 14 had a BMI >25, and four had a BMI >30.
Conclusions: Despite their early small size, by early adulthood the ELBW subjects had attained an average weight, and their height was consistent with their parents’ height. They were, however, relatively heavy for their height.
- height
- weight
- BMI
- growth
- infant
- extremely low birth weight
- BMI, body mass index
- CI, confidence interval
- ELBW, extremely low birth weight
- NBW, normal birth weight
- SD, standard deviation
Statistics from Altmetric.com
- BMI, body mass index
- CI, confidence interval
- ELBW, extremely low birth weight
- NBW, normal birth weight
- SD, standard deviation
Parents are often surprised at the small size of their extremely low birth weight (ELBW, birth weight 500–999 g) infant in the nursery. Consequently, one of their early concerns focuses on growth, especially once survival is more assured. Since many studies have reported that ELBW children as a group are underweight and shorter than expected in early childhood,1–4 it is not surprising that some slow growing ELBW survivors are investigated for growth failure, usually with negative results and no evidence of growth hormone deficiency.5 In early childhood, parents are not always reassured that their surviving ELBW child is growing adequately, albeit slowly, despite what often seems an adequate diet, and the absence of alternative causes for growth failure. Parents’ uncertainty is sometimes reinforced by health professionals who are trained to detect aberrations of growth, and also by friends and family who continually comment on the child’s small size, which can be interpreted negatively.
As survival rates for ELBW babies have increased dramatically over the past few decades with the advent of modern neonatal intensive care, growth of ELBW survivors is an increasing concern to the wider community. However, growth into adulthood of ELBW survivors from this era has not been described. The aim of this study was to determine the height and weight of ELBW subjects in early adulthood, and to describe how these measurements had changed throughout childhood.
METHODS
All subjects were born in the Royal Women’s Hospital, a tertiary referral hospital in Melbourne, Victoria. There were 60 ELBW survivors from 159 consecutive ELBW infants born during a four year period from 1 January 1977. Gestational age was determined predominantly from menstrual history, and confirmed, if possible, by ultrasound in early pregnancy. Birth weight was recorded to the nearest 10 g.
Subjects with cerebral palsy at 20 years of age were excluded. A research nurse measured the subject’s height and weight at 20 years of age. Age was corrected for prematurity to be consistent with earlier reports. The mean of three measurements of each growth variable was recorded at each age. Subjects were weighed with minimal clothing on a digital scale with an accuracy of 100 g. Height was measured with a Harpenden stadiometer according to standard guidelines, in either bare feet or wearing light socks, to an accuracy of 1 mm. Body mass index (BMI, kg/m2) was calculated. Pubertal development had been assessed at 14 years of age, by breast staging in females and testicular size in males, as reported elsewhere;6 all subjects had entered puberty by age 14. Parents’ heights had been measured previously during the study when they had attended with their child. In some cases where a parent did not attend, the other parent estimated their height; there were no substantial differences between estimated and measured parental heights, as previously reported.6 Z (standard deviation, SD) scores for the growth variables were computed relative to the British Growth Reference of 1990.7
Weight and height data from these children earlier in childhood, at ages 2, 5, 8, and 14 years, and birth weight data have been reported in part,6 and are included in the current study. The remaining subjects of birth weight <1500 g born between October 1980 and March 1982, and the normal birth weight control group with data up to age 14 years in that report6 had not reached the age of 20 years when the current ELBW cohort was measured.
Data were analysed using SPSS for Windows programs.8 To compare size relative to expectations at each age, data were analysed by single group t test relative to zero for Z score. Data were contrasted between groups by unpaired t test. Mean differences and their 95% confidence intervals (CI) were computed. The relation between subjects’ height Z scores and their mid-parental height Z score was determined by linear regression analysis. Probability values <0.05 were considered statistically significant.
The Research and Ethics Committees of the Royal Women’s Hospital approved this study and subjects gave written informed consent at 20 years of age.
RESULTS
Subjects
Of the 60 consecutive survivors to age 20, three could not be found, six refused further assessment, and two were living in other countries and were inaccessible. Of the 49 subjects assessed, five had cerebral palsy and were excluded; body size measurements were not obtained from two because they were seen away from the measuring equipment.
Of the 42 subjects with valid data at 20 years of age, their mean birth weight was 877 g (SD 86 g), mean gestational age was 27.4 (SD 2.0) completed weeks, 27 (64%) were female, and 8 (19%) were from multiple pregnancies. Their mean birth weight Z score was significantly below zero at −0.90 (95% CI −1.25 to −0.54); seven (17%) had birth weight Z scores <–2 SD.
All subjects were prepubertal up to 8 years of age. By 14 years of age all children had entered puberty and most children were advanced in pubertal development, the same as in normal birth weight subjects at that age.6 As most subjects had not been assessed between ages 8 and 14 years it was not possible to time the onset of puberty precisely. Subjects were assessed at a mean age of 20.3 (SD 1.0) years, corrected for prematurity.
Body size
Weight
At birth the subjects had weight Z scores substantially below zero (fig 1; mean birth weight Z score −0.90, SD 1.14). Mean weight Z scores remained significantly below zero in early childhood, but there was a gradual increase from age 2, and then a more marked increase between 8 and 14 years, by which time the weight Z scores were not significantly different from zero (fig 1). Compared with measurements earlier in childhood, the changes in weight Z scores between birth–2 years and 2–5 years were not statistically significant. There was, however, a significant increase in weight Z score between 5–8 (mean 0.20, 95% CI 0.02 to 0.38), and a larger significant increase between 8–14 (mean 0.75, 95% CI 0.50 to 1.01). There was no significant change between 14 and 20 years. At 20 years of age the mean weight Z score was 0.14 (SD 1.48), not significantly different from zero; two (5%) subjects had weight Z scores <–2 SD.

Subjects’ weight and height Z scores (mean and 95% CI) through to age 20. Sample size shown at the bottom.
Height
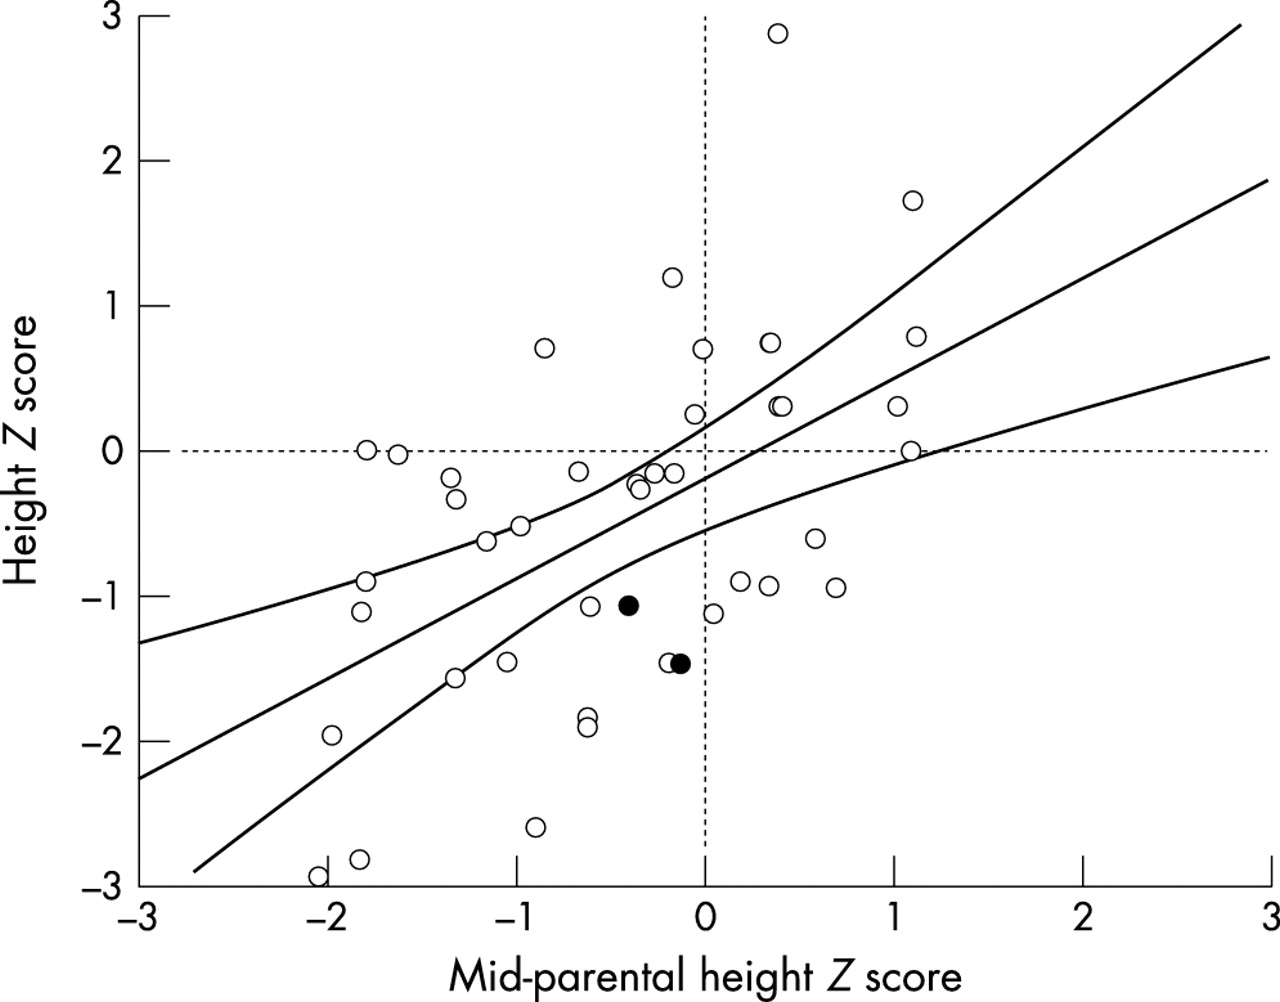
Height Z scores were significantly below zero at all ages, with a fairly constant height SDS through childhood, and some catch-up at puberty (fig 1). The only significant increase in height Z score was between ages 8–14 years (mean 0.35, 95% CI 0.16 to 0.54). At 20 years of age the mean height Z score was −0.52 (SD 1.18); four (9%) had height Z scores <–2 SD. Their height was, however, consistent with their parents whose mid-parental height Z score was also significantly below zero (mean mid-parental height Z score −0.44, 95% CI −0.73 to −0.16). The difference in height Z score between the subjects and their parents was not significantly different from zero (paired t test, t = 0.49, p = 0.63, mean difference in height Z score −0.08, 95% CI −0.40 to 0.24). The height Z scores of the ELBW subjects were strongly positively correlated with their parents’ mid-parental height Z scores (fig 2; β coefficient 0.784, SE 0.174, 29.5% of variance explained, p<0.0001). The mean height for the females was 161.0 (SD 7.4) cm, and for males was 172.3 (SD 7.7) cm.

Relation between subjects’ height Z scores at age 20 and their mid-parental height Z scores (mean and 95% CI for regression shown). The two subjects treated with growth hormone are shown as filled circles.
Body mass index
Since the increases in weight Z score were not generally matched by the same size increases in height Z score, there was a relative increase in fatness starting soon after infancy. As a group they were relatively heavy for their height, but their mean body mass index (BMI) Z score was not significantly different from zero (mean difference 0.42, 95% CI −0.02 to 0.84). Their mean BMI (kg/m2) was 24.0 (SD 5.2); 14 (33.3%) were overweight with a BMI >25, and four (9.5%) were obese with a BMI >30.
Two of the subjects had been investigated earlier in childhood for short stature and had been treated with synthetic growth hormone, although neither child had growth hormone deficiency.5 Before starting growth hormone therapy at age 12–13 years, their height Z scores were −2.40 and −2.75. At 20 years of age, by which time growth hormone therapy had long ceased, their height Z scores were −1.46 and −1.08. Excluding the children treated with growth hormone had negligible effects on the mean height and weight Z scores.
Of the seven subjects who had birth weight Z scores <–2 SD, at 20 years of age six had weight Z scores above −2 SD, and all seven had height Z scores above −2 SD.
DISCUSSION
We have previously described the changes in weight and height through to 14 years of ELBW children, where they exhibited relatively delayed catch-up growth compared with normal birth weight (NBW) controls.6 The biggest increments in weight and height Z scores occurred between 8 and 14 years, by which time they had achieved weight Z scores not substantially different from zero, and height Z scores consistent with their parents’ height Z scores. As they had not stopped growing at 14 years of age, we considered it essential to measure their weight and height again at 20 years of age, after which time any further increase in height would be minimal. We had speculated that they might have increased in height as adults even beyond their parental expectations, but this was not observed. Instead, the weight and height Z scores of the subjects were similar to what we had previously observed at 14 years of age. The average reduction of height Z scores of −0.5 SD relative to the standard population at 20 years of age represents only 3.5 cm for males and 3 cm for females, which some may consider to be a clinically unimportant difference.
Although the mean weight Z score was larger than mean height Z score, the BMI Z score was not significantly different from zero. However, one third of the cohort would be considered overweight (BMI >25), and almost 10% would be considered obese (BMI >30). The relative increase in BMI might predispose these ELBW survivors to diseases in later adult life, such as diabetes, hypertension, or cardiovascular disease. The relative increase in weight over height is not unique to ELBW subjects, however. At earlier ages we had a normal birth weight (birth weight >2499 g) comparison group who had been randomly selected at birth and whose growth had been measured at ages 2, 5, 8, and 14 years. At each age their weight Z score was greater than their height Z score. When last measured at 14 years of age the discrepancy was almost 0.5 SD,6 similar to the ELBW discrepancy at age 20.
There are no reports of body size of ELBW survivors in adulthood from the modern era of assisted ventilation. There are a few reports of growth beyond early childhood for complete ELBW cohorts.6,9–11 Hirata and Bosque9 described the outcome at 12–18 years of age of a cohort <1001 g birth weight cared for in one hospital over 10 years from 1972. It is difficult to generalise the results obtained by Hirata and Bosque9 as follow up was reported for only 31% (32/103) of children who had been measured at least once in early childhood, and there were presumably more survivors not measured at all. Since the age range was so wide (six years) during a time when growth changes so rapidly because of the influence of puberty, and there were no measures of pubertal development, the results are difficult to interpret.
Peralta-Carcelen and colleagues10 reported that 53 ELBW subjects at a mean age of 14.8 years were significantly shorter and lighter than NBW subjects. The 53 ELBW subjects in their study represented 57% of the 93 known survivors free of major disability born in the one hospital between 1978 and 1984; this is a lower proportion of subjects assessed than the 76% (42/55) of known survivors free of cerebral palsy in our study.
Saigal and colleagues11 reported the growth at 12–16 years of age of 154 of 169 (91%) children of birth weight <1001 g born in the Central-West region of Ontario, Canada. Their results were compared with 125 term controls. Mean Z scores for both height (−0.55) and weight (−0.35) were below zero for ELBW survivors, and were significantly lower than in NBW controls. As in our study, ELBW survivors showed significant catch-up growth between age 8 and adolescence. Growth of this cohort into adulthood has not been reported, however.
Our ELBW subjects seemed to catch up in growth relative to the growth reference mostly between age 8 and 14 years, as previously reported,6 reflecting the influence of puberty on growth as all had started puberty by that age. Our ELBW subjects were, however, significantly lighter and shorter than NBW subjects at 14 years of age, findings similar to Peralta-Carcelen and colleagues10 and Saigal and colleagues.11 In our ELBW subjects there were no further significant increments in Z scores between 14 and 20 years of age, and it is therefore possible that body size measurements at 14 years of age, relative to expectations for age and gender (that is, Z scores), are an accurate reflection of expected body size in early adulthood. However, this speculation should be confirmed with larger cohorts of ELBW children assessed in early adulthood.
Peralta-Carcelen and colleagues10 reported advanced bone ages in their ELBW subjects compared with controls and speculated that the ELBW group may not be as tall as adults as their height Z score at 14 years would suggest. Our study is not consistent with their speculation, however, as our subjects did not change height Z score between 14 and 20 years of age. We did not measure bone age in our subjects at any age, apart from a subgroup who were growing slowly earlier in childhood, in whom bone age was, on average, delayed.5
We recognise that the results from this ELBW cohort may not ultimately apply to ELBW infants in nurseries today. Nevertheless, in the absence of any other data on body size in adulthood, they represent the best estimates that can be provided to parents who currently want to know how big their tiny baby may become as an adult. Despite their small size at birth and their persistent small size in early childhood relative to NBW peers, by early adulthood our group of ELBW children has attained an average weight, and a height consistent with their parents’ height. Parents can be reassured that the majority of ELBW survivors will be of average body size in early adulthood, albeit relatively heavy for their height.

REFERENCES
Footnotes
-
Supported in part by a grant from the Royal Women’s Hospital Research Foundation