Article Text

Abstract
Objective Early childhood is a critical time to address risk factors associated with developmental vulnerability. This study investigated the associations between clusters of early life risk factors and developmental vulnerability in children’s first year of full-time school at age 5.
Design A retrospective cohort study.
Setting Population-wide linkage of administrative data records for children born in Tasmania, Australia in 2008–2010.
Participants The cohort comprised 5440 children born in Tasmania in 2008–2010, with a Tasmanian 2015 Australian Early Development Census (AEDC) record and a Tasmanian Perinatal Collection record.
Outcome measure The AEDC is a national measure of child development across five domains: physical health and well-being, social competence, emotional maturity, language and cognitive skills (school-based), and communication skills and general knowledge. Children who scored below the 10th percentile on one or more AEDC domains were classified as developmentally vulnerable. Children with special needs are not included in the AEDC results.
Results Latent class analysis identified five clusters of risk factors: low risks (65% of children), sociodemographic and health behaviour risks (24%), teenage mother and sociodemographic risks (6%), birth risks (3%), and birth, sociodemographic and health behaviour risks (2%). In this sample population, 20% of children were classified as developmentally vulnerable, but the proportion varied substantially by latent class. Logistic regression showed increased odds of developmental vulnerability associated with sociodemographic and health behaviour risks (OR 2.26, 95% CI 1.91 to 2.68, p<0.001), teenage mother and sociodemographic risks (OR 2.01, 95% CI 1.50 to 2.69, p<0.001), and birth, sociodemographic and health behaviour risks (OR 3.29, 95% CI 2.10 to 5.16. p<0.001), but not birth risks (OR 1.34, 95% CI 0.88 to 2.03, p=0.1649), relative to the reference group.
Conclusions The patterning of risks across the five groups invites consideration of multisectoral policies and services to address complex clusters of risk factors associated with developmental vulnerability.
- community child health
- public health
- epidemiology
This is an open access article distributed in accordance with the Creative Commons Attribution Non Commercial (CC BY-NC 4.0) license, which permits others to distribute, remix, adapt, build upon this work non-commercially, and license their derivative works on different terms, provided the original work is properly cited, appropriate credit is given, any changes made indicated, and the use is non-commercial. See: http://creativecommons.org/licenses/by-nc/4.0/.
Statistics from Altmetric.com
Strengths and limitations of this study
The use of data linkage methodology enabled a population-wide cohort to be assembled with minimal selection bias.
A latent class analysis approach captures the multidimensionality of developmental disadvantage and provides guidance about how to tailor policies and services to fit the developmental circumstances of subpopulations of children and families.
The characterisation of children’s developmental circumstances was limited to variables available in administrative records not primarily collected for statistical purposes.
Missing data, particularly for maternal education, were a limitation of the study.
Background
Children’s developmental progress is shaped by their individual characteristics, those of their parents and their environments.1 Early life adversities, especially socioeconomic disadvantage, cast a long shadow over children’s health, education and employment outcomes in adult life. Global efforts to prevent individual and societal human capability losses have galvanised around early childhood policies and services to support all children to achieve their developmental potential.2–6 Investments in early childhood are backed by evidence that early childhood interventions benefit children,7–9 especially those with multiple disadvantages.10
Evidence from longitudinal life course studies converges around the recommendation that to prevent human capability losses, multiagency early interventions are needed to improve children’s early life course outcomes and their developmental circumstances.3 10 11 Studies that quantify the multidimensionality of developmental vulnerability using linked administrative data can provide direct evidence for government departments about their service populations. This potentially adds value for government departments on how to tailor policies and services to children and families in their jurisdictions. The benefit of linking data sets across multiple government agencies is that antecedents to children’s developmental outcomes can be identified across sectors and the clustering of risk factors can be quantified.
Motivated by an interest in the multidimensionality of risk factors for early childhood policy applications, several recent studies have sought to conceptualise developmental disadvantage in ways that differentiate subpopulations of children at risk for poor human capability formation and mirror service populations. Chittleborough and colleagues12 linked population-wide administrative data in South Australia to investigate how well early life course risk factors at birth differentiated between children with and without vulnerable development at age 5. A set of six perinatal, sociodemographic and health behaviour risk factors showed fair-to-moderate discrimination between children with and without vulnerable development at the start of full-time school. Caspi and colleagues13 used Dunedin Study survey data linked to multiple New Zealand administrative data sets to investigate whether aggregated childhood risk factors predicted a segment of the population with high human capability losses and economic burden. Childhood risk factors, including a face-to-face behavioural assessment of ‘brain health’ at age 3 that assessed physical, motor, language, cognition and behaviour, predicted high-cost groups in adulthood with large effect sizes. Taylor and colleagues14 used data from the Longitudinal Study of Australian Children linked to Australian National Assessment Program-Literacy and Numeracy data to investigate multiple risks for reading achievement. Across 6 years of school, children with a sociodemographic and child development risk profile lagged 5.3 years behind low risk-exposed children.
These studies showed that children are not exposed piecemeal to single risks. The clustering of inter-related risk factors is the reality that confronts policy makers seeking to improve outcomes for children and families. Therefore, the focus of this study was on identifying subpopulations of children, quantifying their developmental outcomes, and discussing the findings in relation to which groups may benefit from different types of services and different service models.
In this study, children’s outcomes were quantified using a key national indicator used to monitor child development in Australia.15 The indicator developmentally vulnerable on one or more domains of the Australian Early Development Census (AEDC) is used as a progress measure in relation to the Council of Australian Governments’ National Early Childhood Development Strategy. The purpose of the AEDC is to provide data to assist governments and communities in developing services and support to reduce developmental vulnerability across the population. Australia and Canada are the only two countries in the world to have collected population-based data on early child development.16
The aim of this study was to investigate the associations between clusters of early life risk factors and developmental vulnerability at age 5. We used latent class analysis (LCA) to identify risk groups and multiple regression to estimate the associations between risk group membership and developmental vulnerability at age 5.
Methods
Data sources and study population
The study was conducted in Tasmania, Australia’s island state with an area of 68 401 km² and a population of 519 050 people in 2016.17
The study used de-identified, unit record-linked administrative data collected by the Tasmanian Department of Health (Tasmanian Perinatal Data Collection) and the Commonwealth Department of Education and Training (AEDC).
The Tasmanian Perinatal Data Collection comprises demographic, antenatal, medical and obstetric information about the mother and information on the labour, delivery and condition of the infant for all live births and stillbirths of at least 20 weeks’ gestation or weighing at least 400 g at birth from all Tasmanian public and private hospitals. The data are collected under the mandate of the Obstetric and Paediatric Mortality and Morbidity Act 1994. The data collected and the definitions used are consistent with the National Minimum Data Set for perinatal collections developed by the Australian Institute of Health and Welfare (AIHW), in consultation with state and territory health authorities and the Australian Bureau of Statistics.18
The AEDC comprises information collected from classroom teachers about children’s development in their first year of full-time school. It takes teachers around 20 min per child to complete each instrument, and schools are provided with funding for teacher relief time to complete the AEDC instrument. Since 2009, AEDC data have been collected every 3 years (2009, 2012, 2015, 2018). The AEDC is an adapted version of the Early Development Index (EDI) developed by the Offord Centre for Child Studies at McMaster University, Canada16 and licensed by the Australian Government. The AEDC was formerly known as the Australian Early Development Index and became the AEDC in 2014. Since 2001, a series of validation studies have been conducted. These studies report that the validity and reliability of the AEDC are satisfactory.19
The data are collected under passive consent. The AEDC child participation rate is reported as the number of children who participate in the AEDC as a proportion of the total estimated number of children eligible to participate in the AEDC across government, Catholic and independent schools. The 2015 AEDC participation fraction was 96.5% nationally and 99% in the state of Tasmania.20
Linkage of 2015 AEDC records with Tasmanian Perinatal Collection records was conducted independently of the researchers by the Tasmanian Data Linkage Unit (TDLU). The data linkage model used by the TDLU is consistent with the National Health and Medical Research Council principles for accessing and using publicly funded data for health research,21 and the TDLU took no part in the analysis of the linked data.
Unit record-level information from the two data sets was provided by the data custodians to the TDLU, where it was probabilistically linked to create an anonymous linkage key unique to individuals in the data set. The linkage process separated personal identifying information from service or clinical data.22 The probabilistic linkage methods involved a two-stage process. The first stage was the calculation of linkage probability weights to identify potential matches among individuals in the different data sets. The technique uses match weights for each linkage field; weights are derived for field agreements, disagreements and missing values. Based on the total weight score, record pairs are classified as matches, non-matches and potential matches using weight thresholds. To link data, the TDLU uses a combination of fields, as applicable, including source system identifier; first name, middle name and surname; date of birth; date of death; gender; street address, suburb and postcode; and birth weight. The second stage was a clerical review process of manually checking record pairs/groups marked as potential matches following probabilistic linkage. The identifiable data sets, with the addition of unique linkage keys, were returned to the data custodians, who then combined the identifiable data set and the unique linkage key with their complete data set. Each data custodian then extracted a de-identified research data set that contained the selected variables and the unique linkage keys and released the research data set to the researchers. The researchers linked unit record-level information across the two data sets using the unique linkage key to create a data set for analysis.
The study population comprised children with a 2015 AEDC record with a Tasmanian postcode and a Tasmanian Perinatal Baby Record (see figure 1), that is, children born in Tasmania who were also enrolled in their first year of full-time school in Tasmania.

Cohort flow diagram. AEDC, Australian Early Development Census.
Of the 6419 children with a Tasmanian 2015 AEDC record, 979 (12.5%) were excluded from the study sample as they did not have a Tasmanian Perinatal Baby Record. The children with a Tasmanian 2015 AEDC record and no Tasmanian Perinatal Baby Record were likely to have migrated to Tasmania from interstate or overseas. Most children in the cohort were born in 2009 (97.8%), with small proportions born in 2008 (1.8%), 2007 (0.1%) or 2010 (0.3%). Of the children, 51.8% were male. The mean age of the children, 5 years and 7 months (range 4.7–8.4 years), was calculated by subtracting the child’s birth date from the date that the 2015 AEDC instruments were collected.
Outcome measure: the AEDC
The primary study outcome (developmental vulnerability) was determined using data from the 2015 AEDC collection. The 2015 data collection period started in the second term of the four-term school year, and schools were given three calendar months to complete data collection.
The AEDC comprises 96 licensed items across five domains: physical health and well-being, social competence, emotional maturity, language and cognitive skills (school-based), and communication skills and general knowledge. Scores from 0 to 10 are calculated for each domain. Children receive a score between 0 and 10, where 0 is the most developmentally vulnerable. Scores are classified into percentiles, and performance on each domain is expressed categorically. Children with scores below the 10th percentile of the national AEDC population are categorised as ‘vulnerable’, between the 10th and 25th percentile ‘at risk’, and above the 25th percentile ‘on track’. The AEDC cut-off scores are based on all children who participated in the first national AEDC data collection in 2009 (ie, national AEDC population). The 2009 cut-off scores apply to all AEDC data collections.
In this study, children who scored below the 10th percentile on one or more AEDC domains were classified as developmentally vulnerable.20
The AEDC also collects school variables and demographic variables from state/territory government, Catholic and independent schools. These variables include the child’s age, gender, Aboriginal and/or Torres Strait Islander status, English-language status, country of birth, parent/caregiver education, and Index of Relative Socio-Economic Disadvantage.17 Additional variables obtained from teacher report on the AEDC instrument include the special needs status of the child, regular reading at home, and attendance in non-parental child care and/or an early education programme in the year before school. A special needs child is defined as requiring special assistance due to a medical diagnosis or diagnoses of chronic medical, physical or intellectually disabling conditions.20 Domain scores for children with special needs are not included in the AEDC results. AEDC scores are flagged as invalid for children who are less than 4 years of age and where the teachers completed less than 75% of the items on any domain.20
Risk factors
This study used 11 single risk factors, measurable from birth and systematically shown to be associated with developmental vulnerability on the AEDC12 23 or the EDI24 25 and relevant for government departments responsible for policies and services for children and families.
The choice of measures was restricted to variables that are currently available in administrative data collections in Australia. We selected measures that have substantiated independent associations with developmental vulnerability in Australian populations26 27; feature prominently in capability-based frameworks for monitoring equality28 29; and in flagship longitudinal prospective cohort studies with the child as the principal focus.30 The guiding principles were that the 11 risk factors were (1) measurable from birth; (2) visible in policy and service settings; (3) amenable to change; and (4) able to be reported repeatedly over time. Specifically, low birth weight, preterm birth, parity, multiple birth, teenage mothers, Indigenous mothers, smoking in pregnancy, alcohol use in pregnancy and language background other than English are indicators in the AIHW mothers and babies reporting framework.27 Area-level socioeconomic disadvantage is an indicator in the Australia’s Health reporting framework.31 Lifting year 12 educational attainment is a Coalition of Australian Governments’ priority goal, and monitoring the educational attainment of children’s parents is part of Australia’s National Assessment Program, which has national and international components.32
The variables were dichotomised to indicate the presence or absence of risk (see table 1).
Distribution of risks and outcomes in the analytic sample
Child risk factors
Information about birth weight in grams, gestational age at birth in weeks and plurality was obtained from the perinatal baby records.
Maternal/main carer risk factors
Information about the mother’s age at the birth of the child, Indigenous status of the mother, parity, and maternal self-report about any smoking and alcohol use in pregnancy was obtained from the perinatal mother records, and information about the main carer’s highest level of school education was obtained from the AEDC.
Family risk factors
Information about socioeconomic disadvantage at the birth of the child was obtained from the perinatal mother records, and information about the language spoken by the child at home was obtained from the AEDC.
Statistical analysis
Missing values for risk factors were imputed using PROC MI in SAS V.9.4.33 The proportions of missing data ranged from 0.02% (low birth weight) to 24.89% (primary caregiver education). We generated 25 imputed data sets, with results averaged according to Rubin’s rule,34 using PROC MIANALYZE. A comparison of imputed and unimputed data is available in online supplementary file 1.
Supplemental material
The distribution of characteristics in the final analytic sample is described in table 1. There were 228 cases excluded from the analysis. Of these 228 children, 221 (4.06% of the cohort) were children with special needs and 7 were children whose AEDC scores were flagged as invalid for children less than 4 years of age and where the teachers completed less than 75% of the items on any domain.
The analysis proceeded in three steps: (1) LCA was used to identify and describe risk groups; (2) information from the latent class model was used to assign children to risk groups; and (3) logistic regression was used to estimate the odds of being classified as developmentally vulnerable on one or more AEDC domains, relative to the reference group (ie, ‘Low Risks Group’). All analyses were conducted in SAS V.9.4.33
LCA models identify unobserved (latent) subgroups within populations and assign an item-response probability within each class.35 These item-responses indicate the likelihood of an individual in that class being exposed to that particular risk factor.36 All LCA analyses were conducted using SAS PROC LCA V.1.3.2.37
Patient and public involvement
No patients were involved in the development of the research question or the outcome measures, or in the development of the plans for the design or implementation of the study.
Results
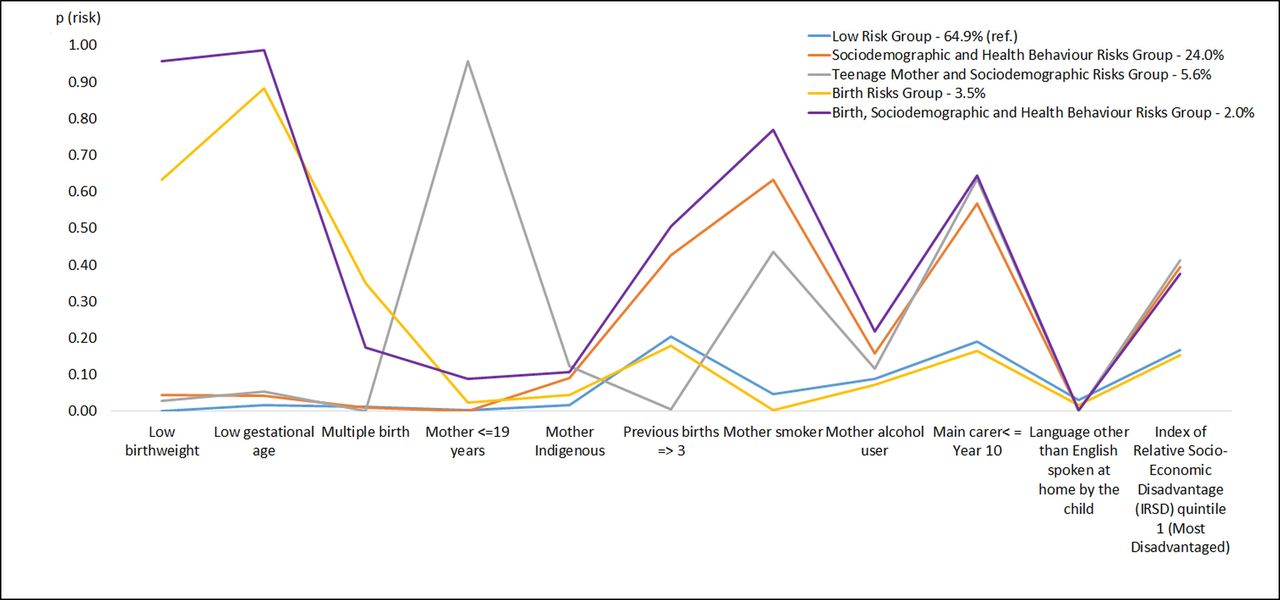
The best fitting model identified five classes (ie, groups). The model fitting process is described in more detail in online supplementary file 2. Table 2 shows the distribution of risks in the five LCA groups, and figure 2 shows the probability of risk exposure by group.
Supplemental material
Probability of risk exposure by group.
Distribution of risks in the five LCA classes
Latent classes were given descriptive labels based on the most prominent risk exposure(s) for each group. Group 1 was designated as a ‘Low Risks Group’ (65% of the sample), defined by consistently lower than the population-average exposure to any of the 11 risk factors, compared with the other groups. On average, children in this group were exposed to 0.8 risks. Group 1 was the reference group for this study. While groups 2–5 show some overlap in risk factors (see table 1), in naming these groups we highlight the points of differentiation between these groups. Group 2 was designated the ‘Sociodemographic and Health Behaviour Risks Group’ due to the increased likelihood of low maternal education, smoking in pregnancy, high socioeconomic area disadvantage, and three or more previous pregnancies, compared with the other groups. On average, this group was exposed to 2.4 risks. Group 3 was designated as a ‘Teenage Mother and Sociodemographic Risks Group’ due to the increased likelihood of maternal age less than 20 years, main carer education less than year 11 and high socioeconomic area disadvantage, compared with the other groups. Group 3 is distinguished from group 2 by teenage motherhood (95.7% vs 0.0%) and also by a much lower rate of three or more previous pregnancies (0.5% vs 42.7%). On average, this group was exposed to 2.8 risk factors. Group 4 was designated as the ‘Birth Risks Group’ due to the increased likelihood of low birth weight, low gestational age, multiple births, and lower than the population-average sociodemographic and/or health behaviour risks, compared with the other groups. On average, this group was exposed to 2.5 risks. Group 5 was designated as the ‘Birth, Sociodemographic and Health Behaviour Risks Group’ due to the increased likelihood of low birth weight, low gestational age, smoking in pregnancy, and three or more previous births, compared with the other groups. On average this group was exposed to 4.8 risks (see figure 2).
The patterns of risk factors in each of the five groups had different associations with developmental vulnerability. Table 3 shows that the proportion varied substantially by latent class: low risks (16% developmentally vulnerable, 550 children), sociodemographic and health behaviour risks (31%, 378 children), teenage mother and sociodemographic risks (29%, 82 children), birth risks (21%, 36 children), and birth, sociodemographic and health behaviour risks (41%, 40 children).
Percentage of children who were developmentally vulnerable on one or more AEDC domains in each of the five groups
The logistic model in table 4 shows the odds of a classification as developmentally vulnerable on one or more AEDC domains associated with membership in risk groups 2–5, relative to group 1 (low risks group). The reference group was defined by lower than the population-average exposure to birth, sociodemographic and health behaviour risks. There was no significant association between membership in the ‘Birth Risks Group’ (group 4) and the odds of being classified as developmentally vulnerable. By contrast, the highest odds of being classified as developmentally vulnerable occurred when birth risks clustered with sociodemographic and health behaviour risks (group 5). Higher than population-average exposure to sociodemographic risk factors was a defining feature of groups 2 and 3. These groups were differentiated by the distinct clustering of high socioeconomic disadvantage, low maternal education, smoking in pregnancy and three or more previous pregnancies in group 2 and high socioeconomic disadvantage, teenage motherhood and low maternal education in group 3. Membership in these groups was associated with increased odds of a classification as developmentally vulnerable. This pattern of association generally held when considering the individual AEDC domains (online supplementary file 3).
Supplemental material
Odds of developmental vulnerability on one or more AEDC domains for each risk group relative to the low risk group (group 1)
Discussion
The overarching aim of early childhood policies and services is to support all children to achieve their developmental potential and to prevent human capability losses over the life course. The study explored the associations between clusters of early life risk factors and developmental vulnerability in children’s first year of full-time school at age 5. The study used population-wide data routinely collected by state and territory governments in Australia with the aim of identifying population subgroups likely to have different service needs, based on clustering of risk factors and associations with developmental vulnerability at age 5. LCA identified five clusters of risk factors: low risks (65% of children), sociodemographic and health behaviour risks (24%), teenage mother and sociodemographic risks (6%), birth risks (3%), and birth, sociodemographic and health behaviour risks (2%).
In this sample population, 20% of children were classified as developmentally vulnerable on one or more AEDC domain, compared with 22% of children nationally. The proportion of developmental vulnerability varied substantially by subgroup, as did the associations with developmental vulnerability. The more complex the clustering of risk factors, the stronger the associations with developmental vulnerability. However, children with developmental vulnerability were present in all subgroups, although in higher proportions with increasing multiple risk exposures. The proportions of developmentally vulnerable children ranged from 16% in the ‘Low Risks Group’ to 41% in the ‘Birth, Sociodemographic and Health Behaviour Risks Group’. The finding that one in five children were identified as developmentally vulnerable in the first year of full-time school underscores the importance of the universal provision of early childhood services (eg, child health, early childhood education and care, early learning) for all children. The capacity for universal early childhood services to engage with children and families regularly from pregnancy to the start of full-time school (ie, continuity of care) is critical to reducing developmental vulnerability in all population groups.38
The ‘Low Risks Group’ is arguably the most challenging subgroup for policy makers because their risk attributes may not be visible in existing administrative data collections. This group had the lowest proportion but highest number of developmentally vulnerable children compared with the other groups. This is a group whose point of contact with early childhood services is likely to be universal services. Universal early childhood services have a strong focus on primary prevention with the provision of more intensive services on a needs basis (eg, additional child and maternal health visits) and referral to additional services as required (eg, speech pathology). Universal health and education services play a vital role in monitoring a child’s individual development. For the ‘Low Risks Group’, regular assessment of individual children’s development will be an important strategy for addressing developmental concerns before children start school. Children in this group are unlikely to be eligible for targeted services because of their low risk status.
In Australia, the estimated annual investment in assessing learning and development from birth to 5 years is 37% for newborns/infants, 27% for primary school, 20% for school entry, 10% for 14–48 months, and 5% for preschool.39 Given that more than one-fifth of Australian children are identified as developmentally vulnerable in their first year of full-time school, further investment in regular developmental monitoring across the first 4 years of life may be an important strategy for identifying and responding to developmental concerns before children start full-time school. For the ‘Low Risks Group’, regular ‘light touch’ contacts across multiple services (eg, antenatal, child and maternal health, early childhood education and care, early learning) are likely to achieve the largest population coverage across the first 5 years of life. This is essentially a whole-of-government approach that would require coordination of services and data sharing across government departments. A key reform priority in Australia is to create a linked national data set on children from birth to the early years of school in recognition that the currently available indicators of child health, development and well-being do not measure important aspects of children’s developmental circumstances, including parenting, and family social networks.26
The finding that the burden of developmental vulnerability was highest in the three subgroups with multiple sociodemographic risk exposures supports the case for bringing together universal, proportionate universal and targeted services to address barriers to accessing multiple services. For these groups, proportionate universal services that address the burden of developmental vulnerability across a number of social determinants are indicated,3 particularly where these universal services are ‘proportionately’ tailored to address the differentiating features of the risk circumstance. These proportionate universal services include more intensive provision of child health and parenting services, early learning programmes and earlier access to early childhood education and care, than universal services. However, improvements in developmental outcomes in population subgroups are unlikely to shift the overall population burden of developmental vulnerability, unless comparable improvements are made across the whole population.40
For children and families living in communities characterised by deep and persistent disadvantage, there is a global trend towards place-based early childhood service models41 that colocate centre-based child and adult services in the one place and use outreach to overcome barriers to accessing centre-based services.42 Examples of these models include the Toronto First Duty in Canada, Promise Neighborhoods in the USA, Children’s Centres in the UK, and Child and Family Centres in Australia.43
Improving outreach and engagement with children and families across the population is an important mechanism to improve engagement of children and families in universal and proportionate health and education services, especially families experiencing multiple disadvantages.3 While outreach is a reform priority in Australia, as yet there is no framework to guide outreach policies and practices in early childhood services.15
The differences in the combinations of risks between subgroups draw attention to the need for additional services targeted to specific combinations of risk factors. For example, the clustering of risks in groups 2 and 3 produced similar odds of vulnerable child development, yet the developmental circumstances that defined these groups invite different policy responses. While high socioeconomic disadvantage and low maternal education were observed in both groups, in group 2 these risks clustered together with young maternal age. This highlights the importance of services tailored to the rights and needs of young mothers and their children.44 Training and education opportunities for parents, provision and earlier access to high-quality early education and care (eg, Tasmanian Working Together for 3 Year Olds), and an increase in Australia’s unemployment benefit (Newstart) will be important to change the life chances for children and families experiencing deep and persistent disadvantage. For young parents (particularly mothers) under the age of 20 years, strategies that address maternal support and maintaining pathways for young mothers to stay in or re-engage in education and training have a vital role in changing the development of their children’s capacities and breaking cycles of intergenerational disadvantage.
In group 4, the clustering of birth risks with lower than the population-average exposure to sociodemographic risk factors was not associated with increased odds of developmental vulnerability. The AEDC results do not include children who require special assistance due to a medical diagnosis or diagnoses of chronic medical, physical or intellectually disabling conditions.20 It is plausible then that children with the highest burden of biological vulnerability at birth are not included in the AEDC results. The birth risks group, like the low risks group, is one for whom a primary prevention approach is recommended. Universal early childhood services have an important role in monitoring children’s developmental progress from the earliest milestones. The challenge here is apportioning resources proportionate to need (eg, targeted services) while operating universal services for children and families who may also require flexible service delivery and whose service needs can be fluid, especially in relation to the child’s developmental progress, which is highly variable and difficult to predict in the first 5 years of life.45 Contemporary studies of child development have revealed a complex mix of risk factors for developmental vulnerability.2 The current study illustrates how existing data routinely collected by governments in Australia can support the identification of population subgroups with different exposures to developmental risk factors. The attributes of the subgroups of this study population and their association with developmental vulnerability at age 5 indicate how the study method can support a plurality of policy interventions that mirror service populations.
Strengths and limitations
LCA is a person-centred approach that allows us to identify subpopulations based on patterns of risk, rather than estimating population-averaged effects for risk factors while holding all other risk factors constant. As such, it is closer to the phenomenology or lived experience of the children in our study. Another strength is that unlike traditional approaches to cumulative risk, it does not assume that all risks have an equal weight. For policy makers, LCA offers an approach to understanding service needs based on the attributes of the service population.
LCA is a data-driven technique that carries the risk of the results being sample-dependent or risk factor-dependent. That is, had different risk factors been included, a different set of profiles may have resulted.46 However, we were constrained by the data available to us. For example, had we included measures of parent health, mental health, trauma or adverse life events, we may have discovered different profiles. Further, the approach works best with 5–12 risk factors and involves substantive interpretation in defining the groups, which may oversimplify the multidimensionality of risk factors.47 Class membership for a given child is probabilistic and a child may possess characteristics of one or more classes. Therefore, it is important to not reify classes. Nonetheless, a strength of the study is that it demonstrates the way in which policy makers may gain a more fine-grained description of their service populations with the data they have to hand, and assist them in identifying higher value data with greater relevance to their population they may seek to obtain in future.
The extent to which the inclusion of additional or alternative risk variables may identify different patterns is also a concern for policy makers. To identify and calibrate service operations in the health and education services sectors, policy makers consider numerous factors across multiple biological, psychological and sociodemographic contexts. However, although policy makers are aware of the role these factors can play, service interventions may not be informed by the impact these factors are having on a service population because no data on these factors are available to the policy maker in the relevant timeframe. For example, quantifying the role a child’s home learning environment can play in early development and in school readiness is a central concern for early years education services. It is reasonable to expect that a small proportion of children in a given birth cohort will experience a home environment affected by parental separation or parental mental health difficulties. A limitation of this study is the extent to which the data available can help to shed light on the role these family risk factors play. While some data are collected about fathers by health and education service providers, and the familial relationship and sex of the primary caregiver(s), these data were not part of the data collections used in this study.
We were confronted with missing data for the maternal education variable. While this is a limitation, sensitivity testing with the original versus imputed data indicates our findings are robust. That is, the nature of the identified latent classes and the patterns of associations with the outcome measure were unchanged.
Future research
A wicked problem is that inequalities in child development go hand in hand with inequalities in access to services (ie, the inverse care law).48 The complex risk factors associated with vulnerable child development are also barriers to access to services, and universal services may not be proportionate to need. The extent to which different clusters of risk factors are associated with universal, proportionate universal and place-based early childhood service use will be explored in a subsequent study.
Conclusion
Knowing how multiple risks are patterned and for how many children can help policy makers understand the likely service needs of all children in the population as well as additional service needs of subgroups of children. In this study, the multidimensionality of risk exposures associated with developmental vulnerability for subgroups of children underscores the potential for multisectoral multigeneration policies and services across the first 5 years of life to address risk factors associated with developmental vulnerability.3 10 11
Acknowledgments
We acknowledge the partnership of the Tasmanian Department of Education, Department of Health, and Department of Premier and Cabinet in conducting this study. We acknowledge the Tasmanian Department of Education and Department of Health data custodians who provided data for this study. This study does not necessarily reflect the view of the Tasmanian government departments involved in the research. This study uses data from the Australian Early Development Census (AEDC). The AEDC is funded by the Australian Government Department of Education and Training. The findings and views reported are those of the authors and should not be attributed to the Department or the Australian Government. We thank the staff at the Tasmanian Data Linkage Unit.
References
Footnotes
Contributors CLT, SRZ and AV conceived of the paper. CLT, SRZ, AV, DC, DP and JS contributed to the study design. DC and JS undertook the analyses. CLT, SRZ, AV, DC, DP and JS contributed to the interpretation of the results and writing of the paper. CLT, SRZ, AV, DC, DP and JS approved the final manuscript.
Funding This study was supported by a Partnership Project grant from the National Health and Medical Research Council Australia (1115891) and the Tasmanian Department of Education, Department of Health, and Department of Premier and Cabinet. CLT, SRZ and DC are supported by the Australian Research Council Centre of Excellence for Children and Families over the Life Course (CE140100027).
Competing interests None declared.
Patient and public involvement statement Patients and/or the public were not involved in the design, or conduct, or reporting, or dissemination plans of this research.
Patient consent for publication Not required.
Ethics approval Approval to conduct this study was obtained from the Tasmanian Health and Medical Research Ethics Committee (H0016203).
Provenance and peer review Not commissioned; externally peer reviewed.
Data availability statement Data are available upon reasonable request. The linked administrative data are owned by the government departments that approved the linkage and use of the data for this study. Use of the study data is restricted to named researchers. The current Human Research Ethics Committee approval was obtained for public sharing and presentation of data at the group level only, meaning the data used in this study cannot be shared by the authors. Collaborative research may be conducted according to the ethical requirements and relevant privacy legislations. Potential collaborators should contact the authors (CLT or AV) with their expression of interest. The steps involved in seeking permission for linkage and use of the data used in this study are the same for all researchers.