Article Text

Abstract
Objective We adapted a composite neonatal adverse outcome indicator (NAOI), originally derived in Australia, and assessed its feasibility and validity as an outcome indicator in English administrative hospital data.
Design We used Hospital Episode Statistics (HES) data containing information infants born in the English National Health Service (NHS) between 1 April 2014 and 31 March 2015. The Australian NAOI was mapped to diagnoses and procedure codes used within HES and modified to reflect data quality and neonatal health concerns in England. To investigate the concurrent validity of the English NAOI (E-NAOI), rates of NAOI components were compared with population-based studies. To investigate the predictive validity of the E-NAOI, rates of readmission and death in the first year of life were calculated for infants with and without E-NAOI components.
Results The analysis included 484 007 (81%) of the 600 963 eligible babies born during the timeframe. 114/148 NHS trusts passed data quality checks and were included in the analysis. The modified E-NAOI included 23 components (16 diagnoses and 7 procedures). Among liveborn infants, 5.4% had at least one E-NAOI component recorded before discharge. Among newborns discharged alive, the E-NAOI was associated with a significantly higher risk of death (0.81% vs 0.05%; p<0.001) and overnight hospital readmission (15.7% vs 7.1%; p<0.001) in the first year of life.
Conclusions A composite NAOI can be derived from English hospital administrative data. This E-NAOI demonstrates good concurrent and predictive validity in the first year of life. It is a cost-effective way to monitor neonatal outcomes.
- neonatal morbidity
- outcome measure
- administrative data
- international classification of diseases
This is an open access article distributed in accordance with the Creative Commons Attribution Non Commercial (CC BY-NC 4.0) license, which permits others to distribute, remix, adapt, build upon this work non-commercially, and license their derivative works on different terms, provided the original work is properly cited, appropriate credit is given, any changes made indicated, and the use is non-commercial. See: http://creativecommons.org/licenses/by-nc/4.0/.
Statistics from Altmetric.com
What is already known on this topic?
In high-income countries, severe neonatal morbidity has been suggested as a more relevant outcome than perinatal mortality for monitoring the safety of obstetric care and gauging demand for specialist neonatal, paediatric and community services.
A composite neonatal adverse outcome indicator (NAOI) derived from routine hospital data offers several potential advantages over bespoke data collection on individual morbidities.
These issues motivated the development of a composite NAOI using routinely collected Australian hospital administrative data. It is unknown whether this indicator can be used in other countries.
What this study adds?
This study translated the Australian NAOI for use with routinely collected English hospital data. It was necessary to modify the Australian NAOI to address potential data quality issues, as well as to reflect current neonatal health concerns in England.
The resulting English version of the NAOI (the E-NAOI) demonstrated good concurrent validity as a population measure of severe neonatal adverse outcome and was predictive of death and hospital admission in the first year of life.
The E-NAOI is a way of monitoring the incidence of adverse neonatal outcomes across hospitals using routinely collected data. Our results suggest the approach could be applied in other countries with similar routine hospital administrative datasets.
Introduction
Access to information on adverse neonatal outcomes is important for various purposes including monitoring the safety of obstetric care, gauging demand for specialist neonatal, paediatric and community services, and providing contextual material for the design of research studies or public health interventions.
The Apgar score is one method for assessing the condition of the newborn infant immediately after birth, and a low Apgar score at 5 min has been shown to be associated with an increased risk of neonatal and infant death, particularly for term infants.1 However, while the Apgar score is a useful method to report on the status of a newborn, it does not directly record or predict longer term morbidity and is a weaker predictor of outcome for preterm infants. Some commentators have also expressed concerns that the score is not weighted to reflect the relative importance of some of the components.2
At a national level, it is possible to monitor population rates of neonatal mortality3 and individual morbidities, such as seizures or intraventricular haemorrhage. However, these events are too rare to be used at a local level to monitor quality of care and detect significant changes over time as the signal to noise ratio is too low.4 Within well-funded randomised controlled trials and observational studies,5–7 it has proven possible to describe rates of adverse outcomes by creating a composite neonatal outcome indicator, but these require bespoke data collection mechanisms that are generally only possible to achieve on a small scale and for a limited time period.
These issues motivated Lain et al to develop a composite neonatal adverse outcome indicator (the NAOI) using routinely collected Australian hospital administrative data.8 The development of the indicator followed an iterative process including a literature review, calculation of the incidence of each component and its association with hospital readmission and expert consensus. It was constructed using the Australian-modified version of International Statistical Classification of Diseases, 10th Revision (ICD-10) diagnosis and procedure codes and was found to describe rates of adverse events that were comparable with research studies. It also had the advantage of being relatively low cost compared with conducting primary data collection.9
As the Australian NAOI was derived using the ICD-10 classification, it has the potential to be applied to the population of newborns in other countries. We evaluated the feasibility of translating the Australian NAOI for use with routinely collected English hospital neonatal data. The study determined what modifications to the NAOI were required to address potential data quality issues as well as known neonatal health concerns in England. Finally, we examined the validity of the resulting English-version NAOI (E-NAOI) in terms of it producing: (1) expected rates of adverse events and (2) expected associations with death and hospital admission in the first year of life.
Methods
Data sources
The study used the Hospital Episode Statistics (HES) database to identify births in English National Health Service (NHS) trusts (acute hospital organisations) and inpatient episodes up to a year after birth. The HES database contains patient demographics, diagnostic and procedure information, and administrative data for each inpatient episode of care.10 Diagnostic information is coded using the ICD-1011 and operative procedures are coded using the UK Office for Population Censuses and Surveys Classification, Fourth Revision (OPCS4).12
The HES database contains supplementary fields (the ‘baby tail’) for episodes related to the birth of a baby, which enable the capture of details such as birth weight and gestational age. Babies’ birth episodes were identified by the presence of ICD-10 codes Z37-Z38, HRG codes N01-N05 (neonates) or HES fields relating to episode type, method of admission, age at start of episode and level of neonatal care. The level of data completeness within the ‘baby tail’ varies across NHS trusts but, in 2015, data on gestational age and birth weight were available in 90% of all birth episodes.13
In HES, each patient is assigned a unique identifier (the HESID) that makes it possible to link different events experienced by individual and thereby enables researchers to study longitudinal patterns of care, such as rates of unplanned readmission following a particular procedure, as well as enabling the tracking of patients between hospitals.
Study population
We included all liveborn infants from 24 weeks to 43 weeks of gestation born between 1 April 2014 and 31 March 2015. This time period was chosen to allow follow-up for 1 year after birth in the HES database. We excluded NHS trusts with less than 500 births during the time period (11 of 148 organisations). We also removed records that were missing gestational age or birth weight (64 084 of 601 713 records) or that had an implausible birth weight for gestational age, defined as above the 99.999th or below the 0.0001th centile (470 of 537 629 records). Finally, we performed data quality assessments at the individual trust level and excluded trusts with suspected poor-quality data for key data items (online supplementary text S1). This reduced the dataset to 484 007 liveborn infants in 114 trusts.
Supplemental material
To obtain data on maternal demographic characteristics, the babies’ records were linked to the hospital delivery records of their mothers using probabilistic linkage that took advantage of the fact that information in the baby record was repeated in the maternal record (eg, birth weight and gestational age). This method is described elsewhere.14 Where missing information in the baby’s record was available in the mother’s record (eg, birth weight or gestational age), the value was taken from the mother’s record. The baby records were further linked to the Office for National Statistics death register to allow an assessment of infant mortality after hospital discharge within the first year of life. The composite was constructed as a binary outcome, in which infants were positively identified according to the presence of one or more of the E-NAOI components.
Translation of Australian NAOI
The Australian NAOI contained 15 neonatal diagnoses and 7 procedures. The rationale for the inclusion of specific components is described in detail by Lain et al.8 We constructed a list of the ICD-10 diagnosis and OPCS procedure codes used to define the individual morbid events that were equivalent to the original Australian NAOI codes. The ICD-10-AM (Australian Modification) list of diagnoses mapped directly to the standard ICD-10 version. The list of Australian ICD-10-AM procedure codes were translated into OPCS codes by an expert neonatal clinician (SJO).
We identified individual adverse events before inpatient discharge after birth. We defined the first hospital inpatient stay to include all episodes of care within the birth admission plus any inpatient stay resulting from transfer to another NHS hospital if that admission started the same or following day after discharge from the birth hospital.
To investigate concurrent validity, the incidence of each element of the E-NAOI in the HES database was compared with the incidence reported by Lain et al 8 for the Australian NAOI as well as to incidence figures in published population-based studies from high-income countries, where available. We used an iterative process based on the comparative data available and expert clinical input to decide which of the original components should be included in the E-NAOI. Before excluding any individual morbid conditions with apparently poor ascertainment in the HES data, we considered whether alternative codes could be used to identify these babies. The list of morbid conditions was reviewed by expert clinicians (SJO and HKA) to ensure that current neonatal health concerns in England identifiable in HES were captured. Amendments to the original NAOI are described in box 1.
Adaptations made to the English-version neonatal adverse outcome indicator (E-NAOI)
Adaptations to overcome potential data quality issues
Based on the observation that the rate of neonatal blood transfusion recorded in Hospital Episode Statistics (HES) was implausibly low at all gestations, we did not consider the coding of transfusion to be reliable in HES. Others have reached similar conclusions when examining the coding of obstetric blood transfusions in HES.26
The coding for sepsis was amended to include codes P36.0 to P36.8 but to exclude code P36.9 (unspecified bacterial sepsis of the newborn) due to concerns that P36.9 is overused to record suspected rather than confirmed sepsis. Without this exclusion, rates of neonatal sepsis reported in HES were implausibly high at 2.6%. With the exclusion, the rates observed are in line with the published literature.23
Adaptations to reflect current neonatal health concerns in England
Intraventricular haemorrhage (IVH) was restricted to grades 3 and 4 since grade 2 IVH is of less prognostic significance.27
Respiratory distress syndrome was expanded to include all chronic respiratory disease originating in the perinatal period as a relevant diagnosis indicating serious adverse outcome.28
Therapeutic hypothermia was included as a relevant procedure indicating serious adverse outcome. The use of this therapy to treat perinatal asphyxial encephalopathy has been increasing in the UK since the publication of the TOBY trial in 2008.29 Its use indicates serious concern about the clinical condition of the baby at birth.
Bacterial meningitis was included as a relevant diagnosis with prognostic significance at least as relevant as that of generalised bacterial sepsis. It is associated with both short-term mortality and long-term neurodevelopmental complications.24
Statistical analysis
To investigate predictive validity, the rates of hospital readmission and infant death within the first year were calculated for babies discharged home alive from the birth episode. χ2 tests were used to compare the differences in each of these rates between infants identified by the E-NAOI as having morbidity compared with infants without any events.
We used multivariate logistic regression models to estimate the crude and adjusted effect of maternal and infant characteristics on the rate of the E-NAOI. We adjusted for maternal age (<20, 20–34 and ≥35), parity (primiparous or multiparous), infant sex, multiplicity and preterm birth (<37 or ≥37 weeks).
To examine between-trust variation in the adjusted E-NAOI, predicted rates were calculated by summing the individual probabilities of an adverse event for all women who delivered at the same NHS trust. Risk-adjusted rates were produced for each NHS trust by dividing the trust’s unadjusted rate by its predicted rate and multiplying this ratio by the national mean.
Funnel plots were used to examine the variation in the adjusted E-NAOI values between trusts. These plots ‘test’ whether the rate of an NHS trust differs from the national rate for England by more than would be expected from chance alone. Assuming that differences are due to random (sampling) errors, the chance of an organisation being within the limits is 95% for the inner funnel and 99.8% for the outer funnel.
All analyses were performed in STATA V.15.0.
Results
The initial mother–baby linked dataset contained 603 315 live births, which corresponds to 91% of the estimated 662 222 live births in England during the time period.15 Application of the data quality checks and study inclusion criteria reduced the dataset to 484 007 liveborn infants between 24 weeks and 43 weeks of gestation in 114 NHS trusts (figure 1). Excluded records had broadly similar demographic characteristics but were slightly more likely to relate to older, primiparous mothers and to preterm births (online supplementary table S2).
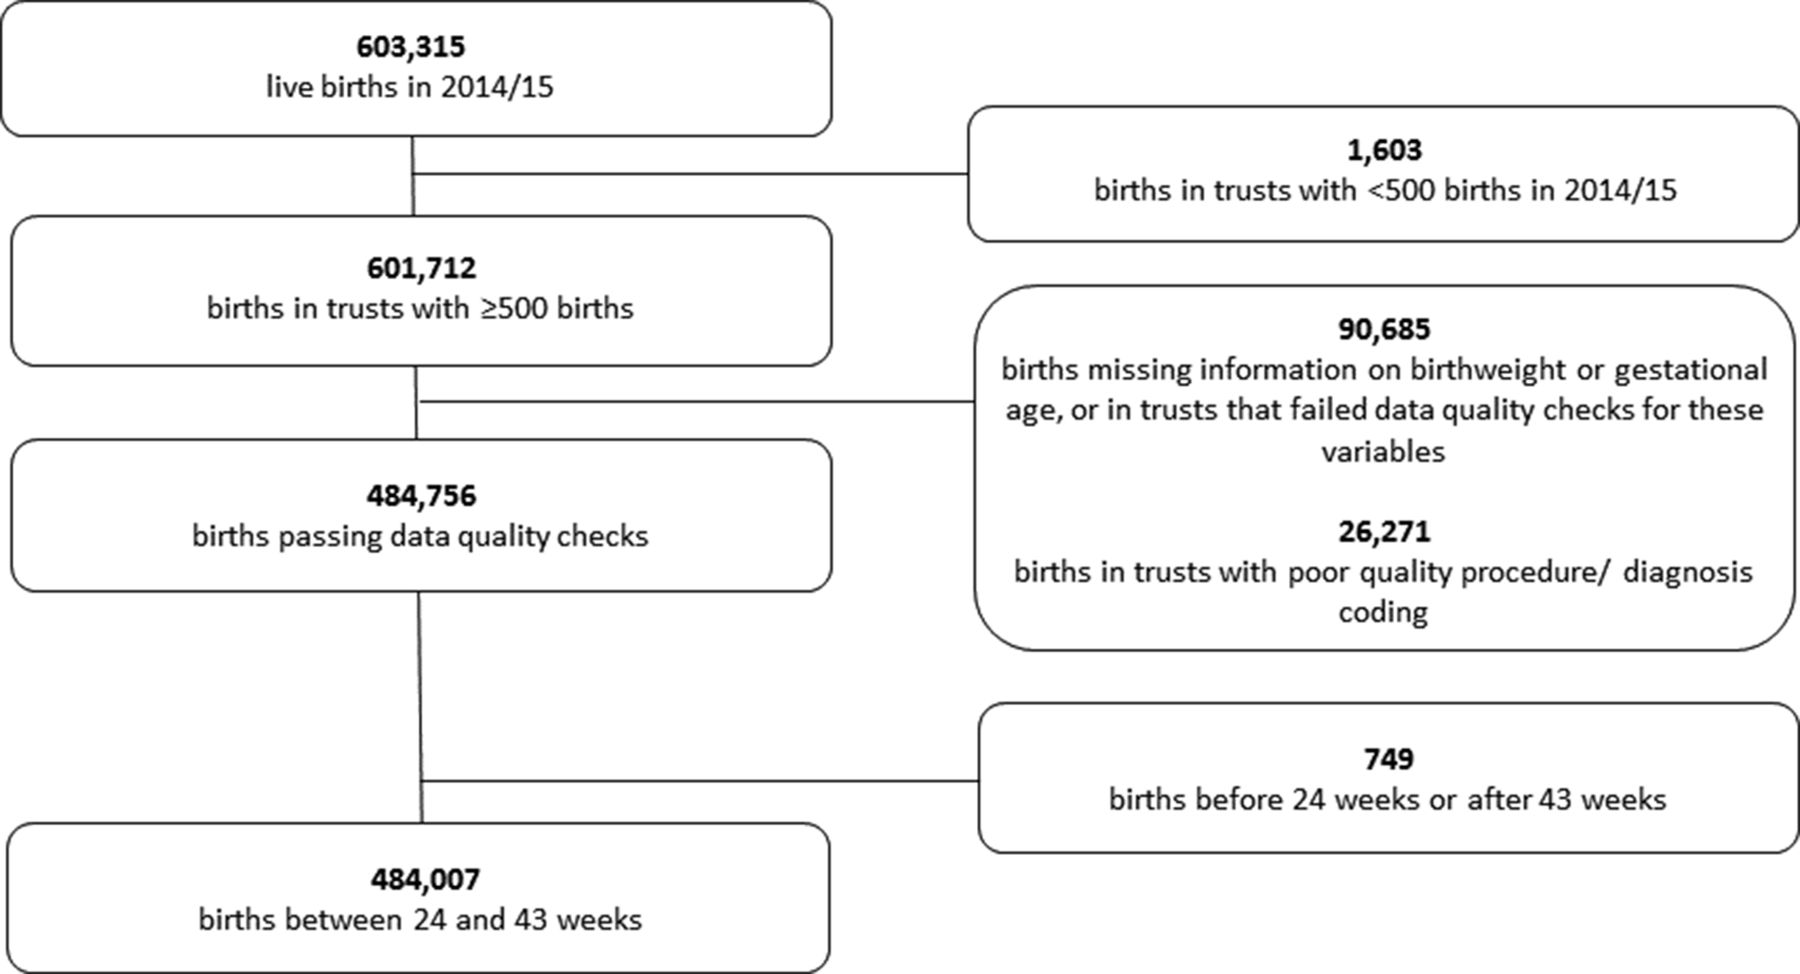
Data flow diagram.
For most of the 15 conditions and procedures within the composite NAOI, there was a straightforward way to translate the Australian codes into English equivalents. The adjustments to construction of the NAOI to address potential data quality issues in HES and current neonatal health concerns in England are described in box 1.
Among the 484 007 liveborn infants in the analysis, 5.4% had one or more of the E-NAOI conditions or procedures recorded before their first hospital discharge. Table 1 gives the frequency of the E-NAOI and of each E-NAOI component condition for early preterm (<34 weeks), late preterm (34–36 weeks) and term births (≥37 weeks). E-NAOI incidence was much higher in the early preterm births (84.6%) compared with late preterm (20.1%) and term births (3.1%), partly because all infants less than 32 weeks’ gestation are included in the NAOI and comprise 72% of the early preterm group.
Incidence (per 100 births) for conditions and procedures indicative of neonatal morbidity
The most common conditions among infants of all gestational ages were ventilatory support (mechanical ventilation and/or continuous positive airway pressure (CPAP) or high flow nasal cannulae) and respiratory distress syndrome, which themselves were highly correlated (76% of infants with respiratory distress syndrome required ventilatory support). For most components, the incidence measured in the English NHS was comparable with the incidence reported in the original Australian study. Notable differences between the English and Australian figures are described in table 1.
Assessment of validity
The proportion of infants identified as having one or more of the conditions in the E-NAOI fell from 77.2% at 32 weeks of gestation to 2.4% at 39 weeks of gestation but increased to 4.3% at 42 weeks (figure 2). The overall pattern of adverse events by week of gestation is consistent with expectations and similar to that described by Lain et al.8 Patterns of E-NAOI incidence also varied by mode of birth according to expectations, with higher rates observed among babies born by emergency compared with elective caesarean section.

Rate of neonatal morbidity by gestational age at birth identified by the E-NAOI. Note: gestational age <32 completed weeks is a component of the E-NAOI. E-NAOI, English-version neonatal adverse outcome indicator.
The distribution of maternal and infant characteristics stratified by whether an infant had an E-NAOI event is shown in table 2. Primiparity, maternal age over 34 year, male infant sex, multiple and preterm birth were associated with increased risk of being identified by the E-NAOI (table 2).
Association of E-NAOI with maternal and infant characteristics
Among babies discharged home alive, the E-NAOI was strongly associated with the risk of death following discharge home and with hospital readmission. Infants identified by the E-NAOI were over twice as likely to be admitted to hospital overnight in their first year of life (15.7% vs 7.1%; p<0.001) and over 15 times more likely to die within a year of birth (0.81% vs 0.05%; p<0.001) than infants not identified by the NAOI. Similar findings were observed when these rates were calculated for term infants only (table 3).
Rates of hospital readmission or death among infants discharged home, up to their first birthday, for conditions and procedures indicative of neonatal morbidity
The adjusted proportion of neonates identified with an E-NAOI condition varied from 2% to 11% between NHS trusts of birth. There was a slightly higher mean rate observed among NHS trusts with a neonatal intensive care unit (5.5%) compared with those with a local neonatal unit (5.4%) and special care baby unit (5.3%), but this difference was small compared with the differences between organisations (figure 3).

Funnel plot showing the proportion of infants identified by the E-NAOI in English NHS trusts in 2014/2015. Rates are adjusted for maternal (age and parity) and infant (sex, preterm and multiple) characteristics. E-NAOI, English-version neonatal adverse outcome indicator; LNU, local neonatal unit; NICU, neonatal intensive care unit; NHS, National Health Service; SCBU, special care baby unit.
Discussion
Main findings
Using routine hospital data in England from April 2014 to March 2015, we were able to adapt the Australian NAOI to produce a similar composite indicator for measuring severe adverse neonatal outcomes within NHS trusts. The resulting E-NAOI included 23 components (16 diagnoses and 7 procedures). The selection of individual components was driven by the quality of the routine hospital data as well as known neonatal health concerns in England. This necessitated a number of adaptations to the original composite measure developed using routine Australian hospital data, but these changes were relatively minor. For instance, one of the changes was the exclusion of neonatal blood transfusion as a component procedure. Lain et al 8 reported the use of transfusion in 18.08% of early preterm infants but only 0.10% of term infants; therefore, the overall impact of not including this procedure in the E-NAOI is likely to be small. Nonetheless, the weaknesses in data quality identified by this work deserve to be addressed by NHS trusts, and there are various ways in which trusts could verify data quality. For example, blood transfusion is recorded in the National Neonatal Research Database (NNRD) database, and trusts could use this to ensure it is correctly coded within HES.
The resulting E-NAOI demonstrated good concurrent validity. First, the incidence of the individual components of the composite indicator as measured in the English data were often consistent with the incidence reported in Australia. They were also similar to figures published by population-based studies in other high-income countries, where reported. Second, the incidence of events decreases by gestational age until term, in line with expectations. Third, the E-NAOI demonstrated good predictive ability, as indicated by a two-fold increased risk of overnight hospital admission and a 15-fold increased risk of death within the first year among infants flagged by the E-NAOI at birth. Although neither hospital readmission nor infant death are perfect measures to validate the indicator, they have been widely used as proxies for longer term neonatal morbidity.16 17
Caution should also be used when extrapolating the E-NAOI to estimate longer term morbidity, as the E-NAOI represents morbidity in the neonatal period only. Some conditions such as birth trauma (primarily localised paralysis due to brachial plexus injury) are usually resolved without readmission, whereas others are likely to have implications beyond the immediate neonatal period.
The reasonable level of validity demonstrated in this initial study suggests that further evaluation of the value of the composite as a performance indicator is warranted. A particular focus could be whether the performance of the overall E-NAOI could be improved when used for specific purposes. For example, although we found evidence of significant variation between trusts in the adjusted rate of the E-NAOI, we speculate that when used for local quality improvement, a version that only included amenable conditions may give different results. Decisions about which conditions are amenable to improvement are conceptually challenging. For example, different commentators may disagree about the extent to which low birth weight and preterm birth are preventable through best practice. The relative merits of this approach are not addressed in the present study and would be more thoroughly investigated in conjunction with a local quality improvement initiative. We recommend further consensus and validation work in this area.
Strengths and limitations of the study
The study has several methodological strengths. The dataset is large and drawn from a linked, population-based dataset. Furthermore, the linkage with mortality data and hospital admission episodes after birth allowed the predictive validity of the composite measure to be evaluated. The indicator can be calculated using administrative hospital data, secondary access to which is associated increasingly short time lags of 2–3 months.18 It is therefore a cheap and timely method of monitoring the incidence of adverse neonatal outcomes in comparison with bespoke data collection methods.
Some commentators have questioned the accuracy with which hospital administrative data captures individual neonatal morbidities, with particular concern about under-reporting.19 However, the E-NAOI includes both procedures and diagnoses and is therefore less susceptible to underascertainment of individual morbid events because: (A) severely ill neonates may have several different diagnoses and require multiple procedures, (B) procedures are more reliably reported than diagnoses and (C) the more severe the condition, the more likely it is to be reported.20
Although a composite measure has many advantages, a limitation of this study is the need to create dichotomous categories to represent severe neonatal morbidity out of what is in reality a spectrum of morbidity. For instance, mechanical ventilation and CPAP were included, but the relatively more common procedure of oxygen supplementation is not recognised.
A second limitation is the between-trust variation in use of procedures (and therefore E-NAOI incidence) due to availability of services and differences in practice, making it difficult to attach significance to differences between providers. In addition, despite our data quality checks, we cannot rule out the possibility of differences in local coding practices or definitions of particular procedures or diagnoses.
Finally, we dropped a number of records because of poor data quality. Although the excluded records shared broadly similar characteristics to the included records (online supplementary table S2), improvements in data quality at the minority of organisations with poor quality data are required before the E-NAOI is useful for giving a ‘state of the nation’ assessment for England.
In summary, the composite E-NAOI is a standardised method of monitoring adverse neonatal outcome across maternity units that demonstrates reasonable concurrent and predictive validity and could be applied in other countries with hospital administrative datasets with comparable diagnosis (ICD-10) and procedure codes. The indicator has the potential to be used for national surveillance, supporting policy development and evaluation as well as clinical audit and research. It could be further validated and refined through linkage with the NNRD that contains neonatal electronic patient records from all NHS neonatal units.
Acknowledgments
We would like to thank Samantha Lain for supplying the list of Australian-modified ICD-10 procedure codes used to develop the original Australian NAOI.
References
Footnotes
Contributors The study was conceived by HEK and DAC; HEK, DAC, IG-U, SJO and JHvdM agreed the study design and definitions; KLH prepared the data extract; HEK, DAC, SJO and HKA were involved in analysis; all authors contributed to writing the manuscript and reviewed the final version submitted.
Funding KH is funded by Wellcome Trust grant 103975/Z/14/Z.
Competing interests None declared.
Patient consent Not required.
Ethics approval The study is exempt from UK National Research Ethics Service approval because it involved the analysis of an existing dataset of anonymised data for service evaluation. Hospital Episode Statistics (HES) data were made available by National Health Service (NHS) Digital (Copyright 2015, reused with the permission of NHS Digital. All rights reserved). Approvals for the use of HES and Office for National Statistics (ONS) data were obtained as part of the standard NHS Digital data access process (NIC 383345).
Provenance and peer review Not commissioned; externally peer reviewed.
Data sharing statement The data governance arrangements for the study do not allow us to redistribute HES data to other parties. Researchers interested in accessing HES data can apply for access through NHS Digital’s Data Access Request Service (https://dataaccessrequest.hscic.gov.uk/). This study made use of pseudonymised HES extracts of infants born between April 2014 and March 2015, linked with the ONS death register.