Article Text

Abstract
Background Previously published data have demonstrated that preterm infants experience a fall across marked centile lines for weight in early life with early poor head growth also reported. This study describes a single neonatal unit’s experience of longitudinal change in weight, head circumference (HC) and length in a cohort of preterm infants born <32 weeks’ gestation.
Methods Data were collected from a single neonatal unit between July 2012 and June 2017. This period followed the introduction of improved nutritional guidelines. Patients were grouped according to their gestational age at birth. Growth lines were constructed for weight, HC and length in each gestational age group from the median measures and compared with reference centile lines.
Results Data were analysed from 396 patients consisting of 2808, 1991 and 2004 measures for weight, HC and length, respectively. Longitudinal growth plots did not show an initial absolute weight loss in any of the subgroups. Across all groups, the mean change in SD score between birth and 36 weeks was −0.27 (95% CI −0.39 to −0.15).
Conclusions This description of longitudinal growth in a cohort of preterm infants demonstrates that early postnatal growth failure is not inevitable, with most infants growing along a trajectory close to their birth centile. There is no evidence of a 2 marked centile line weight decrease or weight loss. These data provide evidence to suggest that extrauterine weight gain tracking centile lines can be achieved.
- nutrition
- growth
- neonatology
Statistics from Altmetric.com
What is already known on this topic?
Postnatal weight loss is described in preterm infants with a reported to drop across marked centile lines in early life.
Current practice is to plot infants on growth charts based on cross-sectional birth weight data.
The optimal pattern of growth in preterm infants to achieve good long-term health outcomes is unclear.
What this study adds?
In a cohort of preterm infants, postnatal weight loss was not seen, with most infants’ growth approximating their birth centile.
The expectation that preterm infants should lose weight or cross down centile lines was not seen in this cohort.
Recent changes to nutritional practice allow infants to achieve weight gain closer to their intrauterine counterparts.
Introduction
Survival rates for preterm infants have improved significantly in recent years, and this has allowed accompanying morbidity such as growth and neurocognitive outcomes to be brought into focus. The widely accepted goal of neonatal nutritional care is to attempt to replicate intrauterine growth.1 2 In most countries, the standard used to develop longitudinal growth charts is cross-sectional birth-weight data from cohorts of preterm infants in order to represent in utero growth, although such data have limitations as they are based on the assumption that preterm infants are growing normally up to the point of delivery.3 Examples of such charts include the Fenton growth chart in the USA, recently updated by Olsen et al,4 and the Neonatal and Infant Close Monitoring (NICM) Growth Chart used in the UK.5–7 Growth centile lines on these charts illustrate the presumed ‘ideal’ growth of infants born at differing sizes, based on the assumption that intrauterine growth is an appropriate target for these infants. It has therefore been recommended that preterm infants should track along or parallel to a marked centile line on such growth charts.2 8 Of note, the Intergrowth study has recently published growth curves based on the actual growth of healthy preterm infants, suggesting that it may be inappropriate to compare these infants with their in utero counterparts.9
The extrauterine growth of preterm infants has been reported to fall behind their term counterparts, crossing multiple centile lines downward in infants born extremely preterm.10–12 Additionally, preterm infants at term equivalent age are significantly lighter than their term counterparts and have altered body composition with increased percentage body fat and reduced lean mass.1 Head circumference (HC) growth in preterm infants has also previously been shown to fall down across marked centile lines, with a nadir at around 4 weeks postnatal age, before displaying some catch-up growth.13 Length growth of preterm infants displays a similar pattern.13–15
Based on multiple population-based studies,10–12 there is a view that this ‘extrauterine growth restriction’ is an inevitable consequence of preterm birth and that target centiles for preterm infants should be assigned in a more pragmatic fashion, perhaps after the first 2 weeks of life when growth patterns stabilise.11 16 However, such conclusions are based on historical cohorts of infants who may not have received optimal nutrition, and as such do not support that such patterns of growth are either ideal or inevitable in the face of optimal nutrition. At the same time, there is a tension between achieving increased nutrition and faster rates of growth, and the impact on short term morbidity and long-term metabolic and developmental outcomes.
Internationally, efforts have been made to develop guidelines, including recommended nutrient intakes, aimed at optimising nutritional support and growth.2 8 17 18 New nutrition guidelines and practices were introduced in our unit in 2012, based on published recommendations.8 18 19 Our hypothesis was that the extrauterine growth restriction previously described is not inevitable and could be prevented by the introduction of such practices.
In this paper, we describe the longitudinal growth of hospitalised preterm infants (born before 32 weeks’ gestation) who were born and cared for during the 5 years following the implementation of improved nutritional practices and compare their pattern of growth with accepted national growth standards.
Patients and methods
The study was carried out in a single tertiary neonatal unit (NNU). The NNU submits annual benchmarking data to the Vermont-Oxford network (VON) very low birth weight database. Data were collected for infants born from 23+0 to 31+6 weeks gestational age (GA) over a 5-year period between 1 July 2012 and 30 June 2017. This period commenced 6 months after the introduction of new local nutritional practices guidelines for preterm infants. These have been described elsewhere (http://dx.doi.org/10.1136/bmjopen-2017-017727),19 but briefly, consisted of improvements in parenteral nutrition (PN), a comprehensive nutritional guideline giving clear direction in increasing feeds and weaning of PN, a multidisciplinary nutrition team (including a neonatologist, dietitian, pharmacists and nursing staff) and weekly nutrition ward round seeing all very preterm infants.19 Early PN and breast milk fortification were encouraged, and the changes in care aimed to deliver nutrient intakes in line with internationally recognised recommendations, providing a mean protein intake of 3.7 g/kg/day during the first 2 weeks of life (range 2–4.9).8 19
Anonymised data were extracted from the clinical database (BadgerNet),20 which prospectively collects daily data on routine infant care. This included routine growth data collected for all infants on the NNU as part of their inpatient stay including weight, HC and length. To be included in the study, infants had to have >1 week of growth measurements and be admitted to the NNU in the first week of life. Preterm infants were included in the study regardless of their size and weight at birth. Data were included in the study until 36 weeks postmenstrual age (PMA), discharge (to home, another NNU or paediatric ward) or death. Measurements of growth parameters were carried out weekly by nursing staff according to a standard operating procedure and using standardised equipment. Staff received face-to-face training on measuring as part of their induction.
Infants were divided into subgroups based on GA at birth and gender. The growth data for each of these subgroups were collated and median measurements for each week of life were calculated for the subgroups. Medians for each subgroup were then overlaid on the standard centile lines based on the source data from the UK NICM growth chart to allow change within each subgroup to be compared against current growth standards.
In addition, SD scores (SDS) were calculated for infants at birth and at 36 weeks for weight, HC and length based on the NICM chart reference data. The change in SDS (ΔSDS) between birth and 36 weeks PMA was then calculated only for those infants that remained in the study at 36 weeks. Length reference data were available from 25 weeks PMA, so length SDS were either calculated on birth week or 25 weeks PMA, whichever was latest.
A feature of the NICM chart is that there is a gap of 0.67 SD between each marked centile line, meaning that a decrease in ΔSDS of more than 0.67 represented a fall across a marked centile line in the NICM chart.
The project was registered and approved as a service evaluation project by hospital care group management, and as such did not require ethical approval.
Results
A total of 437 patients’ data were reviewed. Forty-one did not meet the inclusion criteria, with the majority of excluded infants not staying on the unit beyond 1 week of age. Data were collected from 396 infants over the 5-year study period consisting of 2808, 1991 and 2004 measures for weight, HC and length, respectively. There were 161 females and 235 males in the sample (table 1) with a median PMA at discharge of 36 weeks. During the study period, standardised morbidity ratios for comorbidities (late-onset sepsis, intraventricular haemorrhage, retinopathy of prematurity, necrotising enterocolitis and chronic lung disease) and survival remained within or near expected limits according to VON benchmarking data (data not shown).
Patient characteristics at recruitment
Longitudinal growth and change in SDS
Figure 1 shows median weight plots for each GA subgroup overlaid on the standard NICM chart. It can be seen that these lines approximate the centile line that was attributed at birth. There is no weight loss in any of the subgroups seen in early life. Across all patients, the mean ΔSDS for weight between birth and 36 weeks was −0.27 (95% CI −0.39 to −0.15). The ΔSDS for weight from birth to 36 weeks PMA for all infants born at differing PMAs are also shown in table 2. The weight of the 23-week group exhibited a ΔSDS of −1.02 between birth and 36 weeks PMA. However, none of the other GA subgroups fell by more than 0.67 SDS between birth and 36 weeks PMA, meaning they did not fall more than a single marked centile line on the NICM growth chart. Male and female weights were reviewed separately (online supplementary file 1) and showed a similar overall growth pattern, with negative ΔSDS from birth to 36 weeks in all but five subgroups (table 2). Analysis of infants who remained in the study from birth until 36 weeks PMA (n=175) demonstrated that only 20 (11.4%) had a fall in SDS greater than 1.33 between birth and 36 weeks PMA, representing a drop of 2 marked centile lines.
Supplemental material
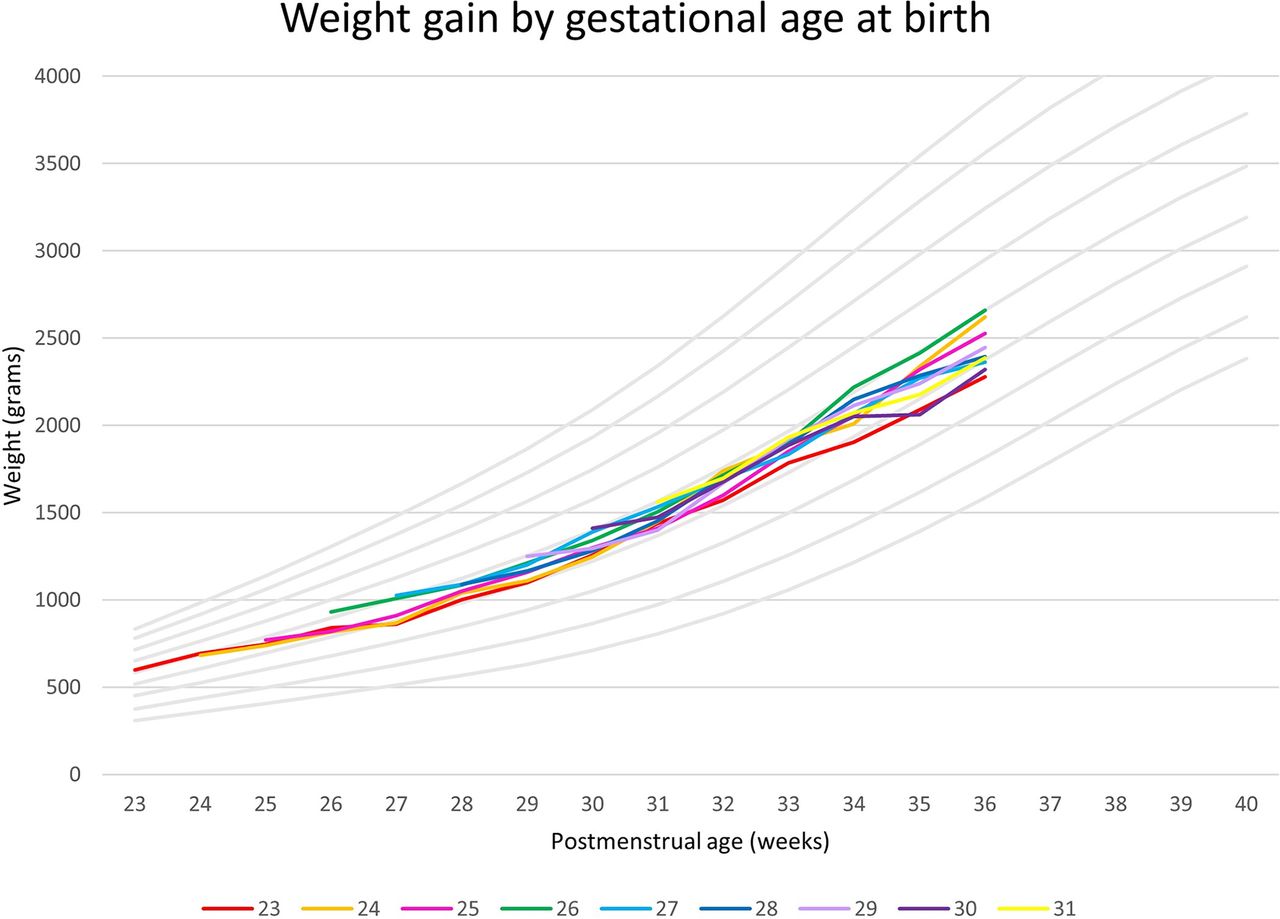
Weight median plots by gestation at birth superimposed on Neonatal and Infant Close Monitoring reference centile lines.
Weight SD scores (SDS) at birth, 36 weeks postmenstrual age (PMA) and change in SDS (95% CI) from birth to 36 weeks PMA for all infants, female-only and male-only infants (only infants who were still inpatient at 36 weeks PMA and beyond are included in this analysis)
Figure 2 shows the median HC plots for both sexes. Separate plots for males and females are shown in online supplementary file 2. Each GA subgroup is overlaid on the standard NICM chart. For infants born at 27 weeks GA or greater, HC ΔSDS from birth to 36 weeks PMA were positive (table 3). All subgroups born at 26 weeks GA or less displayed a negative in HC ΔSDS from birth to 36 weeks PMA. Overall, the mean HC ΔSDS between birth and 36 weeks PMA was 0.09 (95% CI −0.14 to 0.33). Figure 3 shows the median length plots for both sexes, with separate plots for males and females shown in online supplementary file 3. Each GA subgroup is overlaid on the standard NICM chart. Length measures showed a negative ΔSDS from birth or 25 weeks to 36 weeks PMA in all gestations, with an overall mean length ΔSDS between birth and 36 weeks PMA of −0.49 (95% CI −0.67 to −0.30; see table 4). Graphs were also created using only data for infants who remained in the NNU from birth until 36 weeks PMA. These had a similar pattern to those that included all infants (data not shown).
Supplemental material
Supplemental material
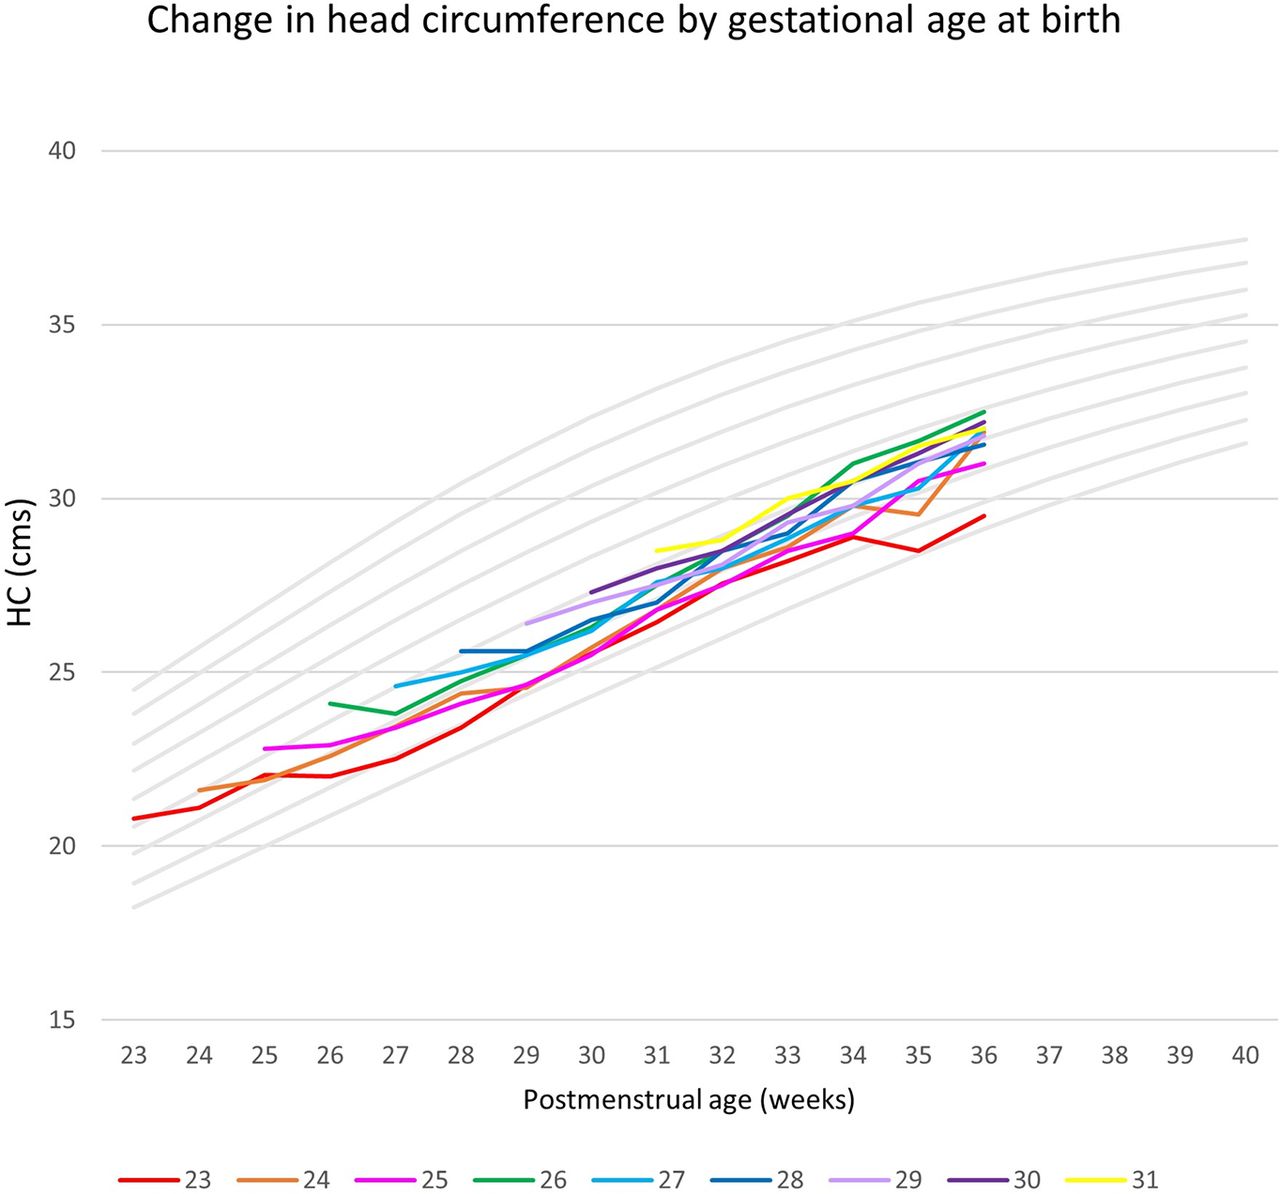
Head circumference (HC) median plots by gestation at birth superimposed on Neonatal and Infant Close Monitoring centile lines.

Length median plots by gestation at birth superimposed on Neonatal and Infant Close Monitoring centile lines.
Head circumference SD scores (SDS) at birth, 36 weeks postmenstrual age (PMA) and change in SDS (95% CI) from birth to 36 weeks PMA for all infants, female-only and male-only infants (only infants who were still inpatient at 36 weeks PMA and beyond are included in this analysis)
Length SD scores (SDS) at birth (or 25 weeks), 36 weeks postmenstrual age (PMA) and change in SDS (95% CI) from birth to 36 weeks PMA for all infants, female-only and male-only infants (only infants who were still inpatient at 36 weeks PMA and beyond are included in this analysis)
Discussion
This study demonstrates that growth failure in preterm infants, with a fall across marked centile lines during the first few weeks of life, is not inevitable. We have plotted the growth of preterm infants cared for in a tertiary NNU with nutritional practices aimed at optimising intake and growth and shown that these infants can follow growth trajectories similar to standards based on intrauterine growth. Growth failure has previously been defined in preterm infants as dropping two marked centile lines. This definition of growth failure was not met by 88% of this cohort, and there was no early weight loss in any of the subgroups.
Preterm infants are currently plotted on growth charts constructed from cross-sectional birth weight data with the assumption that tissue accretion at a rate similar to the preterm infants’ intrauterine counterparts is an appropriate target. However, to date, other depictions of extrauterine longitudinal growth have not borne this out as commonly achievable,10 11 15 with the literature generally describing an initial weight loss across centile lines without recovery.10 11 16 Ehrenkranz et al 10 plotted the growth of 1660 US infants born at less than 30 weeks gestation on the Fenton growth chart, showing a fall down across centile lines over the first few weeks of life with growth trajectories that were divergent from the Fenton standards.10 More recently, in 2014, Cole et al described the longitudinal weight gain of 5009 infants born below 32 weeks’ gestation. They noted a downward crossing of marked centile lines in all gestations over the first 2–3 weeks of life, with an absolute postnatal weight loss following birth in infants born after 29 weeks’ gestation.11 Cole et al also noted that by 40 weeks PMA, weight SDS for infants born below 32 weeks’ gestation was more than one SD below that of the mean for term born infants with growth trajectories towards term that were downwardly divergent away from marked centiles.11 A potential issue with these studies is that they use cohorts where the quality of nutritional care is unknown or not specified, which may account for the pattern of growth seen. The INTERGROWTH-21st study recently sought to address this by developing growth standards based on the growth of otherwise healthy preterm infants who received nutritional care in accordance to standardised guidelines. The authors of the study asserted that it is perhaps not appropriate to expect preterm infants to mimic fetal growth,9 and use of the resulting INTERGROWTH-21st growth standards would subsequently reduce the diagnosis of extrauterine growth restriction.9 However, while the INTERGROWTH-21st infants received standardised nutritional care, the extent to which this was optimal is not known. Questions still remain regarding both what can and should be achieved in terms of the growth of preterm infants.
The present study describes a different initial growth velocity in preterm infants, specifically no weight drop in the first 1–2 weeks of life in the cohort 29–31 weeks and a much reduced SDS drop in infants born <29 weeks. The weight gain and change in SDS depicted here demonstrate that early growth failure is not inevitable in preterm infants.
The optimal growth pattern for preterm infants is not known; weight velocity, body composition and growth during childhood are all known to impact on non-communicable disease risk in later life.21–23 Aiming for the steepest growth velocities in early life, in particular catch-up growth, has potential associated drawbacks including increased incidence of adverse cardiovascular and metabolic outcomes.23–25 There is a paucity of data regarding early preterm infant growth patterns that are ideal for later metabolic outcomes.26 The pattern of growth demonstrated in this study, with infants achieving appropriate growth along centile lines, may be beneficial as it avoids the need for catch-up growth and so could potentially have a positive influence on the risk of non-communicable diseases in later life. Furthermore, improvements in growth in the early neonatal period may improve other outcomes such as chronic lung disease, retinopathy of prematurity and neurodevelopment.27–30
Further work is required to determine the patterns of nutrient intake and growth in preterm infants during the neonatal period required for optimal long-term neurodevelopmental outcome and risk of non-communicable disease in later life. Accurate, practical measures of body composition are also needed to help understand the accretion of fat and fat-free tissue in response to these patterns of nutrition and growth. Simple bedside measures of body composition (such as mid-upper arm circumference and mid-thigh circumference) may be of some use.31
The depiction of preterm weight gain described here follows the introduction of a new nutrition guideline and practices introduced locally.19 These emphasise early feeding and early commencement of parenteral nutrition. In a previous study of infants cared for during the first 18 months following the introduction of these practices, infants received a mean daily intake of 120 kcal/kg/day and 3.34 g/protein/kg/day.19 Although reasonable, it remains below recommended intakes for preterm infants, perhaps explaining why the head and length growth seen in this study remained suboptimal. Senterre and Rigo demonstrated a reduction in the negative weight ΔSDS in preterm infants who had not developed a cumulative nutritional deficit following improved nutritional practices.32 This supports the position that with appropriate nutrition, it is possible to attenuate growth failure in early life.
A limitation of our study is that it uses only data from a single centre, with a relatively small number of infants at higher PMAs and relatively small number of extremely premature infants born between 23 and 24 weeks GA. This is reflected in some of the variability between groups and wide CIs, with lines diverging as infants approach term equivalent age, reflecting discharge and transfer of infants. The graphs displayed show plotted median lines involving repeated measures of infants on top of a growth chart constructed from cross-sectional data. Although this represents a limitation in our data analysis, it is a useful way of visualising the data. A strength of the study is that all of the infants were managed and measured according to standard protocols. A longer follow-up period up to and beyond term equivalent age would allow the more accurate conclusions to be drawn from data collected at later gestations. In addition, repeating the present study in a larger cohort using contemporaneous multicentre or national data, together with longer-term outcomes, would be beneficial in understanding the impact of improvements in nutritional care on a national level, and inform future practice.
Conclusion
In this cohort, we have demonstrated that early postnatal growth failure in preterm infants is not inevitable. This challenges previously published longitudinal growth data pertaining to longitudinal weight gain in preterm infants. Our work suggests that an emphasis on improved nutritional care based on current recommendations enables preterm infants to grow along centile lines from birth. Further work in larger national cohorts is required to establish current growth patterns for preterm infants and should be coupled with body composition analysis alongside conventional anthropometry. There is also a need to understand the relationship between early postnatal growth and longer-term outcomes in this population.
Acknowledgments
We would like to acknowledge the support of all the staff on Southampton neonatal unit for their commitment to the nutritional care of the infants on the neonatal unit. We would also like to acknowledge Dr Alison Leaf, who helped develop and implement the changes in nutritional care on the neonatal unit that preceded this study.
References
Footnotes
Contributors MJJ, RMB, JJA and FP conceptualised and designed the study and reviewed and revised the manuscript. ETA conceptualised and designed the study, performed the data analysis, drafted the initial manuscript, and reviewed and revised the manuscript. All authors approved the final manuscript as submitted and agree to be accountable for all aspects of the work.
Funding MJJ and RMB are supported by the National Institute for Health Research through the NIHR Southampton Biomedical Research Centre. JJA is funded by an Action Medical Research Training Fellowship. This study was also supported by the European Society for Pediatric Research and National Institute for Health Research.
Competing interests None declared.
Patient consent Not required.
Provenance and peer review Not commissioned; externally peer reviewed.