Article Text

Abstract
Objectives Construct updated birth weight-for-gestational age centile charts for use in the UK and compare these to the currently used UK-WHO charts.
Design Secondary analysis of national birth data.
Participants Centiles were constructed using 1 269 403 singleton births occurring in England and Wales in 2013–2014 as part of the MBRRACE-UK national perinatal surveillance programme. These were then validated using 642 737 singleton births occurring in England and Wales in 2015.
Main outcome measures Sex-specific birth weight-for-gestational age centiles. Centiles were created using the lambda-mu-sigma method via the GAMLSS package in R. This method transforms the skewed birth weight distribution to approximate a normal distribution, allowing any birth weight centile to be produced.
Results The new centiles performed well in the validation sample, with the observed and expected proportion of births below a given centile in agreement. Overall, driven by the predominance of term births, the UK-WHO charts classify a smaller proportion of infants as below a given centile. For example, the UK-WHO estimates classified only 1.32% (8035/606 430) of term infants born in 2015 as below the second centile, compared with 1.97% (11 975/606 430) using the new MBRRACE-UK centiles. At the earliest gestational ages, however, the opposite is observed, with the UK-WHO classifying a larger proportion of infants as below a given centile, particularly at the lower end of the birthweight distribution.
Conclusions We have constructed and validated updated birth weight-for-gestational age centiles using a contemporary sample of births occurring in England and Wales. The benefits of these updated centiles will be first to assist the national surveillance of perinatal mortality programme by improving the identification of the proportion of stillbirths and neonatal deaths affected by intrauterine growth restriction and, second, to aid clinicians by more accurately identifying babies who require increased monitoring in the period immediately following birth.
- birth weight
- gestational age
- charts
- UK-WHO
This is an open access article distributed in accordance with the Creative Commons Attribution Non Commercial (CC BY-NC 4.0) license, which permits others to distribute, remix, adapt, build upon this work non-commercially, and license their derivative works on different terms, provided the original work is properly cited and the use is non-commercial. See: http://creativecommons.org/licenses/by-nc/4.0/
Statistics from Altmetric.com
What is already known on this topic?
The birth weight charts used in the UK are based on data collected between 20 and 30 years ago.
Medical, social, legislative and demographic changes since this time may likely mean these previous charts may not represent the distribution of birth weights in the UK.
What this study adds?
We have updated national birth weight charts using data from almost 1.3 million births and validated them on a sample of almost 650 000.
The updated centile charts showed marked differences at early gestations from those charts in standard practice in the UK.
We have provided a contemporary and nationally representative tool to more appropriately identify the proportion of stillbirths and neonatal deaths affected by intrauterine growth restriction.
Furthermore, these new charts offer more accurate identification of the cohort of babies who may require increased monitoring for conditions such as hypoglycaemia.
Background
Birth weight is a key measure of infant health providing an indication of prenatal well-being, risk of postnatal complications and survival.1 Standard low birthweight cut-offs such as 1500 g or 2500 g are too crude to be clinically useful risk predictors in high-income settings with birth weight for gestational age being more informative. Centile reference charts depicting smoothed birth weight curves across gestational age are routinely used to assess birth weight for gestational age in clinical practice. Particular attention is focused on those babies whose birth weight is at either extreme of the centile distribution to identify babies at increased risk of severe complications such as hypoglycaemia who require increased monitoring.
The ‘UK90’ birth weight centile charts published in 19952 are used widely in the UK. In 2009, new UK-WHO centile charts were introduced for growth from 0 to 4 years (the UK-WHO charts); however, it was necessary to retain the former UK90 references for assessment at birth as did the WHO charts omit preterm births and the WHO mean birth weight for term births was significantly lower than the UK3 mean.
An important consideration in the production of reference charts is the derivation of the population on which the charts are constructed. The UK90 charts were estimated using a sample of approximately 9500 White British babies, from five separate studies2 based mainly in East Anglia and conducted between 1983 and 1994. The amalgamation of these studies created a biased population sample with few preterm births (eg, only n=426 of the babies born were between 32 and 36 weeks’ gestation).4 These births are unlikely to robustly represent contemporary UK births given the medical, social and legal changes which have occurred over the intervening years. Notably, there have been changes in viability at earlier gestations over this time, with an increase in survival of births before 28 weeks’ gestation which influences the denominator of births included to calculate the centiles. This change was reflected in the change in the law on the registration of stillbirths in 1992 to include infants from 24 weeks rather than 28 weeks’ gestational age.
The identification of the proportion of stillbirths and neonatal deaths affected by intrauterine growth restriction (IUGR) is a critical aspect of the national surveillance and reporting of stillbirths and neonatal deaths. IUGR was identified as an important factor in deaths of the sample of term antepartum stillbirths included in the recent MBRRACE-UK confidential enquiry.5 The construction of up-to-date centile charts will enable both the estimation of the impact of IUGR across all stillbirths and neonatal deaths and the quantification of the effect that growth monitoring during pregnancy might have on efforts to reduce the national perinatal mortality rate.
Data for all singleton births in England and Wales during 2013 and 2014 (over 1.3 million births) were used to develop birth weight centile charts and were validated using 2015 births data. These charts were then compared with the UK-WHO references to investigate the potential effects of changes in both birth weight in the UK and the centile distribution in the UK-WHO charts since the original data were collected.
Methods
Data were obtained for all singleton births from 1 February 2013 to 31 December 2014 in England and Wales from the NHS Numbers for Babies (NN4B) data set. These data were linked to information about stillbirths reported to MBRRACE-UK, to identify whether stillborn babies were alive at the onset of care in labour. Babies were only included in the analyses if they were known to be alive at the onset of care in labour and born at 24+0 to 42+6 weeks’ gestational age. Babies were excluded if sex or birth weight was not recorded or undefined, or if the birth weight was considered implausible. An implausible birth weight was defined as being greater than 5 SD from the median birth weight for their gestational age and sex.
In men and women separately, the lambda-mu-sigma (LMS) method was used to estimate the new birth weight centiles6 and was implemented using the GAMLSS package (assuming birth weight has a Box-Cox Cole and Green distribution) in R V.3.2.3, as recommended by the WHO.7 This approach transforms the skewed distribution of birth weights to an approximate normal distribution by estimating and applying the L (Box-Cox power), M (median) and S (coefficient of variation) parameters. In order to identify the optimum number of effective df (edf) for the penalised spline models required to obtain the smoothed L, M and S curves (over gestational age), the automated ‘pb’ function was used, with gestational age transformed to the log scale. The ‘pb’ function uses local maximum likelihood estimation to automatically select the edf which result in the best fitting model. Accordingly, the obtained edf for the L, M and S parameters were 6.2, 15.8 and 12.1, respectively, for men and 5.6, 15.3 and 11.6 for women.
The smoothed values of L, M and S were then used to transform the observed distribution of birth weight to a standard normal distribution. With these LMS values, any birth weight centile can then be generated at any gestational age using the formula:

where  is the normal equivalent deviate corresponding to a given centile. LMS values were exported from R and the final centile charts were plotted using Stata/IC V.14.
After creating the new centiles using data from 2013 and 2014, we validated them using data from all singleton births in England and Wales in 2015 using data from the Personal Demographic Service which replaced the NN4B data in 2015. In particular, we identified the percentage of births below the set of standard centile thresholds, both overall and by gestational age group: <32 weeks (very preterm, VPT); 32–36 weeks (late and moderate preterm, LMPT); and >36 weeks (term). For example, if the derived centiles perform well, 2% of birth weights should fall below the second centile. To compare the performance of the new centiles with those of the UK-WHO, we conducted the same analysis using the UK-WHO centiles (using the published LMS values used to produce the UK-WHO charts4) and compared the proportion of births below a given centile, summarised as a relative risk.
In clinical practice, birth weight centiles are used to aid decision-making about the postdelivery management of high-risk births, for example, the UK-WHO charts have the 0.4th, 2nd, 9th, 25th, 50th, 75th, 91st, 98th and 99.6th centiles as the default centiles, each spaced 0.67 SD scores apart, as per the standard format proposed by Cole.8 We therefore investigated the potential impact of using the new centiles to identify babies born below the 2nd/9th (babies with potential growth restriction) and 98th/91st (babies potentially exposed to undiagnosed and diagnosed gestational diabetes) centiles which are frequently used criteria for identifying babies at risk of hypoglycaemia. We compared the number of cases identified using the new centiles against the number identified using the current charts.
Patient involvement
No patients were involved in the development of the research question or the design and conducting of the study.
Results
Creation of the centile charts
A total of 1 284 112 singleton births were included who were known to be alive at the onset of care in labour and born at 24+0 to 42+6 weeks’ gestational age. One per cent of births were excluded due to: undefined sex or missing information on the baby’s sex (n=80); missing birth weight (n=14 513); or implausible birth weight (n=116), leaving a total of 1 269 403 in the analysis.
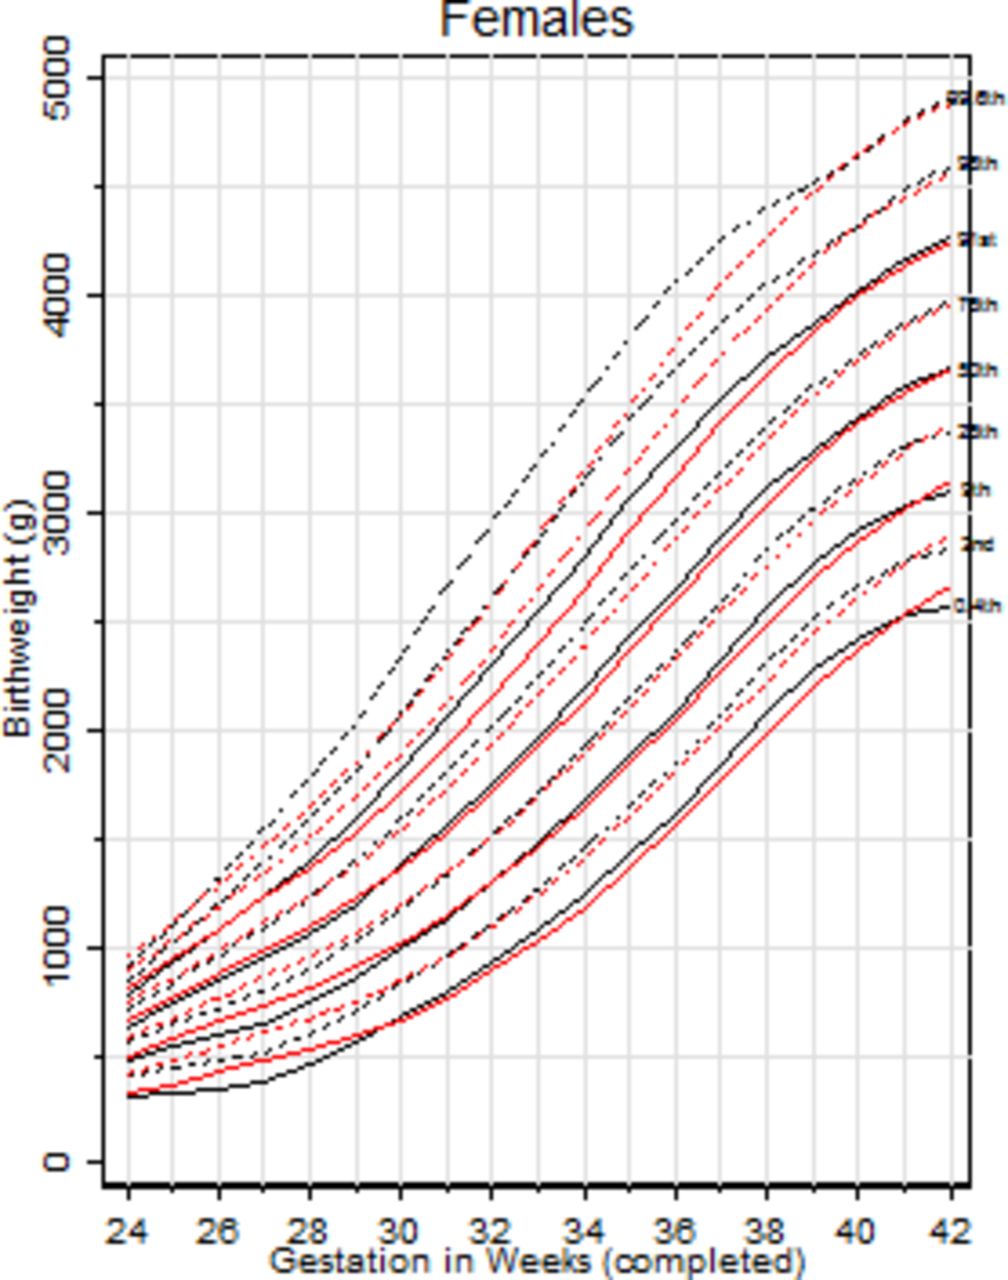
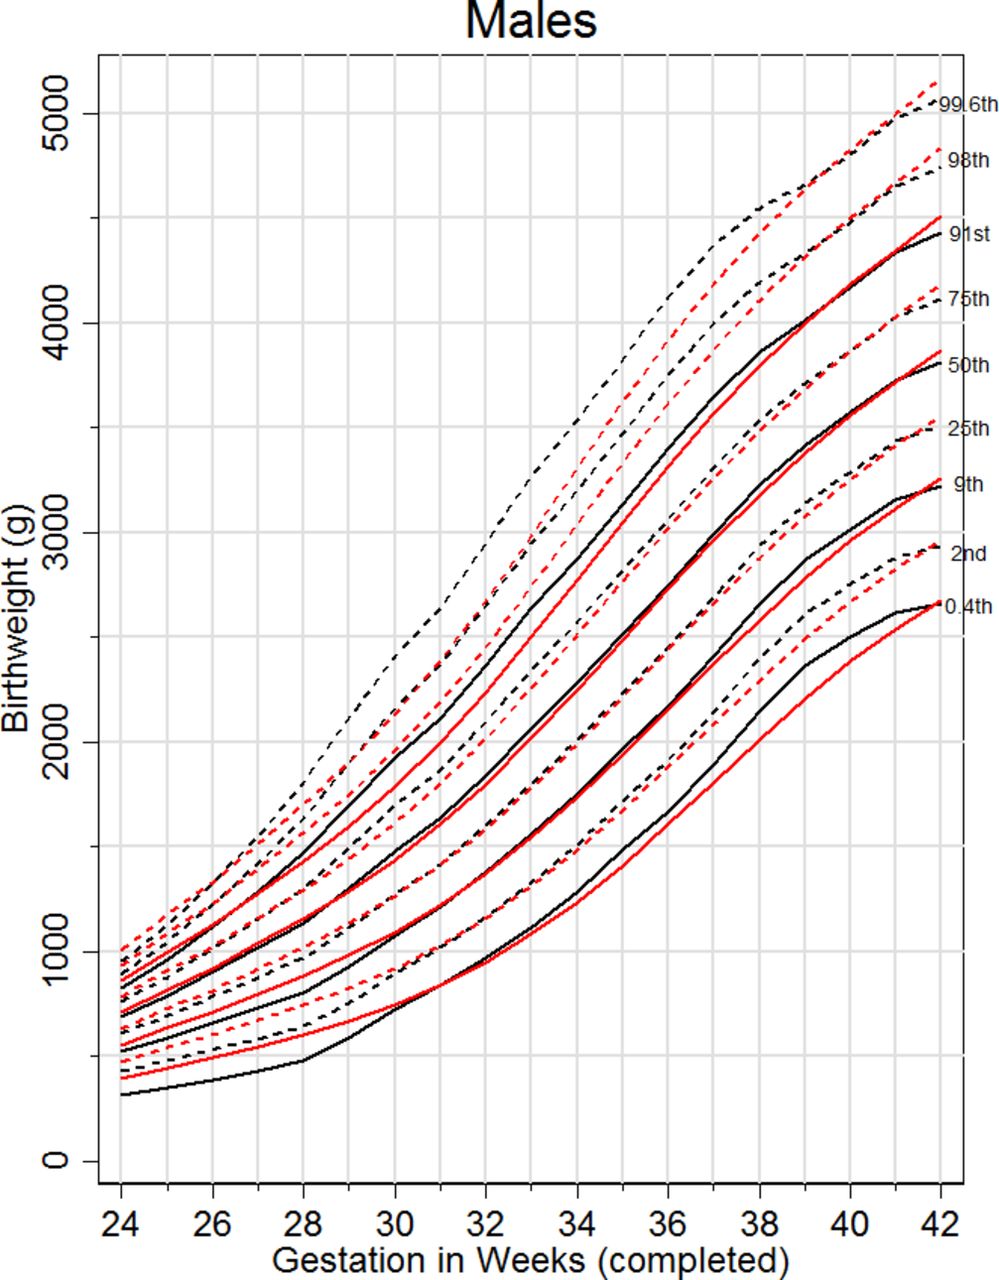
The LMS parameters were estimated (online supplementary table 1) and these allow estimation of any specified centile using the formula provided. Estimated centile charts were produced for men (figure 1) and women (figure 2) showing the 0.4th, 2nd, 9th, 25th, 50th, 75th, 91st, 98th and 99.6th centiles. Online supplementary tables 2–4 show the performance of the centiles in the 1 269 403 infants who were used to construct the charts. For example, looking at the 2nd and 98th centiles in online supplementary table 2, it can be seen that the new centiles classified 2.34% of men and 2.31% of women as below the second centile (expected percentage=2.28%) and 2.46% and 2.46% of men and women, respectively, as above the 98th centile (expected percentage=2.28%).
Supplementary file 1

MBRRACE-UK derived (black) and UK-WHO centiles (red) birth weight centile charts for men born in 2013–2014 in England and Wales.
MBRRACE-UK derived (black) and UK-WHO centiles (red) birth weight centile charts for women born in 2013–2014 in England and Wales.
Validation of the centile charts and comparison with the UK-WHO charts
The centile charts were validated using 642 737 (male: n=329 976 (51.34%)) singleton births, known to be alive at the onset of care, occurring in England and Wales in 2015. Tables 1 and 2 show that in both men and women, the new centiles performed well, with a similar proportion of infants classified as below each centile to the expected. For example, the new centiles classified 2.03% (13 067/642 737) of infants below the 2nd centile and 97.44% (626 293/642 737) as below the 98th.
Expected and observed percentage (n) below selected centiles: very preterm, late-to-moderate preterm, term: MBRRACE-UK vs UK-WHO (males)
Expected and observed percentage (n) below selected centiles: very preterm, late-to-moderate preterm, term: MBRRACE-UK vs UK-WHO (females)
Whilst the gestation-specific median birth weights produced using the UK-WHO estimates and the new estimates do not differ greatly in absolute terms (<4.6% difference, online supplementary table 6), the UK-WHO charts did not perform as well, particularly at the extremes of the birth weight and/or gestational age distributions. Overall, as a result of the high proportion of infants born at term, the UK-WHO charts classify a smaller proportion of infants as below a given centile (tables 1 and 2).
When stratified by gestational age group, however, the pattern is different. In those born VPT, the UK-WHO estimates generally produce higher birth weights than those observed in our sample (especially at the lower end of the birthweight distribution), and thus identify a greater proportion of infants falling below a given centile, compared with the newly generated centiles (figures 1 and 2, tables 1 and 2, and online supplementary tables 5–7). For example, the UK-WHO charts classified a further 66 (49 males + 17 females) and 139 (71 males + 68 female) infants as below the second and ninth centiles, respectively. This is reflected in the increased risk of being classified as below the 0.4th, 2nd, 9th and 25th centiles by the UK-WHO charts, in the VPT group.
Thereafter, at over 32 weeks gestation the UK-WHO estimaes generate lower birth weights than those observed in our sample, thus identifying a smaller percentage of infants below a given centile (as shown in figure 1 and tables 1 and 2 and online supplementary tables 5–7). This is particularly apparent at the lower end of the birth weight distribution, with the UK-WHO identifying 147 (72 males and 75 females) less LMPT infants and 3,988 (2402 males + 1586 females) less term infants as below the 2nd centile. Similarly at the 9th centile, the UK-WHO classifies 266 (113 males + 153 females) fewer LMPT infants and 10,929 (6,157 males + 4,772 females) fewer terms infants compared to the new centiles, both of these differences resulting in notably reduced risks when using the former charts. At the other extreme of the birth weight distribution, the fact that the UK-WHO estimates generated lower birth weights than those based on the new estimates resulted in a greater number of infants being identified as above a given centiles, using the former charts. For example in the LMPT group, the UK-WHO charts identified 1,163 and 605 more infants as above the 91st and 98th centiles, respectively.
Discussion
We have used a large routinely available data set of all births in England and Wales to produce new up-to-date birth weight-for-gestational age centile charts. These updated centiles from births occurring in 2013 and 2014 provide a more valid tool with which to assess fetal growth. In particular, they provide a contemporary and nationally representative tool with which to more appropriately identify the proportion of stillbirths and neonatal deaths affected by IUGR for the analysis of the national perinatal mortality surveillance data. There are also potential implications for use in clinical practice, as the implementation of these new charts offers more accurate identification of the cohort of babies who require increased monitoring in the period immediately following birth for conditions such as hypoglycaemia. This is especially the case in those born at the earliest gestational ages and those born at the lower end of the birth weight distribution, where notable differences were observed between the new and the UK-WHO centile charts.
Whilst previous charts based on extremely limited data performed relatively well, with the median birth weights estimated by each chart differing by no more than 76 g, the new centile charts showed marked differences at early gestations from those charts in standard practice in the UK. Use of a large unbiased national database facilitated the development of these charts potentially providing a more robust sample and stable model. These changes may also reflect temporal changes in the views on viability where a birth at 24 weeks is now more likely to be registered as a live birth than 20 years ago. Historically, all stillbirths were removed from birth weight analysis leading to an overestimation of birth weight, particularly at early gestations.9 In the original UK90 birth weight charts and subsequent WHO charts, ‘fresh stillbirths’ were included from the Northern Region study10 and in this analysis, we have included all births alive at the onset of care in labour which by definition includes intrapartum stillbirths. The law (Births and Deaths Registration Act 1953) was changed in 1992 to modify the gestational age threshold for the definition of a stillbirth from 28 to 24 weeks. This has had an impact on the populations included in these different studies potentially causing the differences in VPT low centiles. Similarly, increased survival of the smallest babies and changes in practice over the registration of live births may have caused the slight decrease in average birth weight seen at the extremes of the centile charts. Furthermore, whereas the former charts excluded ethnic minority groups, we made no such exclusions. While this will likely lead to differences in the birth weight distribution, this nevertheless is a more appropriate reflection of the birth population of England and Wales. The changes in the centile distribution at early gestations will have clinical implications. For example, in those born VPT the new centiles will identify a substantially smaller annual number of infants falling below the second and ninth centiles (second centile: 141 (2.85%) vs 207 (4.18%); ninth centile: 431 (8.70%) vs 570 (11.51%)) with consequent effects on the considerations of these babies’ likely clinical course and viability.
At later gestational ages, the opposite phenomenon was observed, with higher birth weight estimates at the lower centiles compared with the UK-WHO charts. The use of these new centiles therefore identified a greater number of infants who are in potential need of immediate monitoring after birth and who would have been missed when using the former UK-WHO charts. Taking the second centile, for example, which is currently under consultation for inclusion in the British Association of Perinatal Medicine’s (BAPM) ‘Hypoglycaemia Framework for Practice’, the new centiles identified a further 4,069 infants a year across the gestational age distribution, in this category. While this represents a risk difference of only 0.63%, this would represent a big increase in the number of infants that would be followed up. A recent review of litigation claims made to the NHS (totalling £162 166 677) for injury secondary to neonatal hypoglycaemia found that in 71% of claims, there was a failure to make an adequate assessment of risk factors, including birth weight.11 The authors recommend the use of the BAPM Newborn Early Warning Trigger and Track chart for examining the adequacy of intrauterine nutrition and refer to the inclusion of a table of second centile birth weights for identifying infants at risk. Given the differences in the former and newly constructed centiles, we suggest the use of these newly updated charts. Conversely, the new centiles identified a smaller number of infants born with a high birth weight (eg, above the 91st and 98th centiles) and thus a smaller group of infants who may merit increased surveillance for risk of hypoglycaemia. There is of course a degree of controversy regarding the groups (ie, which centile), at both ends of the centile range, who merit additional monitoring but the new centiles offer a far more precise definition of individual centiles and the potential to audit the rate at which hypoglycaemia actually occurs.
Recently, charts for estimated fetal weight (EFW) have been advocated for use in clinical practice,12 which have the benefit of having a larger sample size from which to derive centiles at the earlier gestational ages. However, birth weight should not be directly compared with EFW at these gestational ages,13 as a large proportion of infants born preterm are associated with factors that affect fetal growth, resulting in an over-representation of those with a low birth weight at these earlier gestational ages.14 15 Any comparison to centiles derived on those remaining in utero is inappropriate in terms of planning clinical care as the two populations (those who deliver and those where the pregnancy continues) are quite different. Furthermore, there is a degree of error associated with the estimation of fetal weight, with more or less error depending on which EFW formula is used.16
Strengths and limitations
Previous centiles have been generated from a combination of small samples of selected births at different gestational ages. The centile charts presented here are based on a contemporary total birth cohort of nearly 1 300 000 births in England and Wales, ensuring consistency in population terms across all gestations. Furthermore, as the data are based on statutory birth and death registrations, we are confident of the completeness of the data set. For the data at 32–36 weeks’ gestation, we have a considerably richer data source (n=61 449) compared with that used to develop the original UK90 (n=426), and subsequent WHO charts. The latter was acknowledged as a limitation in the construction of the UK90 centiles, noting that this group was under-represented.4 In reality, however, the UK90 centiles were not far from these new centiles. Sample size differences are also notable at the lowest gestational ages (eg, n=72 previously vs n=731 currently at 24 weeks). We do acknowledge however that we may still have underestimated the contribution of low birth weight infants at the earliest gestations as these are likely to have been over-represented in the infants with missing data. We only included babies known to be alive at the onset of care in labour (excluding antepartum stillbirths) with 354 babies missing data for this variable which were assumed to be antepartum stillbirths; however, we acknowledge that at the earliest gestations it is sometimes difficult to classify stillbirths as antepartum versus intrapartum, which may have led to the exclusion of a small number of eligible infants alive at the onset of care as they were deemed to be antepartum stillbirths. We have not removed infants who died due to major (lethal) congenital anomalies from our work due to inconsistent recording in 2013 and the small number they are likely to have contributed to our overall sample.
We found encouraging results when these new centiles were validated on over half a million singleton births in 2015. Future work should, however, continue to assess the validity of their use on an ongoing basis.
Conclusion
These updated centiles, based on a large sample, provide a contemporary and nationally representative tool with which to more appropriately identify the proportion of stillbirths and neonatal deaths affected by IUGR on a population basis. Furthermore, as birthweight centiles are increasingly used in clinical practice to prevent hypoglycaemia in mature babies and are an important part of the routine assessment of preterm babies, these new centile charts also have clinical utility. The current birth weight centiles which are in use in the UK, but which were developed around 30 years ago, may be misleading particularly in relation to the identification of mature babies at risk of hypoglycaemia. We suggest these updated centiles will ensure the accurate identification of babies at high risk of such complications. This may lead to improved outcomes in the future for these babies. Finally, these new references will also serve as important tools for both national and international researchers who wish to standardise their own data to a representative and contemporary cohort of births in the UK.
An electronic version of these centile charts is currently under construction. This interactive tool will enable healthcare professionals to quickly and reliably calculate an infant’s exact birth weight centile and thus identify infants who may require further monitoring.
Acknowledgments
NN4B and PDS data were obtained by MBRRACE-UK from the Health and Social Care Information Centre, now known as NHS Digital. © 2016, reused with the permission of The Health & Social Care Information Centre. All rights reserved.
References
Footnotes
Contributors SES, BNM, DF, ESD and LKS conceived the study, provided intellectual input, interpreted the results and helped revise the manuscript. TN performed the analysis and drafted the initial version of the manuscript. PNB and JJK provided intellectual input, interpreted the results and helped revise the manuscript. All authors approved the final version of the manuscript and agreed to be accountable for all aspects of the work in ensuring that questions related to the accuracy or integrity of any part of the work are appropriately investigated and resolved.
Competing interests None declared.
Provenance and peer review Not commissioned; internally peer reviewed.