Article Text

Abstract
Background Studying centre-to-centre (CTC) variation in mortality rates is important because inferences about quality of care can be made permitting changes in practice to improve outcomes. However, comparisons between hospitals can be misleading unless there is adjustment for population characteristics and severity of illness.
Objective We sought to report the risk-adjusted CTC variation in mortality among preterm infants born <32 weeks and admitted to all eight tertiary neonatal intensive care units (NICUs) in the New South Wales and the Australian Capital Territory Neonatal Network (NICUS), Australia.
Methods We analysed routinely collected prospective data for births between 2007 and 2014. Adjusted mortality rates for each NICU were produced using a multiple logistic regression model. Output from this model was used to construct funnel plots.
Results A total of 7212 live born infants <32 weeks gestation were admitted consecutively to network NICUs during the study period. NICUs differed in their patient populations and severity of illness.
The overall unadjusted hospital mortality rate for the network was 7.9% (n=572 deaths). This varied from 5.3% in hospital E to 10.4% in hospital C. Adjusted mortality rates showed little CTC variation. No hospital reached the +99.8% control limit level on adjusted funnel plots.
Conclusion Characteristics of infants admitted to NICUs differ, and comparing unadjusted mortality rates should be avoided. Logistic regression-derived risk-adjusted mortality rates plotted on funnel plots provide a powerful visual graphical tool for presenting quality performance data. CTC variation is readily identified, permitting hospitals to appraise their practices and start timely intervention.
- premature
- mortality
- variation
- benchmarking
This is an open access article distributed in accordance with the Creative Commons Attribution Non Commercial (CC BY-NC 4.0) license, which permits others to distribute, remix, adapt, build upon this work non-commercially, and license their derivative works on different terms, provided the original work is properly cited and the use is non-commercial. See: http://creativecommons.org/licenses/by-nc/4.0/
Statistics from Altmetric.com
What is already known on this topic?
Characteristics of infants admitted to neonatal intensive care units differ, and comparing unadjusted mortality rates should be avoided.
What this study adds?
Logistic regression derived risk-adjusted mortality rates plotted on funnel plots provide a powerful visual graphical tool for presenting quality performance data.
Centre-to-centre variation is readily identified, permitting hospitals to appraise their practices and start timely intervention.
Background
Advances in perinatal and neonatal care have significantly reduced neonatal mortality rates, especially among preterm and low birth weight infants.1 However, there is significant centre-to-centre (CTC) variation in mortality rates among neonatal intensive care units (NICUs).2–12 Studying CTC variation in mortality rates is important because inferences about quality of care can be made which permit changes in practice to improve outcomes.13 However, comparisons between hospitals can be misleading unless there is adjustment for differences in population characteristics and severity of illness.
Our aim was to report the risk-adjusted CTC variation in mortality rates for infants born at <32 weeks and admitted to all eight tertiary NICUs in the New South Wales (NSW) and the Australian Capital Territory (ACT) Neonatal Network (NICUS), Australia. Furthermore, we would like to show the benefits of adjusting CTC variation for population characteristics. NSW is the most populous state of Australia,14 and the ACT, home to the Government of the Commonwealth, is within NSW.
Methods
We analysed prospectively collected data from a geographically defined area. All infants who were delivered before 32 weeks of gestational age and admitted to one of the eight tertiary perinatal centres in NSW and the ACT between 1 January 2007 and 31 December 2014 were included in the study. Full descriptions of the NSW and ACT neonatal service organisation and networking, medical and nursing staffing of the collaborating NICUs are available elsewhere.15–18 Geographically, the ACT lies within NSW and the state and territory combined have a total population of 7904500 with approximately 106 007 live births per year.19
Data source
Data for this study were obtained from The Neonatal Intensive Care Units’ Data Collection, which is an ongoing prospective state and territory wide audit of infants admitted to all eight perinatal centres and two children’s hospitals in NSW and the ACT for one of the following reasons: (1) gestation 22+0 to 31+6 weeks; (2) birth weight ≤1500 g; (3) assisted ventilation (mechanical ventilation, continuous positive airway pressure, high flow humidified gas); (4) major surgery (opening of a body cavity); and/or (5) insertion of a central line, exchange transfusion and/or therapeutic hypothermia. Definitions and accuracy of the database have been described elsewhere.20 In Australia, it has been recommended by the National Health and Medical Research Council that wherever possible preterm birth at <33 weeks should occur in a perinatal centre that has the expertise to care for the woman and her preterm infant.21 In general, preterm infants born at <32 weeks in non-tertiary hospitals are transferred to tertiary centres by means of the Newborn and Paediatric Emergency Transport Service, a transport organisation that functions across the NSW/ACT region.16 17 Data from two tertiary children’s hospitals were not included in this study due to the low patient load (n=11) as retrieved premature infants were preferentially admitted to the eight perinatal centres instead of the two paediatric hospitals.18
Outcome measure
The study outcome was hospital mortality (death before discharge home). The principal causes of death were coded using the International Classification of Diseases and Related Health Problems, 10th Revision, Australian Modification.22
Because some conditions, seizures for example, are rarely the principal cause of death, we used a composite neonatal adverse outcome indicator (NAOI). NAOI has been validated previously.23
Statistical analysis
Statistical analyses were performed using SPSS (IBM, IBM SPSS Statistics for Windows, V22.0.0.0. Released 2013).
We performed a stepwise multiple logistic regression elimination analysis to establish the independent risk factors associated with mortality, after controlling for significant confounding factors (eg, ethnicity) in addition to other predictors (eg, gestational age) identified in other studies. In this multivariate model, we controlled for antenatal and perinatal variables but not intermediate variables (eg, intraventricular haemorrhage, retinopathy of prematurity, necrotising enterocolitis, chronic lung disease), as these may be related, directly or indirectly, to the quality of the management and might thus act as intermediate comorbidities through which the effect of ‘hospital’ is mediated.24
We used the multiple logistic regression to estimate the probability of hospital mortality after adjusting for potential confounding factors. Calibration was determined by means of Hosmer-Lemeshow goodness-of-fit χ2 test (high p value suggests better classification).25 The ability of the logistic regression model to discriminate between those who died in hospital and those who survived until discharge was summarised using the C-statistic. A C-statistic of 0.5 indicates that the model discriminates no better than chance alone, whereas a value of 1.0 indicates perfect discrimination.26 27
The probabilities of death within an NICU were summed to give the hospital’s expected rate of death. Risk-adjusted standardised mortality ratios (SMRs) for each hospital were then produced by dividing the observed number of hospital deaths by the expected number produced by the logistic regression model. The 95% CIs for SMR were calculated by using Miettinen’s modification as described by Rothman et al.28 The SMRs were used to calculate the adjusted mortality rates for each hospital.
We used funnel plots to provide visual indication to differentiate between two sources of variation, namely common-cause and special-cause variation, of risk-adjusted hospital mortality among NICUs.29 These plots test whether the rate of mortality of an NICU differs significantly from the network average rate, assuming only random sampling variation rather than bias influences the NICU’s rate. The overall network mortality rate is represented by a solid horizontal line while the ±95% (2σ) and ±99.8% (3σ) control limits are represented by the curved dotted lines. Assuming differences arise from random sampling variation alone, the chance of the hospital being within the limits is 95% for the inner funnel and 99.8% for the outer funnel.
The level of statistical significance for all analyses was set at p<0.05 using two-tailed comparisons. The significance level was not changed when multiple comparisons were performed.
Results
A total of 7212 live born infants <32+0 weeks gestation were admitted consecutively to one of the eight tertiary perinatal centres during the study period. Maternal and neonatal characteristics stratified by admitting hospital are shown in tables 1 and 2.
Maternal characteristics of the study group stratified by admitting hospital A to H
Neonatal characteristics of the study group stratified by admitting hospital A to H
The proportion of pregnancies and deliveries involving maternal hypertension, multiple birth, caesarean section and Apgar score <7 at 5 min varied between hospitals. Antenatal steroid was administered to 84.9% to 94.0% of neonates (table 1). Overall, 10.4% of the study population was born in non-tertiary hospitals (outborn). Median gestation at birth and birth weight were similar between hospitals ranging from 27 to 31 completed weeks and 910.0 to 1559.0 g, respectively. Use of surfactant and postnatal steroid showed higher variability between hospitals (table 2).
Observed and expected mortality and SMR
The observed and expected mortality and SMR stratified by admitting hospital are shown in table 3. The overall hospital mortality rate was 7.9% (n=572 deaths), and SMR was 1.02 (95% CI 0.94 to 1.11) (table 3). Hospital mortality rate varied from 5.3% in hospital E to 10.4% in hospital C. Similarly, expected mortality, SMR and risk-adjusted mortality varied between hospitals (table 3).
Neonatal mortality of the study group stratified by admitting hospital A to H
Figure 1 shows the observed mortality rates for all admitting hospitals stratified by gestational age at birth. Hospital C and E exceeded the +99.8% and −99.8% limits, respectively (figure 1A). When mortality was stratified by gestation, hospital C approached the +95% control limit for infants born at 23–26 weeks of gestation (figure 1B).

Funnel plot showing observed mortality rates in neonatal intensive care units in New South Wales and Australian Capital Territory between 2007 and 2014 for infants born at 23 to 31 (A), 23 to 26 (B), 27 to 28 (C) and 29 to 31 (D) weeks of gestation. Average, 95% and 99.8% lower and upper control limits are shown.
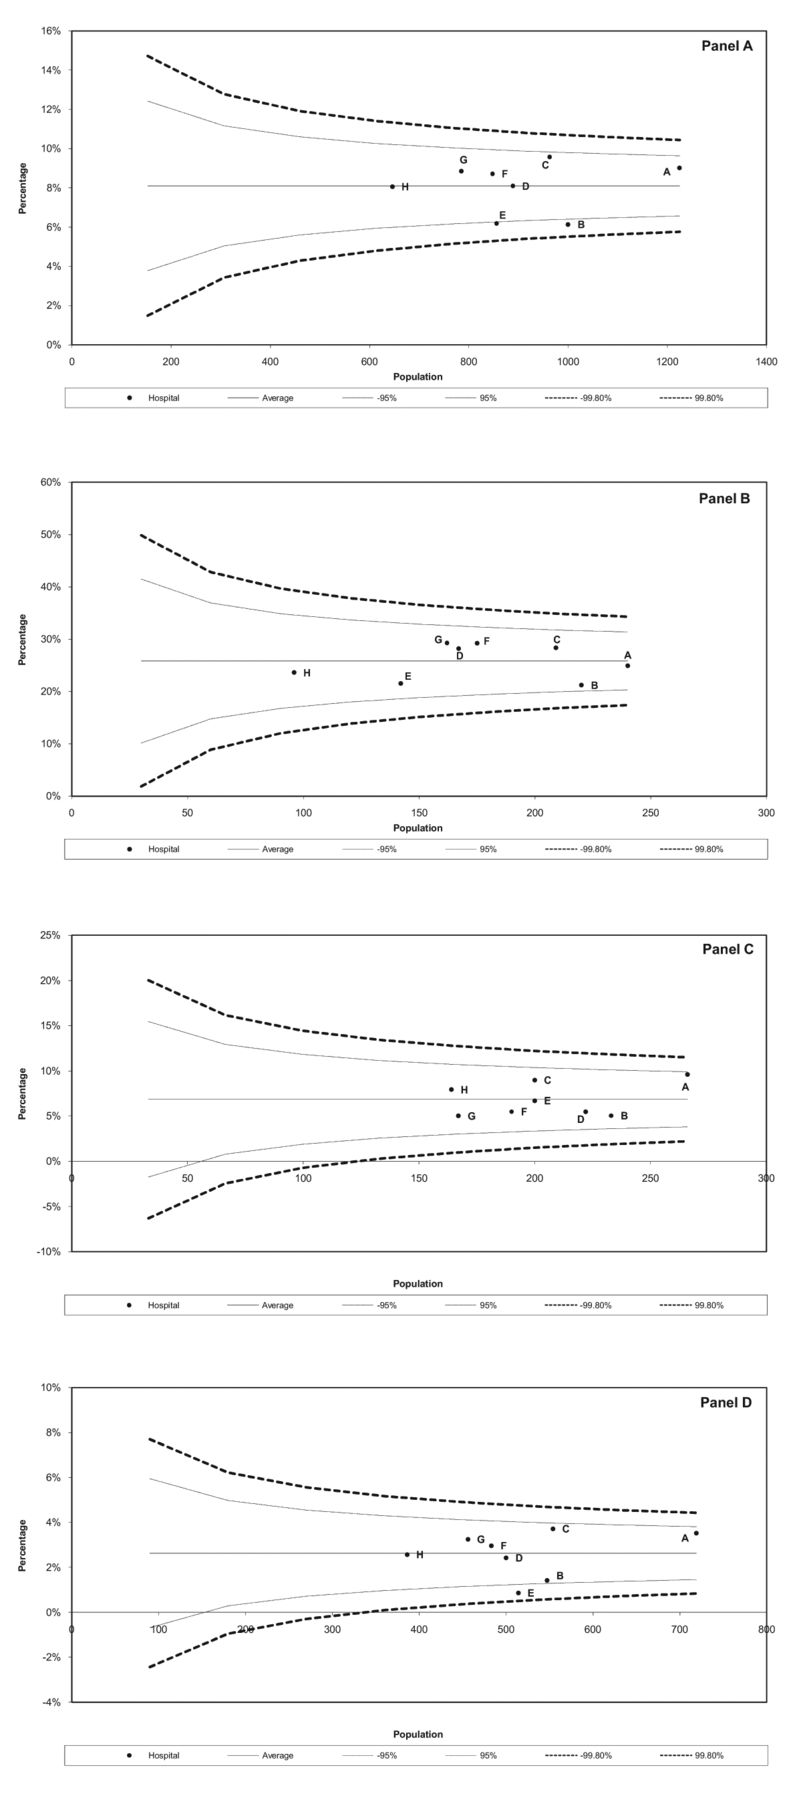
Figure 2 shows the risk-adjusted mortality rates for all admitting hospitals stratified by gestational age at birth. No hospital exceeded the ±99.8% control limits. Hospital C approached the +95% control limit for infants born at 23–31 weeks of gestation (figure 2A). Hospital B and E showed better outcome (ie, exceeding −95% control limit) for infants born at 23–31 weeks of gestation (figure 2A).

Funnel plot showing risk-adjusted hospital mortality in neonatal intensive care units in New South Wales and Australian Capital Territory for infants born at 23 to 31 (A), 23 to 26 (B), 27 to 28 (C) and 29 to 31 (D) weeks of gestation. Average, 95% and 99.8% lower and upper control limits are shown.
Predictors of mortality
Lack of antenatal steroid, antenatally diagnosed malformation, mode of birth, male gender, lower gestation, lower birth weight, Apgar score <7 at 5 min and lack of postnatal steroid were significant risk factors for mortality (online supplementary table S1). Of note is that postnatal steroid effect changed from unadjusted to the adjusted model. Postnatal steroid was associated with improved survival once other neonatal factors were adjusted for.
Supplementary file 1
Validation of the logistic regression model
The logistic regression model used to calculate expected mortality shown in table 3 showed an adequate overall discrimination with a C-statistic (SE) of 0.86 (0.01) (95% CI 0.84 to 0.87). The model fitted the data well (goodness-of-fit χ2 (7df)=5.828; p=0.560).
Causes of death
The most common causes of death are listed in (online supplementary table S2). Intracerebral and grades 3 and 4 intraventricular haemorrhage (136, 23.8%), sepsis (128, 22.4%), respiratory distress syndrome (85, 14.9%) and necrotising enterocolitis (61, 10.7%) were the most common causes of death.
Supplementary file 2
Discussion
There is a growing demand for accurate measures of performance variation between hospitals nationally and internationally. However, there is no consensus on what performance indicators should be monitored and how performance is best measured.30
This study showed that there is little CTC variability in mortality across NICUS Network, Australia. Overall, mortality rates were similar when case mix, severity of illness and number of admissions (NICU volume) were taken into consideration (figure 2).
Ongoing benchmarking of performance is critical for implementation and evaluation of quality improvement initiatives. Within neonatal networks, studying benchmarking results may help address significant variations within the network. This could be simplified by using adjusted measures and funnel plots as we have done. Funnel plots are a simple and powerful graphical method for discriminating between two types of variations. Variation between the units is categorised according to the action needed to reduce it,31 thereby guiding the appropriate action.32 33 Process variation is of two types: common (chance) and special (assignable) causes of variation. Common-cause variation, which is shown as data within the control limits of the chart, is intrinsic to the process. Reduction of common-cause variation requires fundamental changes in the underlying process.31 Special-cause variation, which is shown as out-of-control signals in the chart (ie, data point outside the ±99.8% limit), is the result of factors extrinsic to the process, and its reduction therefore requires identification of and action on the special causes.31 Opportunities for improvement in infrastructure and clinical practice could be drawn from hospitals operating below the lower −99.8% limit. In our study, no hospital showed special-cause variation. Detailed framework for improvement using process control is discussed elsewhere.34
Another advantage of using funnel plots is to use the +95% (2σ) control limits to encourage further investigation. Hospitals exceeding this limit should start early quality improvements to make sure the outcome does not become out of control. Similarly, opportunities for improvement in infrastructure and clinical practice could be drawn from hospitals operating below the lower −95% limit.
CTC variation similar to that which we observed has been reported from other countries including the USA and UK, Canada, Germany, Finland, Switzerland and Japan.2–12 The causes of this variation are difficult to ascertain from this study and deserve further consideration. However, others have suggested that variation could be related to illness severity, different attitudes and thresholds to limiting or withdrawing intensive care measures11 or different management styles among NICUs.2 3
This study has substantial strengths. It is one of the larger NICU network reports using validated data35 with standardised published definitions.36 All data were coded prospectively, enhancing reliability and accuracy. Our statistical approach is robust as it took case mix and NICU volume into consideration. Our data lacked certain information pertinent to neonatal outcomes, such as fetal compromise37 and sociocultural factors.38 Consequently, there is likely to be some residual confounding despite the high discrimination and goodness of fit of the logistic regression model. Delivery room deaths were not included in our database so we could not detect interhospital variation or determine causes for these deaths. Another limitation is that the maternal record is entered multiple times for ‘multiple and higher order infants’. Therefore, mothers of more than one premature neonate within the study frame appear more than once in table 1 and the number of mothers and neonates is equal (7212). As the data are de-identified, we are unable to account for this. But we believe, particularly given relatively low parity in Australia, that the number of mothers included more than once would be small in the 7-year study period.
Conclusion and policy implications
Our data showed trends of risk-adjusted CTC mortality variation with a large NICU network. Centre-specific factors other than differences in baseline demographics and NICU volume may be involved. There is an urgent need to delineate these factors. The approach presented in our paper should form the basis for action on neonatal mortality variation and could easily be employed in real or near real time to detect variation early to facilitate timely interventions. In addition, there is a need to study variation in the main morbidities and neurodevelopmental outcomes between these hospitals.
Acknowledgments
The authors thank the Directors, the New South Wales (NSW) and the Australian Capital Territory (ACT) Neonatal Network (NICUS) members and the audit officers of all tertiary units in supporting this collaborative study: NICUS, Dr Jennifer Bowen (Chairperson), Barbara Bajuk (Coordinator), Sara Sedgley (Research Officer); Canberra Hospital, Dr Hazel Carlisle (Director), Judith Smith; John Hunter Children’s Hospital, Dr Paul Craven (Director), Lynne Cruden, Alissa Argomand; Royal Prince Alfred Hospital, Dr Ingrid Rieger (Director), Dr Girvan Malcolm, Shelley Reid; Liverpool Hospital, Dr Jacqueline Stack (Director), Dr Ian Callander, Kathryn Medlin, Kaye Marcin; Nepean Hospital, Dr Vijay Shindge (Director), Mee Fong Chin, Kerrie Bonser; The Children’s Hospital at Westmead, Prof Nadia Badawi (Co-Director), Dr Robert Halliday (Co-Director), Caroline Karskens; Royal North Shore Hospital, Dr Mary Paradisis, Prof Martin Kluckow, Claire Jacobs; Sydney Children’s Hospital, Dr Andrew Numa (Director), Dr Gary Williams, Janelle Young; Westmead Hospital, Dr Melissa Luig (Director), Jane Baird; and Royal Hospital for Women, Prof Kei Lui (Director), Diane Cameron. The authors also thank the babies and their families, the nursing and midwifery, obstetric and medical records staff of the obstetric and children’s hospitals in NSW and the ACT.
References
Footnotes
Contributors MEA-L conceptualised and designed the study, carried out the statistical analyses, drafted the initial manuscript and led the writing. GN contributed to the statistical analysis and interpretation. BB retrieved and cleaned the data and contributed to statistical interpretation. KG contributed to the statistical interpretation. DH contributed to the study design and statistical interpretation and led the writing of manuscript. All authors critically reviewed and approved the final manuscript as submitted. All authors had full access to all of the data (including statistical reports and tables) in the study and can take responsibility for the integrity of the data and the accuracy of the data analysis.
Competing interests None declared.
Ethics approval The Australian National University (No 2015/029), ACT Health Human Research Ethics Committee (No ETH.11.09/1031) and Hunter New England Research Ethics and Governance Unit has approved this study.
Provenance and peer review Not commissioned; externally peer reviewed.
Data sharing statement All authors had full access to all of the data (including statistical reports and tables) in the study and can take responsibility for the integrity of the data and the accuracy of the data analysis. No other data from the study are available.