Article Text

Abstract
Background Effective lung protective ventilation requires reliable, real-time estimation of lung volume at the bedside. Neonatal clinicians lack a readily available imaging tool for this purpose.
Objective To determine the ability of lung ultrasound (LUS) of the dependent region to detect real-time changes in lung volume, identify opening and closing pressures of the lung, and detect pulmonary hysteresis.
Methods LUS was performed on preterm lambs (n=20) during in vivo mapping of the pressure-volume relationship of the respiratory system using the super-syringe method. Electrical impedance tomography was used to derive regional lung volumes. Images were blindly graded using an expanded scoring system. The scores were compared with total and regional lung volumes, and differences in LUS scores between pressure increments were calculated.
Results Changes in LUS scores correlated moderately with changes in total lung volume (r=0.56, 95% CI 0.47-0.64, p<0.0001) and fairly with right whole (r=0.41, CI 0.30-0.51, p<0.0001), ventral (r=0.39, CI 0.28-0.49, p<0.0001), central (r=0.41, CI 0.31-0.52, p<0.0001) and dorsal (r=0.38, CI 0.27-0.49, p<0.0001) regional lung volumes. The pressure-volume relationship of the lung exhibited hysteresis in all lambs. LUS was able to detect hysteresis in 17 (85%) lambs. The greatest changes in LUS scores occurred at the opening and closing pressures.
Conclusion LUS was able to detect large changes in total and regional lung volume in real time and correctly identified opening and closing pressures but lacked the precision to detect small changes in lung volume. Further work is needed to improve precision prior to translation to clinical practice.
- Neonatology
- Respiratory Medicine
Data availability statement
Data are available upon reasonable request. NA.
This is an open access article distributed in accordance with the Creative Commons Attribution 4.0 Unported (CC BY 4.0) license, which permits others to copy, redistribute, remix, transform and build upon this work for any purpose, provided the original work is properly cited, a link to the licence is given, and indication of whether changes were made. See: https://creativecommons.org/licenses/by/4.0/.
Statistics from Altmetric.com
WHAT IS ALREADY KNOWN ON THIS TOPIC
Lung protective ventilation strategies require reliable estimation of lung volume at the bedside.
Whether lung ultrasound can detect real-time changes in lung volume in the preterm lung is unknown.
WHAT THIS STUDY ADDS
Categorical lung ultrasound scoring systems can detect large, real-time changes in total and regional lung volumes, opening and closing pressure, and pulmonary hysteresis in the preterm lamb, but lack the precision to detect small changes in lung volume.
HOW THIS STUDY MIGHT AFFECT RESEARCH, PRACTICE AND/OR POLICY
Lung ultrasound has the potential to monitor changes in lung volume at the bedside.
This technique needs development to more precisely detect small changes in lung volume prior to translation to clinical practice.
Introduction
Lung protective ventilation requires real-time bedside estimation of lung volume.1 Reliable, bedside imaging tools for this purpose are lacking. Chest radiography delivers ionising radiation, inaccurately estimates lung volumes2 and is not always immediately available. Thus, clinicians use surrogates of lung volume such as peripheral oxygen saturation (SpO2) to guide respiratory support.3 4 Persistently high long-term respiratory morbidity in preterm infants suggests better ways to guide respiratory support are needed.5
Lung ultrasound (LUS) and electrical impedance tomography (EIT) are emerging point-of-care, radiation-free imaging tools.6 LUS can accurately diagnose pneumothorax, and predict surfactant therapy and bronchopulmonary dysplasia.7–10 LUS detects change in lung volume in ventilated adults during mapping of the pressure-volume (PV) relationship of the respiratory system. Whether LUS can detect smaller volume changes in the preterm lung has not been validated, as instability of infants during no or low positive end expiratory pressure (PEEP) prevents these experiments being replicated.11
EIT measures real-time regional lung volumes and has a strong research role in critical care medicine.12 Changing electrical bioimpedance associated with varying aeration is analysed to calculate changes in lung volume.12 EIT reliably maps the regional PV relationship of the preterm lung in humans and animals.13–15 Application of EIT is simple16 and is validated against CT.17 Ultrasound is more available than EIT. Both have improved our understanding of lung aeration at birth,16 18 and in combination may provide unique insights into preterm lung mechanics.16 19 To our knowledge, no study has assessed lung aeration with simultaneous LUS and EIT.
We used preterm lambs undergoing standardised mapping of the static PV relationship to compare LUS images with absolute and regional lung volumes derived from the super-syringe method and EIT respectively. We hypothesised LUS of the dependent lung performed during PV relationship mapping would detect real-time changes in lung volume, pulmonary hysteresis, and opening and closing pressures of the lung.
Methods
This was a substudy of a group of studies investigating the impact of different delivery room ventilation strategies on lung injury. The study is reported as per the Animal Research: Reporting of In-Vivo Experiments (ARRIVE) guidelines.20
Animal preparation
Preterm lambs (124–128 days gestation (term: 140 days)) were delivered from anaesthetised, betamethasone-treated Border Leicester/Merino ewes via caesarian section as previously described.15 Following fetal exteriorisation and carotid vessel instrumentation, a custom-built 32-electrode EIT belt (Swisstom AG, Landquart, Switzerland) was fitted around the chest.15 After intubation with a 4.0 mm cuffed endotracheal tube and lung liquid drainage, ventilation was commenced on placental support.21 Ventilation was ceased at 15 min, the endotracheal tube clamped, and placental support was continued for 30 min while lambs were apnoeic. Next, the lung was opened to atmosphere for 2–4 min and the static PV relationship of the respiratory system was mapped using a 200 mL calibrated glass syringe with predefined pressure increments from atmosphere (0 cm of water (cm H2O)) to maximal inflation pressure (35 cm H2O).15 Inflation was sustained until volume stability was achieved or 30 s, whichever was first.14 15 Opening and closing pressures were defined as the maximal inflection on the inflation and deflation limbs. On completion, a lethal dose of sodium pentobarbitone (100 mg/kg) was administered.
Lung ultrasound
LUS was performed using a Logiq E system (GE Healthcare, Wauwatosa, Wisconsin, USA) with a 12-megahertz linear transducer. Depth was set to 2.5 cm and the focal zone positioned at the pleural line. Ultrasound settings and technique are detailed in the online supplemental methods. As previous studies considered worst aeration patterns representative,11 22 the right lower lateral lung was chosen. Ultrasound loops were acquired at each pressure increment during inflation and deflation. Sonographic hysteresis was defined as the presence of distinct inflation and deflation limbs, where the deflation limb demonstrated a higher LUS Score when compared with the corresponding inflation limb. LUS images were blindly assessed in random order by two researchers (SR: 10 years of LUS experience and ASa: 1 year of experience). For disagreements, consensus was reached through blinded reporting by AS.
Supplemental material
LUS scoring system
A LUS scoring system expanding on validated systems was developed.8 23 Details are described in the online supplemental methods and figure 1. The scores range from 0 to 5, with 5 indicating the best aeration.
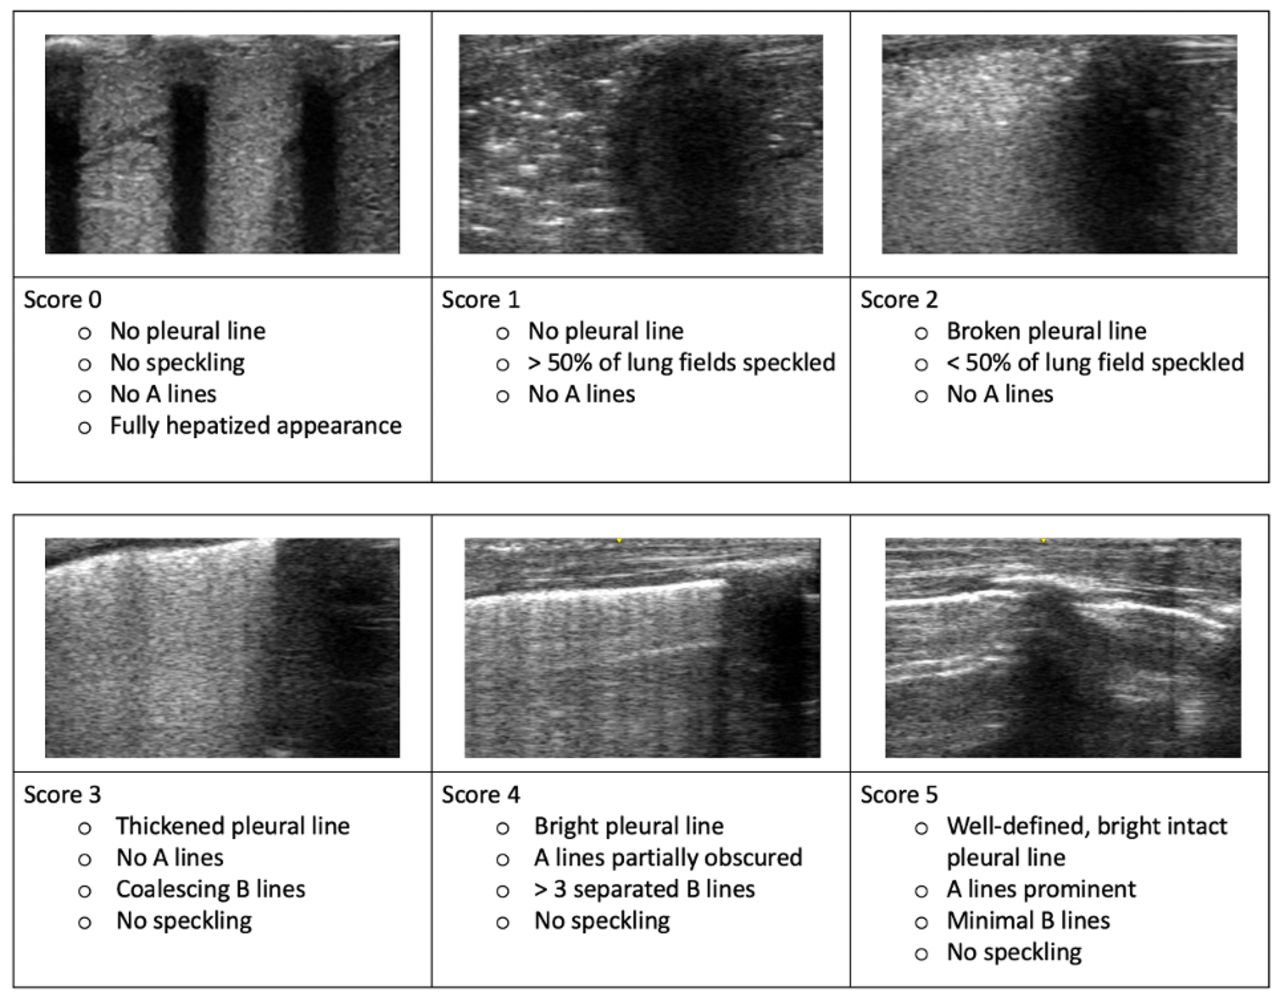
Expanded lung ultrasound (LUS) scoring system. Scores range from 0 to 5. The complete range of aeration is represented. A lines; Strong reverberation artefacts that form horizontal echogenic lines that are equidistant between the pleural line and ultrasound transducer. B lines; Tight reverberation artefacts that form continuous vertical echogenic lines that originate from the pleura and extend through the image. Speckling; Discrete echogenic foci which represent air in the small airways. Hepatisation; Complete loss of aeration allowing true imaging of lung tissue. This image is similar to the sonographic appearance of liver tissue.
Electrical impedance tomography
EIT images were sampled at 48 frames/second. Data were reconstructed using an anatomically correct finite element model of the lamb thorax filtered to the respiratory domain.12 14 The time-course EIT signal for the whole lung was calibrated against lung volumes measured by the super syringe,15 and volumes of the right whole lung, dorsal, central and ventral regions were determined from weighting pixel distributions of each region to calibrated whole lung volumes.24 LUS scores from the right dependent lung were compared with regional lung volumes.
Statistical analysis
A convenience sample size of 20 was chosen. Baseline characteristics are reported as mean and standard deviation (SD). Median change in LUS scores and lung volumes are reported. Change in LUS score was defined as change in score from allocation at atmosphere. Correlation between LUS scores and volumes was calculated using Spearman’s ρ as scores were non-parametric. Correlation was defined as strong; ρ≥0.7, moderate; ρ≥0.5, fair; ρ≥0.3 and weak; ρ<0.3. Friedman’s test with the Wilcoxon signed rank-sum test with a Bonferroni correction for multiple comparisons was used to compare LUS scores between pressure increments. An intraclass correlation coefficient (ICC) with two-way random effects model was calculated to determine inter-rater reliability. Significance was set at <0.05. Analysis was performed using GraphPad Prism (V.9.1.2, GraphPad Software, San Diego, California, USA) and R (R: A Language and Environment for Statistical Computing, Vienna, Austria, 2021).25
Results
Twenty lambs were studied; all completed the protocol without complications. No pneumothoraces occurred during ventilation or mapping of PV relationship and no lambs had fetal distress or acidosis. Two hundred and sixty LUS recordings were acquired. Interpretable LUS and EIT data were obtained in all lambs. Characteristics of the lambs are shown in table 1.
Lamb characteristics (n=20)
Figure 2 shows incremental lung volumes during PV relationship mapping (figure 2A, grey dashed line). Median (IQR) lung volume at 35 cmH2O was 24 ml/kg (body weight).19–28 Hysteresis was evident in all lambs (online supplemental figure E1A, B), with opening and closing pressures occurring at 20 cmH2O and 10 cmH2O and 6.5 (5–8) ml/kg and 12 (10-15) ml/kg,10–15 respectively, in 19 of 20 lambs.
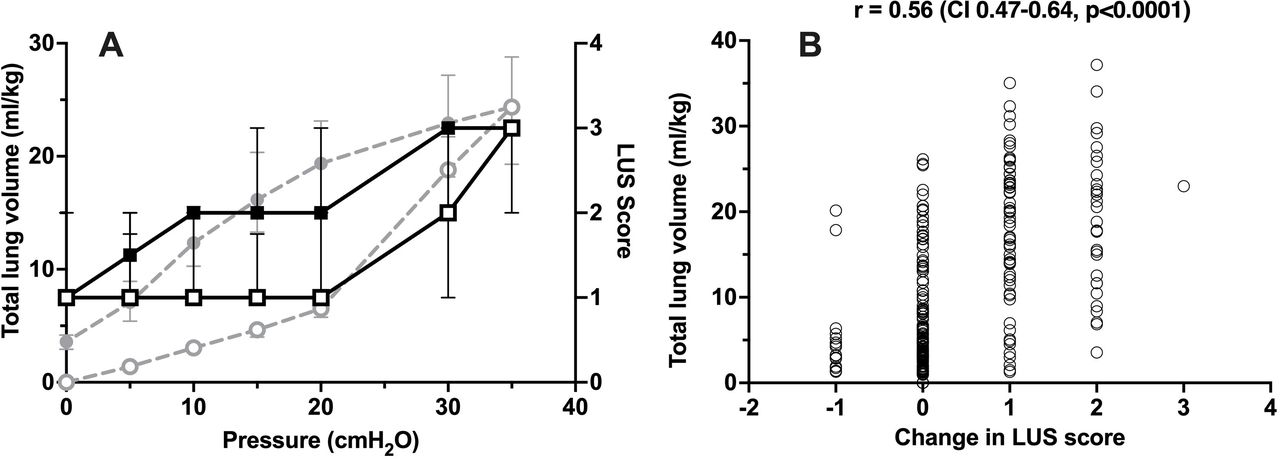
(A) Static pressure-volume (PV) curve derived from the super-syringe method (circles, grey dashed line) and LUS (squares, solid black line). All data are represented as median (IQR). X-axis; pressure (cm H2O), Y-axis; total lung volume (ml/kg). Open symbols represent the inflation limb and closed symbols the deflation limb. (B) Correlation between change in LUS scores and total lung volume. X-axis; LUS score, Y-axis; total lung volume (ml/kg). LUS, lung ultrasound.

Distribution of LUS scores versus total lung volume. Individual dots represent LUS scores from each lamb. Of the scores 97% were distributed between 0 and 3. LUS, lung ultrasound.
LUS detected hysteresis in 17 of 20 lambs (85%) (online supplemental figure E2A, B, online supplemental video E1). Sonographic hysteresis was variable. Significant changes in LUS scores occurred above opening (p=0.01 (30 cm H2O)) and below closing (p=0.03 (10 cm H2O) pressures (online supplemental figures E2A, B and table E1). Ninety-seven per cent of scores were between 0 and 3 (figure 3). Wider ranges of scores were seen in lambs with better static respiratory system compliance (Crs), and less variation seen with lower Crs (online supplemental figure E3).
Supplementary video
LUS Score versus total and regional lung volume
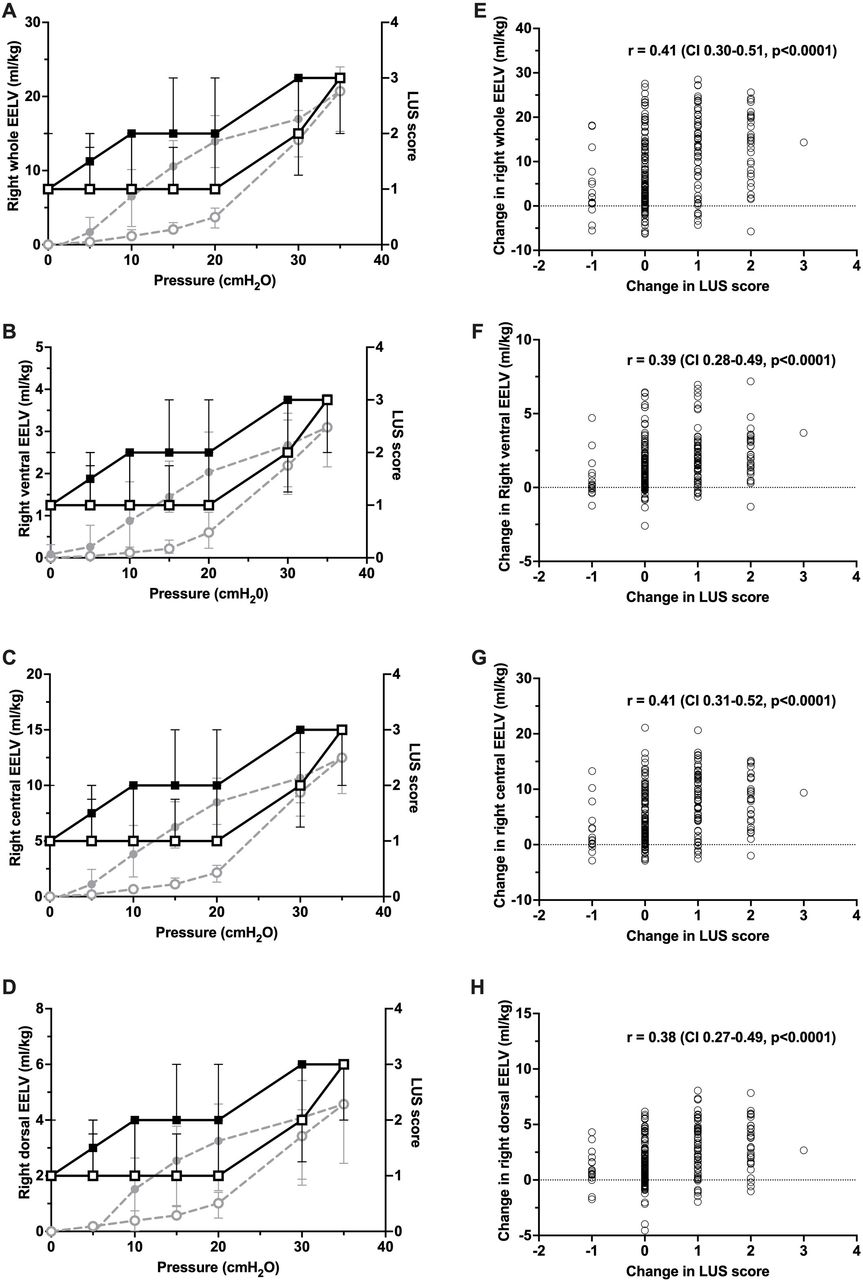
Changes in LUS Scores were correlated moderately with total lung volume (ρ=0.56, 95% CI 0.47 to 0.64, p<0.0001, figure 2), and fairly with regional lung volumes of the whole right lung (ρ=0.41, 0.30–0.51, p<0.0001), ventral (ρ=0.39, 0.28–0.49, p<0.0001), central (ρ=0.41, 0.31–0.52, p<0.0001) and dorsal regions (ρ=0.38, 0.27–0.49, p<0.0001) (figure 4).
Static regional PV curves derived from EIT (circles, grey dashed line) and LUS (squares, black solid line) of the right whole lung (A), ventral (B), central (C) and dorsal (D) regions. All data median (IQR). Open symbols represent the inflation limb and closed symbols the deflation limb. (E–H) Correlation between change in LUS scores and regional lung volume for the corresponding lung regions in Panels A–D. EELV, end expiratory lung volume, LUS, lung ultrasound; PV, pressure-volume.
Interobserver agreement
There was strong positive correlation between both observers for the individual ultrasound scores (ICC=0.84, CI 0.80-0.88).
Discussion
Neonatal clinicians do not have reliable, radiation-free bedside lung imaging. This is important for preterm infants due to increased risk of ventilator-associated lung injury.1 Tools such as gas washout and whole body plethysmography are limited to research.26 Routine chest radiography measurements do not correlate with lung volume in preterm infants.2 Transport out of intensive care units for detailed lung imaging with CT or MRI is often not safe or feasible. Alternative indicators of lung volumes such as forced oscillation techniques are available but challenging in clinical practice.27 LUS is a readily available and accepted modality. Continuous, radiation-free, bedside imaging makes it well suited for the preterm population.
We used the preterm lamb to determine the ability of LUS to detect changes in lung volume during in vivo mapping of the static PV relationship. Blindly reported LUS images were compared with total and regional lung volumes measured by the super-syringe technique and EIT. Previous animal studies have focused on the diagnostic utility of LUS for specific pathologies.28 29 To our knowledge, this is the first study to evaluate the ability of LUS to detect real-time changes in lung volume in the preterm lung. In our study, change in LUS scores correlated with changes in total and regional lung volumes, however there was wide intersubject variability and the categorical scoring system lacked precision to detect small changes in lung volume.
Safe delivery of lung-protective ventilation requires lung volume optimisation.30 Open lung ventilation strategies employ alveolar recruitment manoeuvers (ARMs) to recruit alveoli by inflating the lung to near total capacity followed by small reductions in pressure to place ventilation on the deflation limb, just above closing pressure.31 Exploiting pulmonary hysteresis, this improves gas exchange and results in less lung injury in neonatal animal models.32 Accordingly, it is essential that tools intended to guide ARMs can reliably detect pulmonary hysteresis. During ARMs, SpO2 is commonly used as a surrogate for lung volume.3 However, meaningful changes in SpO2 are only observed after large changes in lung volume.13 Other surrogates including forced oscillation technique and transcutaneous carbon dioxide show promise but are rarely used in clinical practice.4 27 In this study, LUS identified hysteresis in 85% of lambs. Importantly, LUS scores were higher above opening and lower below closing pressures. Identifying these points is fundamental in guiding open lung ventilation strategies. Although our scoring system did not discern smaller changes in lung volume, with further development and combined with current indicators of lung volume, LUS may help identify the optimal point of ventilation on the PV relationship.
LUS has assessed PEEP-induced recruitment in adults with promising results.11 Bouhemad et al performed LUS during PV relationship mapping in anaesthetised, paralysed adults. Changes in lung volume were moderately correlated with changes in LUS scores. LUS-guided recruitment also improves lung aeration and homogeneity in adult rabbit models of acute respiratory distress syndrome,33 and improves anaesthesia-induced atelectasis in healthy children.34 Contrastingly, Chiumello et al reported that LUS scores correlated with CT-detected lung density but not with lung recruitment in adults.22 It was postulated that the used LUS scoring system did not capture changes in the proportion of atelectatic lung. To address this, we have expanded on clinically validated scoring systems to include grades of atelectasis.8 23 We observed that recruitment of atelectatic lung correlated with increasing LUS scores. Consistent with previous reports in human studies, our scoring system demonstrated strong interobserver agreement between two operators of varying experience.35 36 Translation of these findings to the neonatal intensive care unit requires studies of preterm infants.
LUS scores were mainly distributed between 0 and 3. Experimental evidence suggests ultrasound artefact patterns can be reproduced by varying lung aeration or pulmonary water content.28 37 Healthy infants rarely demonstrate lower ranges of lung aeration patterns.18 Conversely, echodense patterns are commonly observed in infants who require surfactant replacement or invasive respiratory support.8 23 38 We did not change the pulmonary water content during PV relationship mapping. Rapid increases in LUS scores were seen above opening pressure, however the upper range of LUS scores was rarely seen. Given the endotracheal tube was left open to atmosphere prior to PV relationship mapping, it is likely that the lower range of LUS scores in our system represents recruitable lung. We stress that despite expanding on established scoring systems,23 38 our system has not been validated in humans. The purpose of expanding the scoring system was to capture changes in the proportion of atelectatic lung during lung recruitment. Thus, this scoring system should not be used in humans without clinical validation.
Simultaneous LUS and EIT were successful in all lambs. For the first time, this demonstrates the feasibility of continuous LUS and comparative EIT. Lung recruitment is best assessed by CT.39 In our experiment, lambs were on placental support, precluding CT imaging. Cross-sectional imaging from EIT correlates with lung volume in preterm infants and EIT measurements of lung recruitment have been validated against CT.17 Hence, EIT was used as comparative imaging. To our knowledge, this is the first time EIT has been used simultaneously with LUS to assess lung aeration. This novel addition to the animal model offers new opportunities to examine regional aeration distribution in the preterm lung.
Our study has limitations. Human validation studies are required. The animal model was chosen as super-syringe PV mapping (a gold standard measurement of lung volume) is rarely performed in infants. However, the preterm lamb is a robust model used to study the preterm lung.15 24 While there was a moderate correlation between LUS and lung volumes, there was wide intersubject variability and the scoring system lacked precision to detect small changes in lung volume. However, Thome et al 2 demonstrated no relationship between diaphragm position on chest radiography in relation to the posterior ribs and lung volume measured by gas washout (r=0.13). Despite this, chest radiography is still the most commonly used tool to assess lung volume in clinical practice. We argue that LUS has more potential to measure lung volume than chest radiography, but further work is needed to improve the precision of this technique.
The primary protocol mandated 15 min of ventilation and 30 min of apnoeic placental support. Reaccumulation of lung fluid potentially occurred during this period, limiting generalisability of our findings to the delivery room and neonatal transition. Regardless, our findings are important as tools to assess lung aeration in the delivery room are limited to LUS and EIT16 18 and the ability to assess real-time change in lung volume may offer new insights into this period. Applicability of this technique during extended mechanical ventilation warrants further exploration.
Inflations were limited to 30 s and maximum pressures were limited to 35 cm H2O due to previous high incidence of pneumothorax.15 Longer inflations and higher pressure may be required for volume stabilisation40 and complete lung inflation. Additionally, the effect of tidal ventilation was not assessed and deserves further investigation. Imaging was limited to the dependent lung, accommodating rapid image acquisition. Sonographic hysteresis may have been detected using ultrasound in more lambs using whole lung ultrasound, however this would preclude continuous imaging. Furthermore, imaging only the dependent lung may miss regional overdistention in other areas. Future research should aim to improve the resolution of validated scoring systems, investigate regional differences in LUS findings and determine the additional utility of whole lung ultrasound.
Strengths of our studies are as follows; LUS was performed by one operator, reducing acquisition variability. Images were randomised and blindly reported, minimising the risk of bias. Despite varying degrees of experience, there was strong interobserver agreement. Simultaneous EIT allowed for comparison of LUS scores with both absolute and regional measurements. Finally, incorporating placental support allowed full reconstruction of PV curves from atmospheric to a high maximal inflation pressure while maintaining physiological stability.
Conclusion
LUS of the dependent region correlated with large changes in total and regional lung volume in real-time. LUS demonstrated pulmonary hysteresis in the majority of lambs and identified opening and closing pressures of the lung. Our categorical scoring system did not discern small changes in lung volume. LUS requires development to be able to more precisely detect small changes in lung volume prior to potential translation of this technique into clinical practice.
Data availability statement
Data are available upon reasonable request. NA.
Ethics statements
Patient consent for publication
Ethics approval
The study was approved by the Murdoch Children’s Research Institute Animal Ethics Committee, Australia in accordance with National Health and Medical Research Council (Australia).
Acknowledgments
The authors thank Dr Kate Hodgson and Ms Georgia Santomartino for their critical review of this manuscript.
References
Supplementary materials
Supplementary Data
This web only file has been produced by the BMJ Publishing Group from an electronic file supplied by the author(s) and has not been edited for content.
Footnotes
Twitter @ArunSett
Correction notice This article has been corrected since it was first published. The open access licence has been updated to CC BY.
Contributors AS is the guarantor of the study and accepts full responsibility for the work and the conduct of the study, had access to the data, and controlled the decision to publish. AS and DGT developed the concept and designed the experiment. AS, PMP-F, SR, BJM, PGD and DGT interpreted the data; AS, DGT, PMP-F, KRK, RJS, EJP, JDC and MS were involved in all lamb experimental work; AS and DGT supervised all aspects of the study; AS acquired the ultrasound images; ASa and SR reported the ultrasound images; JDC, KRK, AS and DGT performed the EIT analysis; SD and AS performed the statistical analysis; all authors participated in result interpretation; AS wrote the first draft and all authors contributed to redrafting the manuscript.
Funding This study is supported by the Victorian Government Operational Infrastructure Support Program (Melbourne, Australia) and a grant from the National Health and Medical Research Council (NHMRC; Grant ID 1182676). AS is supported by a research grant from the Australasian Society of Ultrasound in Medicine and a PhD scholarship from the Centre of Research Excellence in Newborn Medicine, Victoria. DGT is supported by a Royal Children’s Hospital Foundation Clinical Scientist Fellowship and an NHMRC Investigator (Grant ID 2008212). PGD is supported by an NHMRC Practitioner Fellowship (Grant ID 556600). BJM is supported by a Medical Research Future Fund (Australia) Fellowship Grant (Grant ID 1159225). GE Healthcare provided the Logiq E ultrasound system but were not involved in study design, analysis, or interpretation of results.
Competing interests None declared.
Provenance and peer review Not commissioned; externally peer reviewed.
Supplemental material This content has been supplied by the author(s). It has not been vetted by BMJ Publishing Group Limited (BMJ) and may not have been peer-reviewed. Any opinions or recommendations discussed are solely those of the author(s) and are not endorsed by BMJ. BMJ disclaims all liability and responsibility arising from any reliance placed on the content. Where the content includes any translated material, BMJ does not warrant the accuracy and reliability of the translations (including but not limited to local regulations, clinical guidelines, terminology, drug names and drug dosages), and is not responsible for any error and/or omissions arising from translation and adaptation or otherwise.