Article Text

Abstract
AIM To determine if cerebral blood flow velocity increases during all types of neonatal seizure, and whether the effect is due solely to an increase in blood pressure, transmitted to the cerebral circulation when autoregulation is impaired.
METHODS Seizures were diagnosed in 11 high risk neonates using cotside 16 channel video–EEG polygraphy. EEG, cerebral blood flow velocity (CBFV) using transcranial Doppler ultrasound, and arterial blood pressure (ABP) measurements were made. At least two 5–10 minute epochs of simultaneous measurements were performed on each infant. These epochs were then reviewed to eliminate artefacts, and one minute data periods containing a clear seizure onset were created. Each period contained 20 seconds before the seizure. Data periods without seizures from the same infants were also analysed and compared with seizure periods.
RESULTS Four infants had purely electrographic seizures—without clinical manifestations. Six infants had electroclinical seizures. One infant displayed both seizure types. A random effects linear regression analysis was used to determine the effect of seizures on CBFV and ABP. A significant increase was found in mean CBFV in those periods containing seizures. The mean percentage change in velocity for all infants was 15.6%. Three infants showed a significant increase in mean ABP after seizures but the overall increase in ABP for all infants was not significant.
CONCLUSION Electroclinical and electrographic neonatal seizures produce an increase in CBFV. In some infants the increase is not associated with an increase in blood pressure. These preliminary results suggest that electrographic seizures are associated with disturbed cerebral metabolism. Treatment of neonatal seizures until electrographic seizure activity is abolished may improve outcome for these infants.
- seizures
- EEG
- cerebral blood flow velocity
- transcranial Doppler
Statistics from Altmetric.com
Seizures in adults and children produce a substantial increase in cerebral blood flow.1-3 Absence of seizures in children, on the other hand, can decrease cerebral blood flow velocity.4 5 Seizures in neonates are often subtle or purely electrographic and tonic–clonic seizures are rarely seen. The unique nature of neonatal seizures means that results obtained in older subjects may not apply to this group.
Previous work on cerebral blood flow in neonates during seizures includes a study by Lou and Friis-Hansen,6 who found an increase in blood pressure during seizure induced motor activity in nine infants. Perlman7 studied clinical seizures (no EEG monitoring) in 12 preterm infants and found that cerebral blood flow velocity (CBFV), blood pressure, and intracranial pressure increased in all infants during seizures. In 1992 Bode1 reported one neonate, therapeutically paralysed, in whom simultaneous EEG and CBFV studies were performed. The mean flow velocity increased to 191% of the baseline value during seizures. Simultaneous blood pressure measurements were not recorded. A recent study by Borchet al, using SPECT to measure regional cerebral blood flow during seizures in neonates, found a focal cerebral hyperperfusion in approximately half of the cases during electroclinical and electrographic seizures.8 However, seizure characterisation was limited as only a single channel cerebral function monitor was used.
Sick neonates are particularly vulnerable to ischaemic and haemorrhagic brain injury and studies have suggested that impaired cerebral autoregulation may contribute to this.9 10 We wished to explore further the haemodynamic response to seizures in newborn infants and in particular to determine whether the increase in CBFV was mediated solely by an increase in blood pressure, suggesting a pressure–passive cerebral circulation during seizure. To do this we chose video–EEG and Doppler estimation of cerebral blood flow velocity. EEG studies in the neonatal intensive care unit are hampered by the difficulties involved in handling sick and unstable infants for prolonged periods and by the electronically noisy environment. However, video–EEG is the most precise technique with which to adequately study the subtle neonatal seizure. Transcranial Doppler estimation of cerebral blood flow velocity has limitations because the assumption is that the diameter of the cerebral blood vessel examined remains constant. There have been many validation research studies of transcranial Doppler estimation of cerebral blood flow velocity.11 Doppler ultrasound is the only technique available that is non-invasive, repeatable, semi-continuous and safe. As far as we are aware, no previous study has recorded EEG, blood pressure, and cerebral blood flow velocity simultaneously in neonates during seizures.
Methods
Infants admitted to neonatal intensive care at Kings College Hospital over 18 months were studied. The study received ethical approval from the hospital and written parental consent was obtained for each infant. Each investigation was performed either because of clinical suspicion of neonatal seizures, or the infant was considered to be at high risk of developing seizures, or the infant was paralysed for ventilation. High risk was defined as an infant with any of the following: hypoxic–ischaemic encephalopathy (HIE), meningitis, drug withdrawal, or known cerebral pathology.
A 16 channel Telefactor (Modac) Video–EEG system was used to record 12 channels of EEG using the 10–20 system of electrode placement modified for neonates (F4, C4, T4, P4, O2, Cz, F3, C3, T3, P3, O1). A single channel electro-oculogram (EOG) was recorded from the upper outer canthus of the right eye to the lower outer canthus of the left eye. The sub-mentalis electromyogram (EMG) was also recorded. The remaining two channels were configured to display ECG and respiration via an output from the infant’s clinical monitor. A video recording was made of each baby for the entire duration of study. The EEG–polygraphy waveforms were embedded on to the video picture and recorded by a Panasonic video recorder on to conventional videotape.
During the EEG, cerebral blood flow velocity was recorded from the middle cerebral artery at intervals, using a semicontinuous system similar to that described by Evans et al,12 but based on a 486 PC. A small continuous wave Doppler ultrasound probe with a total acoustic output of <5 mW and I (spta) <50 mW/cm2 was fixed to the skin overlying the middle cerebral artery. Blood pressure was measured simultaneously from an existing umbilical or peripheral arterial catheter using a Medex MX860 transducer connected to a Mennen Horizon 2000/s or Marquette Solar 8000 monitor.
Simultaneous recordings of CBFV, blood pressure, and EEG (5–12 minute periods) were obtained at intervals during the recording session.
CBFV, blood pressure, and two channels of EEG data (C4-P4, C3-P3) were stored on a digital instrumentation tape recorder (PC-108M) and transferred to a personal computer. The CBFV and blood pressure signals were low pass filtered at 20 Hz with a zero-phase Butterworth digital filter, and the beginning and end of each cardiac cycle was detected using the foot of the blood pressure pulse. Systolic, mean, and diastolic values of CBFV and blood pressure were extracted for each cardiac cycle and their temporal sequence was interpolated with a third order polynomial to produce a uniform time series with time intervals of 0.2 seconds. A sliding window with a 4 second duration was used to estimate the instantaneous power of the two channels of EEG signals. The two resulting temporal sequences were also resampled with a time interval of 0.2 seconds. The EEG signals were used to locate and mark the beginning of electrographic seizures by visual inspection. The temporal mark was then used as the point of synchronism to compute signal averages of mean CBFV, mean blood pressure, and two EEG power signals occurring at the same time as the seizure transient. One minute data periods containing clear electrographic seizure onset were created, each period containing 20 seconds before seizure. In a few cases where seizure duration was relatively short, data periods consisted of 20 seconds before seizure followed by the entire seizure duration. Data periods were divided into an electroclinical seizure group and an electrographic group.
A similar procedure was applied to signals from the same neonates during periods of non-seizure EEG activity, to control for the effects of signal processing on the temporal patterns of the averaged mean CBFV and blood pressure time series.
The corresponding video–EEG data were used to classify seizure types. The diagnosis of an electrographic seizure required the evolution of sudden, repetitive, evolving stereotyped waveforms with a definite beginning, middle, and end.13
Information on blood gases, electrolytes, blood glucose serum bilirubin, sedation and all drugs, fluids and anticonvulsants were collected prospectively. A detailed history of pregnancy, labour, delivery and postnatal condition was obtained for each infant.
The change in mean CBFV was calculated for each one minute data period (seizure and non-seizure files) by comparing the first 10 second interval of each file (pre-seizure) with the final 10 second interval (during seizure). Adjacent intervals were used if the first or last intervals were missing.
The percentage increase in mean CBFV from the pre-seizure interval to the during seizure interval was computed as (100*(during seizure− pre-seizure)/pre-seizure) for each data period, giving as many measures per baby as there were data periods. The percentage change scores were then used as the dependent variable in a random effects linear regression analysis with babies as the random factor and type of data period (seizure occurredvs no seizure occurred) as a fixed factor. The analysis was repeated for CBFV, controlling for percentage change in blood pressure. The same analysis was repeated using blood pressure changes as the dependent variable. The analysis was carried out using Stata statistical software (College Station, Texas; 1997).
Results
Eleven of the 28 high risk infants in whom it was possible to record video EEG, CBFV, and blood pressure simultaneously had seizures. The birth history and range of clinical problems are summarised in table 1. Table 2 contains the absolute values of CBFV and ABP for each patient before and after seizure onset.
Clinical details and seizure type in 11 infants with seizures
The average CBFV and ABP in the first 10 seconds and final 10 seconds of seizure files for each infant
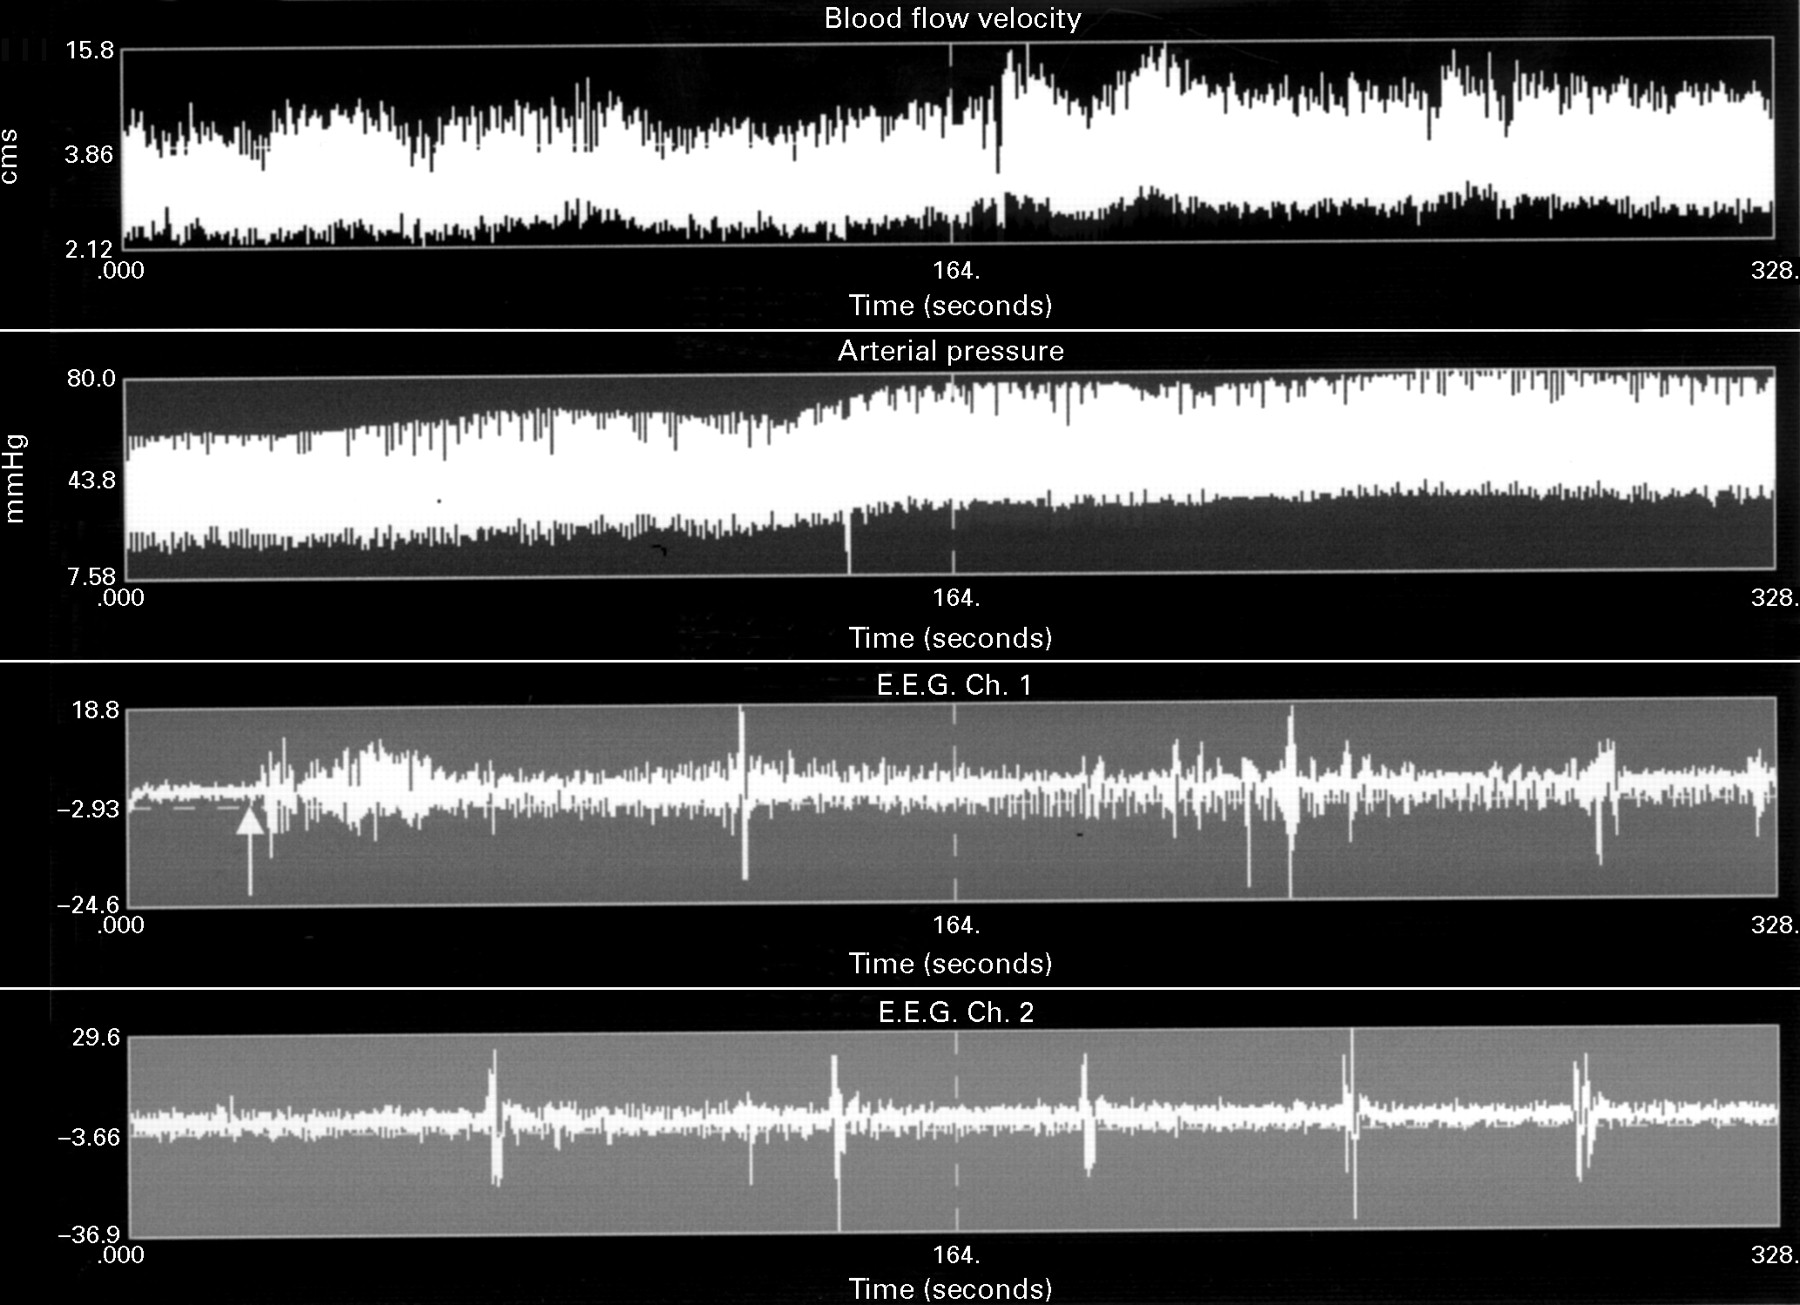
A total of 71 data periods containing seizure onset were analysed in 11 patients. Forty data periods without seizure from the same infants were also analysed. Six infants had electroclinical seizures only. Four infants had electrographic seizures only (one was therapeutically paralysed). One infant had electroclinical seizures before administration of anticonvulsants and purely electrographic seizures thereafter. A recording showing three consecutive electrographic seizures in a therapeutically paralysed infant is plotted in fig 1.

551 second recording of simultaneous CBFV (trace 1), ABP (trace 2), and two channels of EEG during electrographic seizures in a therapeutically paralysed infant. Arrows indicate the onset of EEG seizure discharges.
A random effects linear regression analysis was used to analyse all data periods with and without seizure from 11 infants. The percentage increase in mean CBFV was significantly higher in data periods where a seizure occurred (p < 0.001; 95% CI 6.7%–24.5%). This effect remained significant after controlling for the percentage increase in blood pressure.
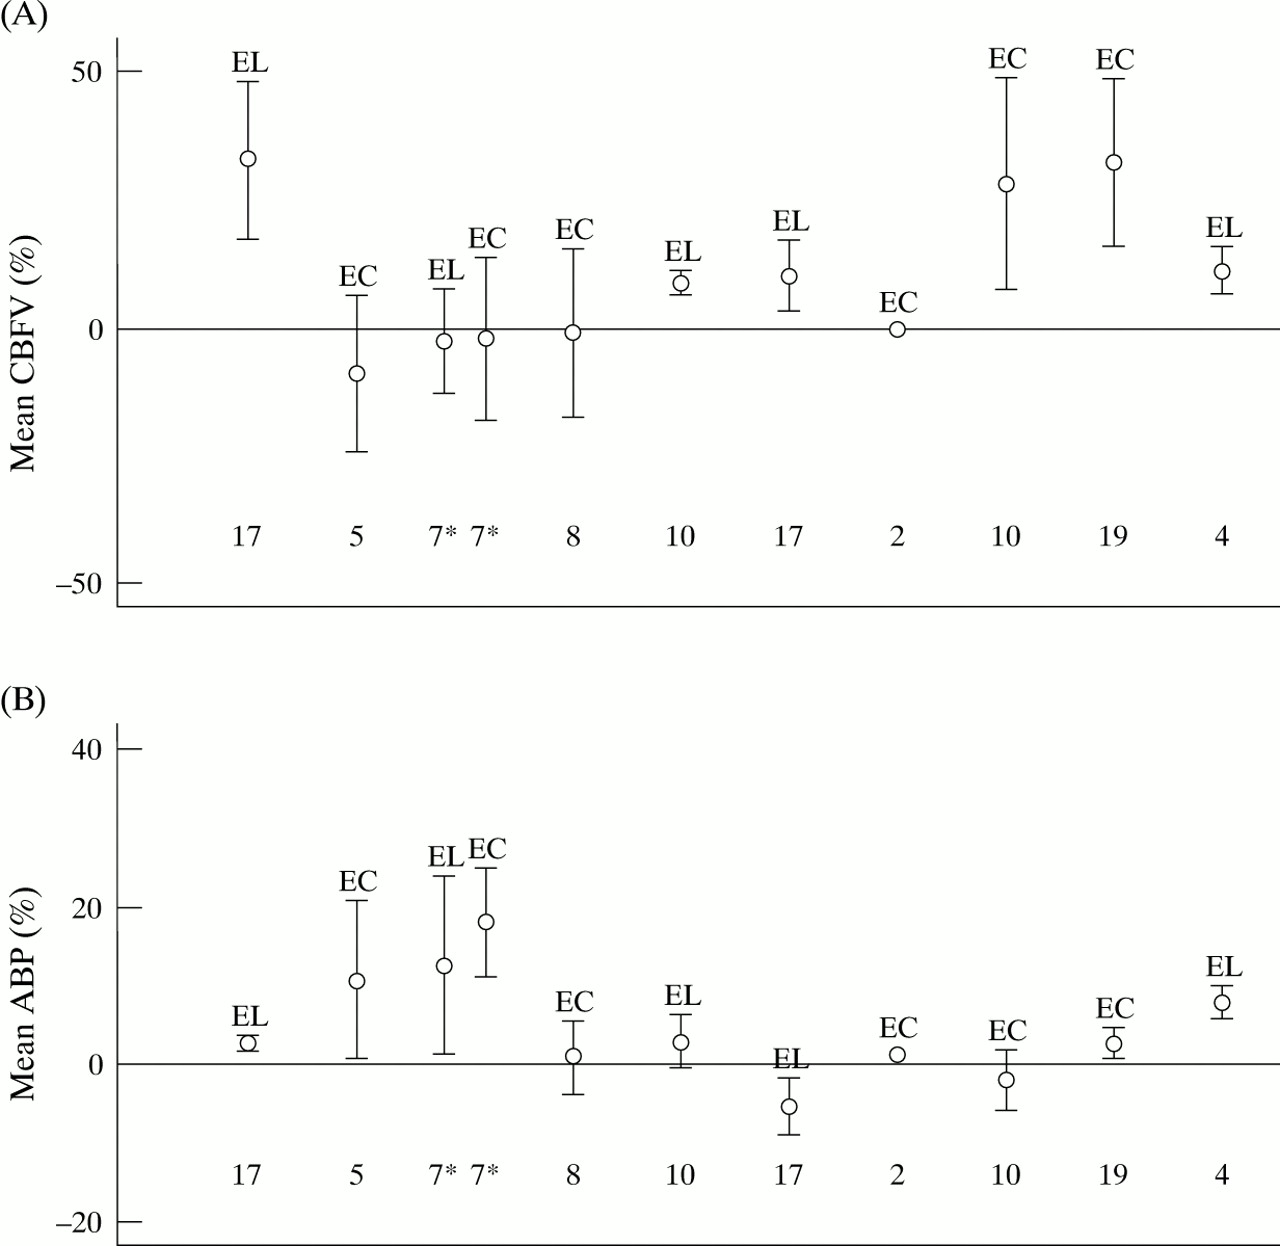
Data from each infant were then classified according to seizure type and the mean difference in percentage increase in CBFV between the data periods with and without seizures for each individual infant was calculated (fig 2). One infant was not included in this analysis as there were insufficient seizure data and one infant did not have sufficient data to estimate the standard error of the mean difference (but all infants did contribute to the overall analysis).

Mean difference in percentage increase of (A) mean CBFV and (B) mean ABP in 10 infants (one patient is missing due to small number of files) between data periods with and without seizure. The letters at the top of each interval represent the type of seizure seen and the number at the bottom of each interval represents the number of one minute data periods analysed for each individual infant. El = electrographic, EC = electroclinical. One infant who had both seizure types is indicated by an asterisk.
Four of the nine remaining infants had purely electrographic seizures and all showed an increase in mean CBFV after the onset of seizures. The infant with both seizure types did show an increase in CBFV following seizures but when this was compared with the same infant’s non-seizure data periods, the increase was not significant. This infant was having frequent seizures and it was difficult to obtain a non-seizure data period that did not contain interictal activity. Two infants with electroclinical seizures showed an increase in mean CBFV after seizures and two did not. A total of six out of nine infants showed increased velocity following seizures. When data for all infants were pooled, the mean percentage change in CBFV was 15.6%.
Linear regression analysis of all data periods, seizure and non-seizure, revealed no significant increase in mean ABP during seizure periods (95% CI from−0.12 to 5; p = 0.06). The changes in blood pressure were more variable and this is illustrated by individual results from two infants (fig 3). The first infant shows an increase in CBFV and ABP after seizure and the second infant shows no increase in ABP after seizure, although this infant had a relatively large increase in CBFV.
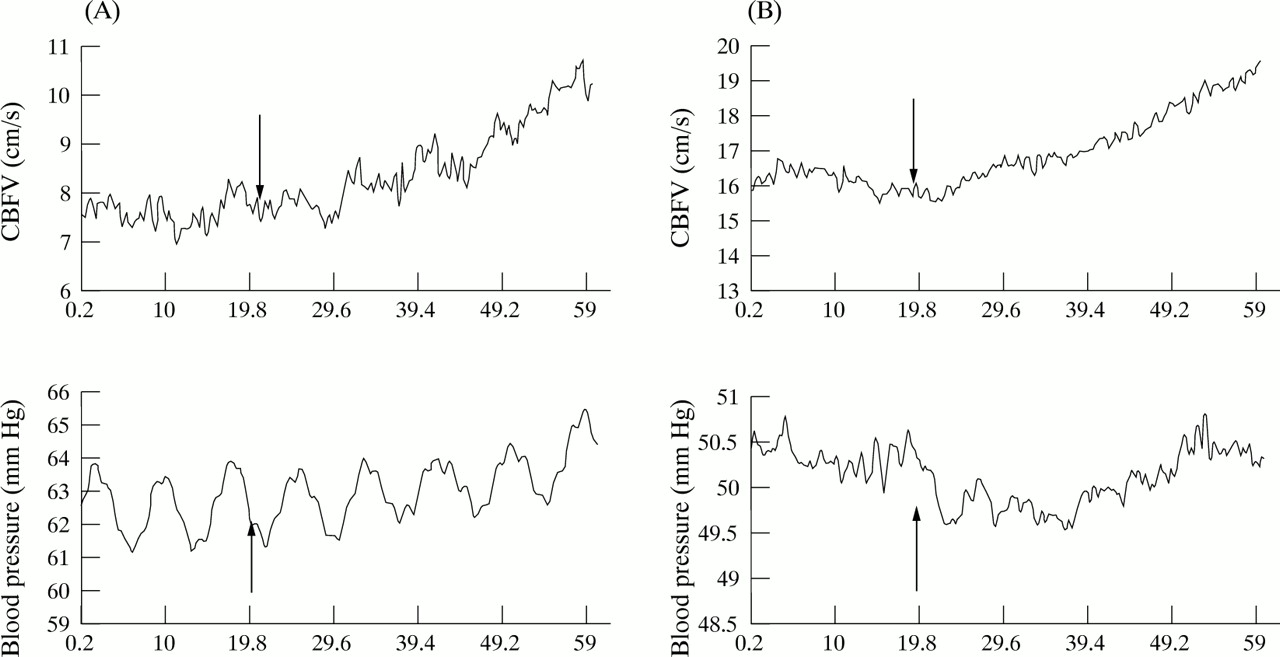
Representative Doppler ultrasound recordings of mean cerebral blood flow velocity (CBFV) and mean blood pressure before and after the onset of seizure (time t = 20) in two babies. Arrows point to the time of seizure onset. In baby A, CBFV and APB increased after electrographic seizure. This baby had large oscillations on the blood pressure recording. In baby B CBFV increases following electroclinical seizure. An initial decrease in ABP was seen following seizure onset but no overall increase in ABP was seen.
Fig 2B shows the mean difference in percentage increase in ABP between the data periods with and without seizures for the individual babies. Three infants show a large percentage increase in ABP after seizure onset. One infant had an electroclinical seizure only and the associated increase in mean CBFV was not significant. The second infant with a significant increase in ABP displayed both seizure types. The raw data from this infant are illustrated in fig 4. The third infant had electrographic seizures and the increase in ABP was associated with an increase in CBFV (figs 2A and B). When all data were pooled, the mean percentage change in blood pressure following seizure was 2.5%.
CBFV, ABP, and EEG over 328 seconds in a baby with electroclinical seizures. The arrow indicates electrographic seizure onset. This seizure continued to the end of the recording. The infant displayed boxing and cycling movements during the seizure. CBFV increases and as motor activity continues during the seizure, ABP rises dramatically. Arrow indicates seizure onset.
Discussion
Our results show that CBFV increases during neonatal seizures even when the clinical manifestations of the seizure are absent. At present, neonatal electrographic seizures are not treated, as there has been no evidence to suggest that they are harmful and very few neonatal units have continuous EEG or cerebral function monitors. We have shown that the cerebral haemodynamic response to pure electrographic seizures is very similar to the response to an electroclinical seizure.
Animal studies have shown that the increase in cerebral blood flow seen during seizures is due to an increased metabolic rate. Other possible explanations are that the increased cerebral blood flow is due to a rising CO2 because of decreased respiratory gas exchange during the seizure, or an increased input pressure secondary to a rise in blood pressure, which is transmitted because of impaired autoregulation.
Our results do not lend weight to the argument that the change is due to an increase in blood pressure. Not all infants with electrographic seizures showed a consistent increase in mean ABP accompanying seizures. Blood pressure increases were larger during electroclinical seizure and this may have been due to the motor activity induced during the clinical seizure.6 One patient with both electroclinical and electrographic seizures showed a larger increase in arterial blood pressure (fig 4) during electroclinical seizure. Nor do we feel that the change was CO2 mediated: most of the infants in this study were ventilated and CO2 did not change. Pure electrographic seizures are not usually treated, because the infant’s electrographic status cannot be determined without EEG, which is not widely available. Our results have shown that these seizures are associated with the same changes in cerebral haemodynamics as electroclinical seizures. The increase in CBFV is most likely to be due to excessive demand for glucose and oxygen but may still be insufficient to meet the pathological demands. Prolonged excessive cerebral blood flow is also likely to contribute to cerebral oedema and vasoparalysis with accompanying loss of autoregulatory mechanisms. There is no evidence that prophylactic or rescue anticonvulsant therapy of seizures improves the neurodevelopmental outcome. Our results, and those of others14 suggest that, in part, this may be because current treatments do not achieve electrographic seizure quiescence.
These preliminary results indicate that if the current dismal outlook after neonatal seizures is to be improved, consideration needs to be given to more aggressive seizure treatment. Wider availability of EEG in the neonatal unit would allow the clinician to quantify the true seizure burden of the neonate and adequately regulate anticonvulsant use.
Acknowledgments
G Boylan is supported by the Joint Research Committee of Kings College Hospital (Grant No 183). This project was also supported by an equipment grant from the charity Baby Lifeline.
We are very grateful for the continued support of nursing and medical staff at the NICU, Kings College Hospital.