Article Text

Abstract
AIMS To determine if there is any association between the findings of visual assessment performed at the age of 5 months and neurodevelopmental outcome at the age of 2 years in children who have sustained hypoxic-ischaemic insults.
METHODS Twenty nine term infants with hypoxic–ischaemic encephalopathy and/or brain lesions on neonatal magnetic resonance imaging (MRI) were prospectively evaluated. At 5 months of age all the infants had their visual function assessed using the Atkinson Battery of Child Development for Examining Functional Vision, which includes the assessments of optokinetic nystagmus (OKN), acuity, visual fields, fixation shift and phase and orientation reversal visual evoked potentials. At 2 years of age the children had a structured neurological evaluation and a Griffiths developmental assessment.
RESULTS There was good correlation between the extent of the early detected visual impairment and both neuromotor and global development. Children with more than three out of five abnormal visual tests at 5 months of age tended to have abnormal neurological examination results and abnormal developmental quotients. Children with three or fewer abnormalities tended to have developmental quotients in the normal range; the level of their performance, however, was still related to the number of visual tests passed.
CONCLUSIONS Individual visual tests can provide important prognostic information. While abnormal OKN and acuity were always associated with abnormal outcome, normal results on visual evoked potentials and fixation shift tended to be associated with normal outcome.
- visual evoked potentials
- neurological outcome
- hypoxia-ischaemia
Statistics from Altmetric.com
Over the past two decades considerable attention has been paid to the assessment of visual function in infants and children with brain lesions. Several studies have reported that abnormal visual function occurs in these infants even in absence of ocular abnormalities.1-12 This has been defined as cortical blindness13 or, more recently, as cerebral visual impairment.1-12 Most of these studies, however, used acuity as the only measure of visual function.
In our recent studies on infants with brain lesions, we found that a normal acuity does not exclude the possibility that other aspects of visual function, such as discrimination of orientation or shift of attention, may be abnormal.14-18 Discrimination of orientation or shift of attention are not present at birth but gradually appear during the first months of life, and reflect the maturation of the cortical visual system which gradually takes over from the subcortical system which operates in the first weeks of life.19 20 While all normal children at the age of 5 months attain these functions,21 22 we observed that in a proportion of the children with brain lesions the results suggested an abnormality, or at least a delay in the maturation of the cortical visual system. The degree of abnormality was not always associated with the extent of the lesion on magnetic resonance imaging (MRI).14-18
This study aimed to evaluate whether there is any association between the results on the visual tests performed at 5 months of age and the neurological and neurodevelopmental outcomes at the age of 2 years. More specifically we aimed to evaluate: (i) whether the neurological and/or neurodevelopmental outcomes correlate with the extent of visual impairment—that is, the number of visual tests passed; and (ii) whether individual visual tests used can predict the outcome.
Methods
The children described in this study were born at, or referred soon after birth to, the Hammersmith Hospital, London, between February 1994 and December 1995. This study is part of an ongoing collaborative study aimed at evaluating the neurological and neurodevelopmental outcomes and visual function in full term infants with brain lesions. As part of this study all the infants with hypoxic–ischaemic encephalopathy (HIE) at birth and/or who presented with abnormal neurological signs in the first days of life, such as convulsions, undergo brain MRI.
Twenty nine children were enrolled in this study: 18 had hypoxic-ischaemic encephalopathy and 11 with neonatal convulsions were subsequently found to have haemorrhagic-ischaemic lesions on MRI.
ASSESSMENT OF VISUAL FUNCTION
All the children were referred at the age of 5 months to the Visual Development Unit at University College London. Vision was evaluated using the Atkinson Battery of Child Development for Examining Functional Vision (ABCDEFV).23 24 This includes assessment of orthoptic status (ocular movements, pupil response), refractive errors, binocular optokinetic nystagmus (OKN), and the following tests:
Acuity
This was tested by using an automated version of forced choice preferential looking. Stimuli consist of black and white stripes of varying spatial frequencies presented at the infant’s eye level on either side of the midline and paired with a uniform grey background on the other side. The level of acuity is measured as the finest grating for which the infant shows a consistent preference, and correlated to age specific normative data.
Visual fields
These were tested by using a small white ball (Stycar ball) of 40 mm in diameter, gradually moved from 90 degrees laterally inwards towards the midline. Head and eye movements were observed to estimate the outer limit of the fields and their symmetry.
Fixation shift
This is a test of visual attention evaluating the direction and the latency of saccadic eye movements in response to a peripheral target (alternating black and white stripes) in the lateral field. A central target was used as a fixation stimulus before the appearance of the peripheral target. In some trials the central target disappeared simultaneously with the appearance of the peripheral target (non-competition), but in others the central target remained visible and created a situation of competition between the two stimuli. Details of the methodology have been described before.14 17 24Normal children can reliably shift their attention in a situation of non-competition during the first weeks of life, but brisk refixations in a situation of competition are only found after 6 to 8 weeks and reliably by 12 to 18 weeks of age. Absent or delayed (a latency of more than 1.2 seconds) refixation at 5 months of age is considered abnormal.
Phase and orientation reversal Visual Evoked Potential (VEP)
Steady state VEP was recorded by using orientation reversal and phase reversal stimuli. Stimuli consisted of black and white stripes at an oblique orientation. For phase reversal VEP the orientation of the stripes was fixed but the contrast reversed periodically. For orientation reversal VEP, stimuli periodically changed orientation between 45 and 135 degrees. Both phase and orientation reversal VEPs were initially tested at 8 reversals/second and if the responses were not significant, at a lower temporal frequency (4 reversals/second). Details of the methodology has been described before.14 17 25 According to our previous studies in a normal population, the phase reversal response is already present at birth, while the orientation reversal response is only consistently elicited at 10 weeks for slow changes (4 reversals/second) and after 12 weeks for faster changes (8 reversals/second). Therefore, the absence of a significant response at either frequency in the VEP assessment at 5 months of age was considered abnormal.
FOLLOW UP
Neurological examination
A structured neurological examination was performed to assess posture, tone, power, reflexes and motor function at 2 years of age.
Developmental assessment
The neurodevelopmental outcome at the age of 2 years was evaluated using the Griffiths Mental Developmental Scale.26 The developmental quotients (DQ) were calculated for global development as well as for the individual subscales (locomotor, personal–social scale, hearing and speech, hand and eye coordination and performance). Results were classified as normal when the DQ fell above 80, and as abnormal when below 80.
MRI was performed using a Picker 1.0T HPQ system with T1 and T2 weighted spin echo(SE) and age related inversion recovery (IR) sequences in the transverse plane. Although most of the children had serial imaging performed, only the results of the scan closest to the 5 month visual assessment (range: 4 months, 18 days to 6 months, 15 days, mean: 6 months, 4 days) were considered in this study.
The correlation was calculated between the number of visual tests showing abnormalities and the results of the neurodevelopmental test. Sensitivity and specificity of the individual visual tests were also calculated.
Results
ASSESSMENT OF VISUAL FUNCTION
Ten of the 29 children had normal results on all the tests; the remaining 19 showed abnormalities at least on one visual test. Table 1gives details of the assessment of visual function.
MRI findings, visual tests, and outcome
Twenty children showed normal and nine abnormal ocular movements. Twenty five children showed normal and four abnormal OKN. Twenty three children showed normal, and six abnormal acuity. Fifteen infants showed normal, and 14 abnormal visual fields. Thirteen children showed normal, and 16 abnormal re-fixations. VEPs were recorded in 27 infants. Fifteen infants showed normal and 12 abnormal responses.
FOLLOW UP
Nineteen of the 29 children were normal. The remaining 10 all had cerebral palsy. Table 1 gives details of the neuromotor outcome.
Twenty two children had developmental quotients in the normal range (range 87–140, mean 104.5) and seven in the abnormal range. Two of the seven had abnormal global developmental quotients of 67 and 47, with abnormal quotients in all the five subscales. The other five children were severely retarded and were untestable. An arbitrary developmental quotient of 30 was given to the untestable children. Table 2 gives details of the follow up assessment.
Vision at 5 months and developmental outcome
MAGNETIC RESONANCE IMAGING
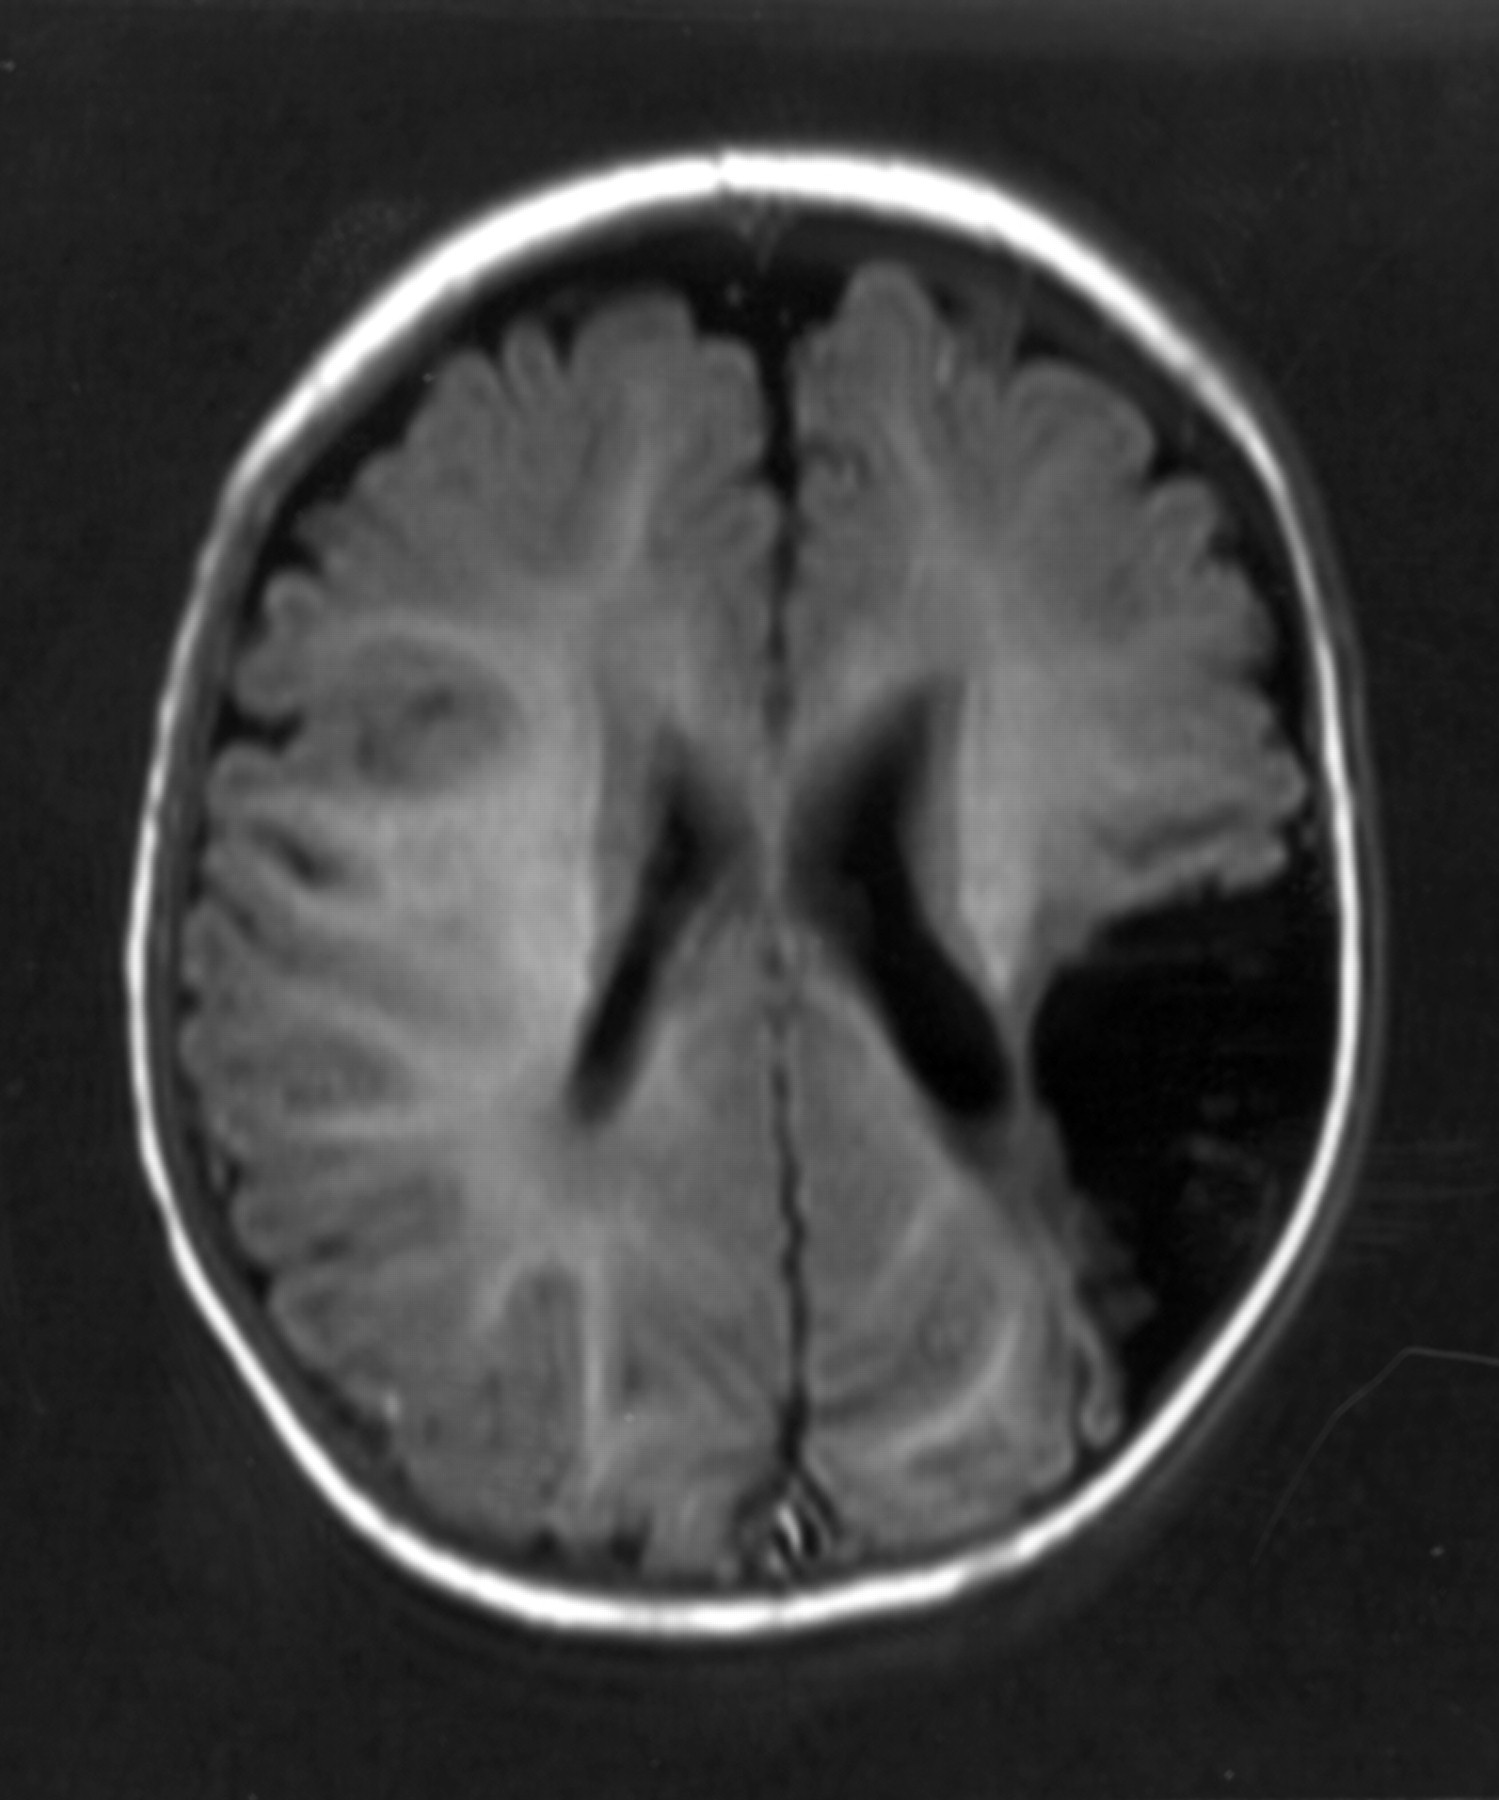
Seventeen of the 18 children who were diagnosed with hypoxic–ischaemic encephalopathy at birth had MRI changes consistent with this diagnosis. Ten of the 17 had initial brain swelling but a normal MRI after the first week of life; the other seven all had generalised lesions involving both cortical and subcortical structures (fig 1). The remaining child showed generalised lesions related to cerebral haemangioma.

Girl aged 6 months: transverse inversion recovery (IR 3400/30/700) showing atrophy of basal ganglia and thalami and atrophy of white matter.
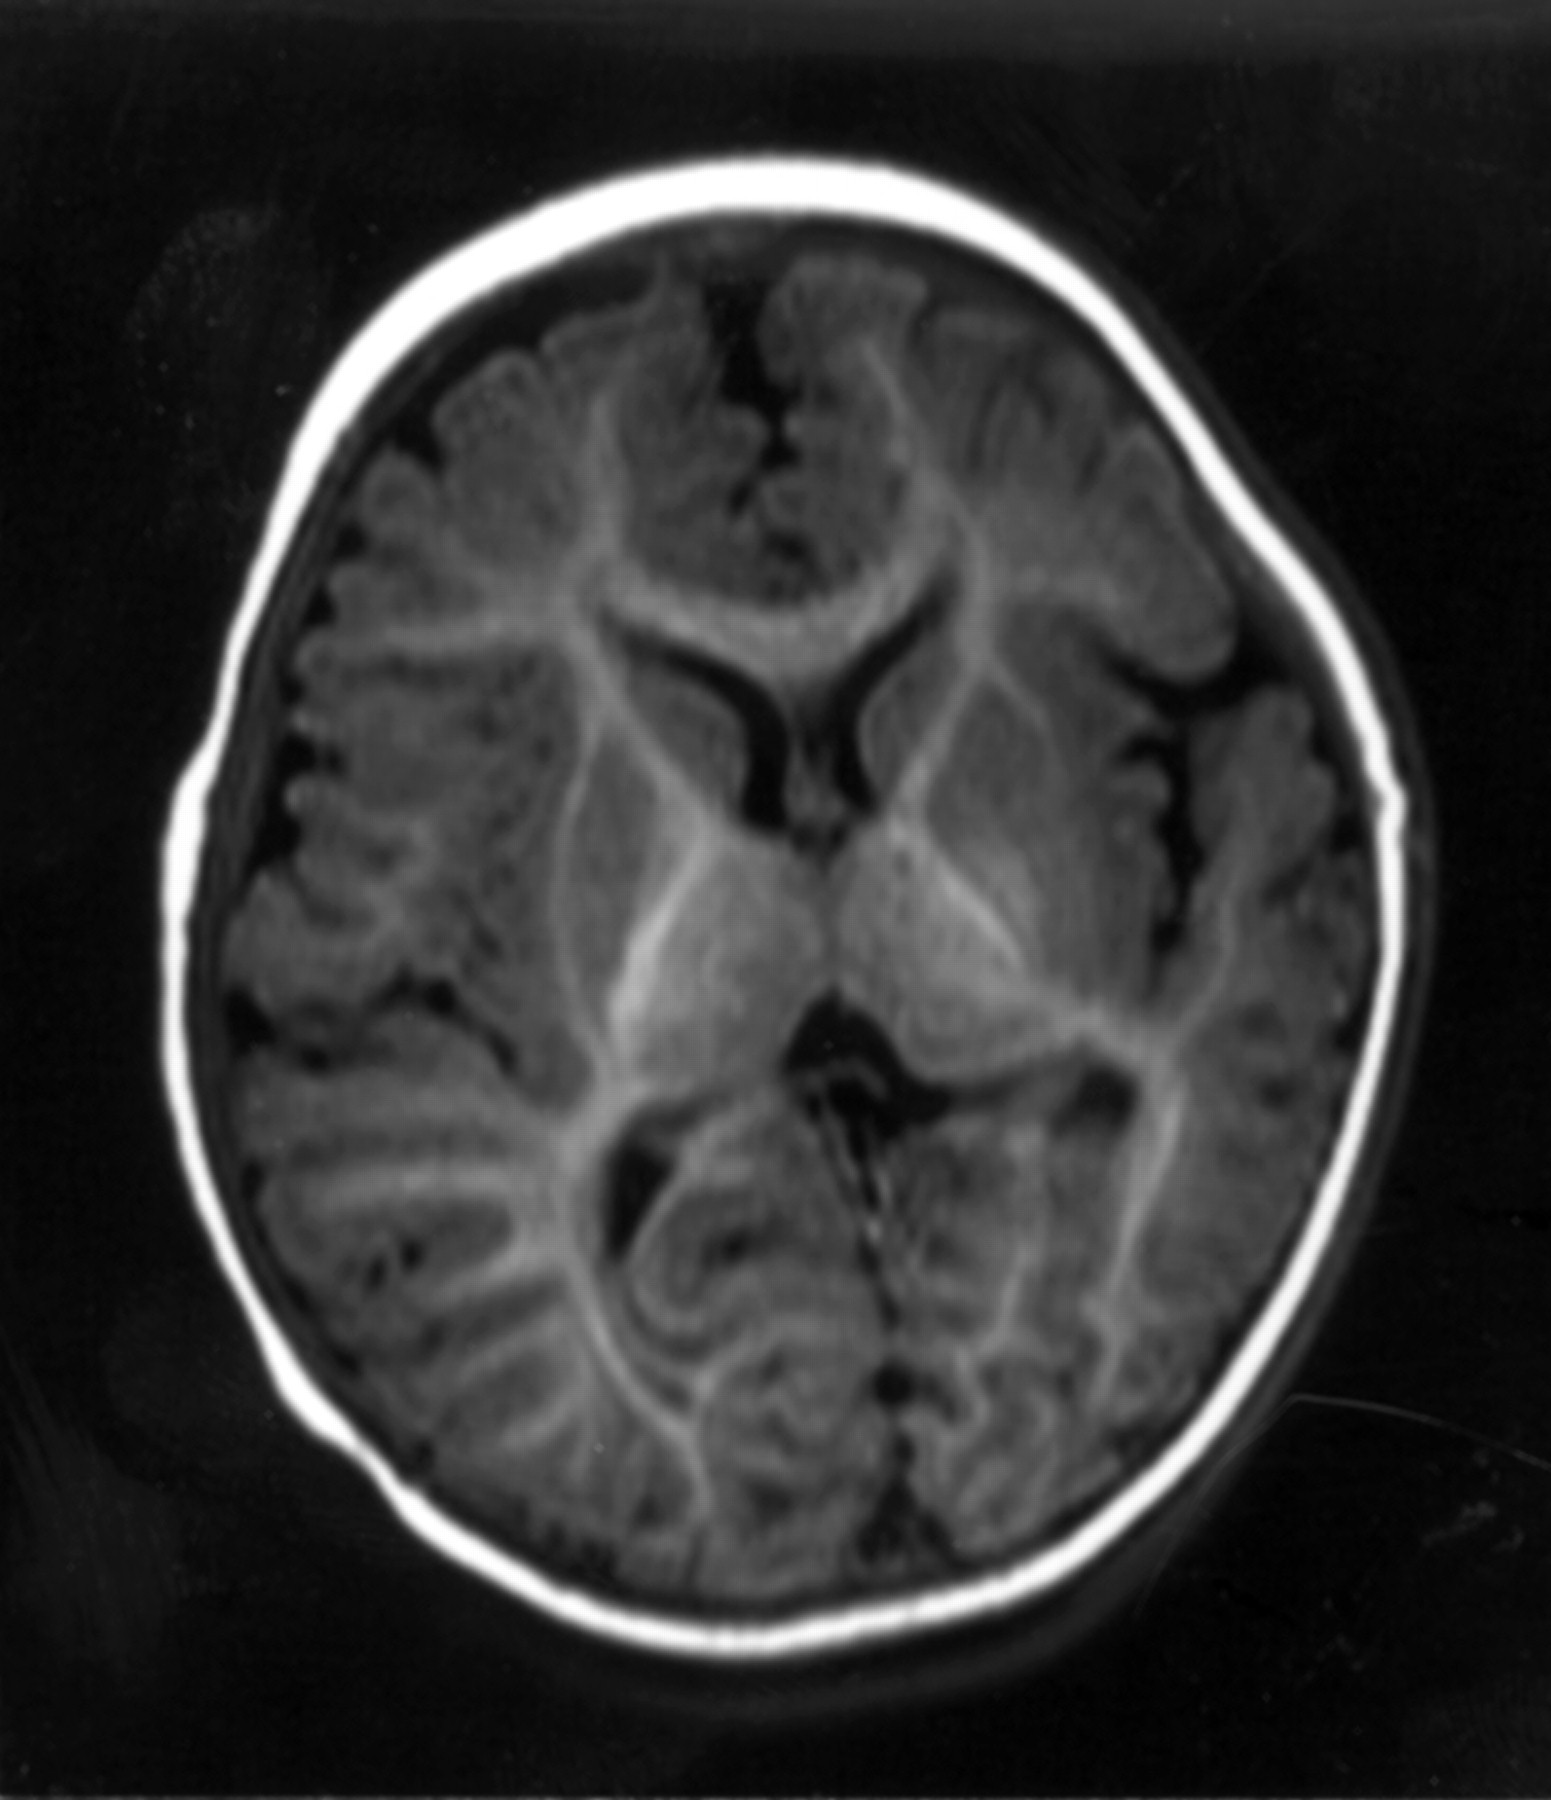
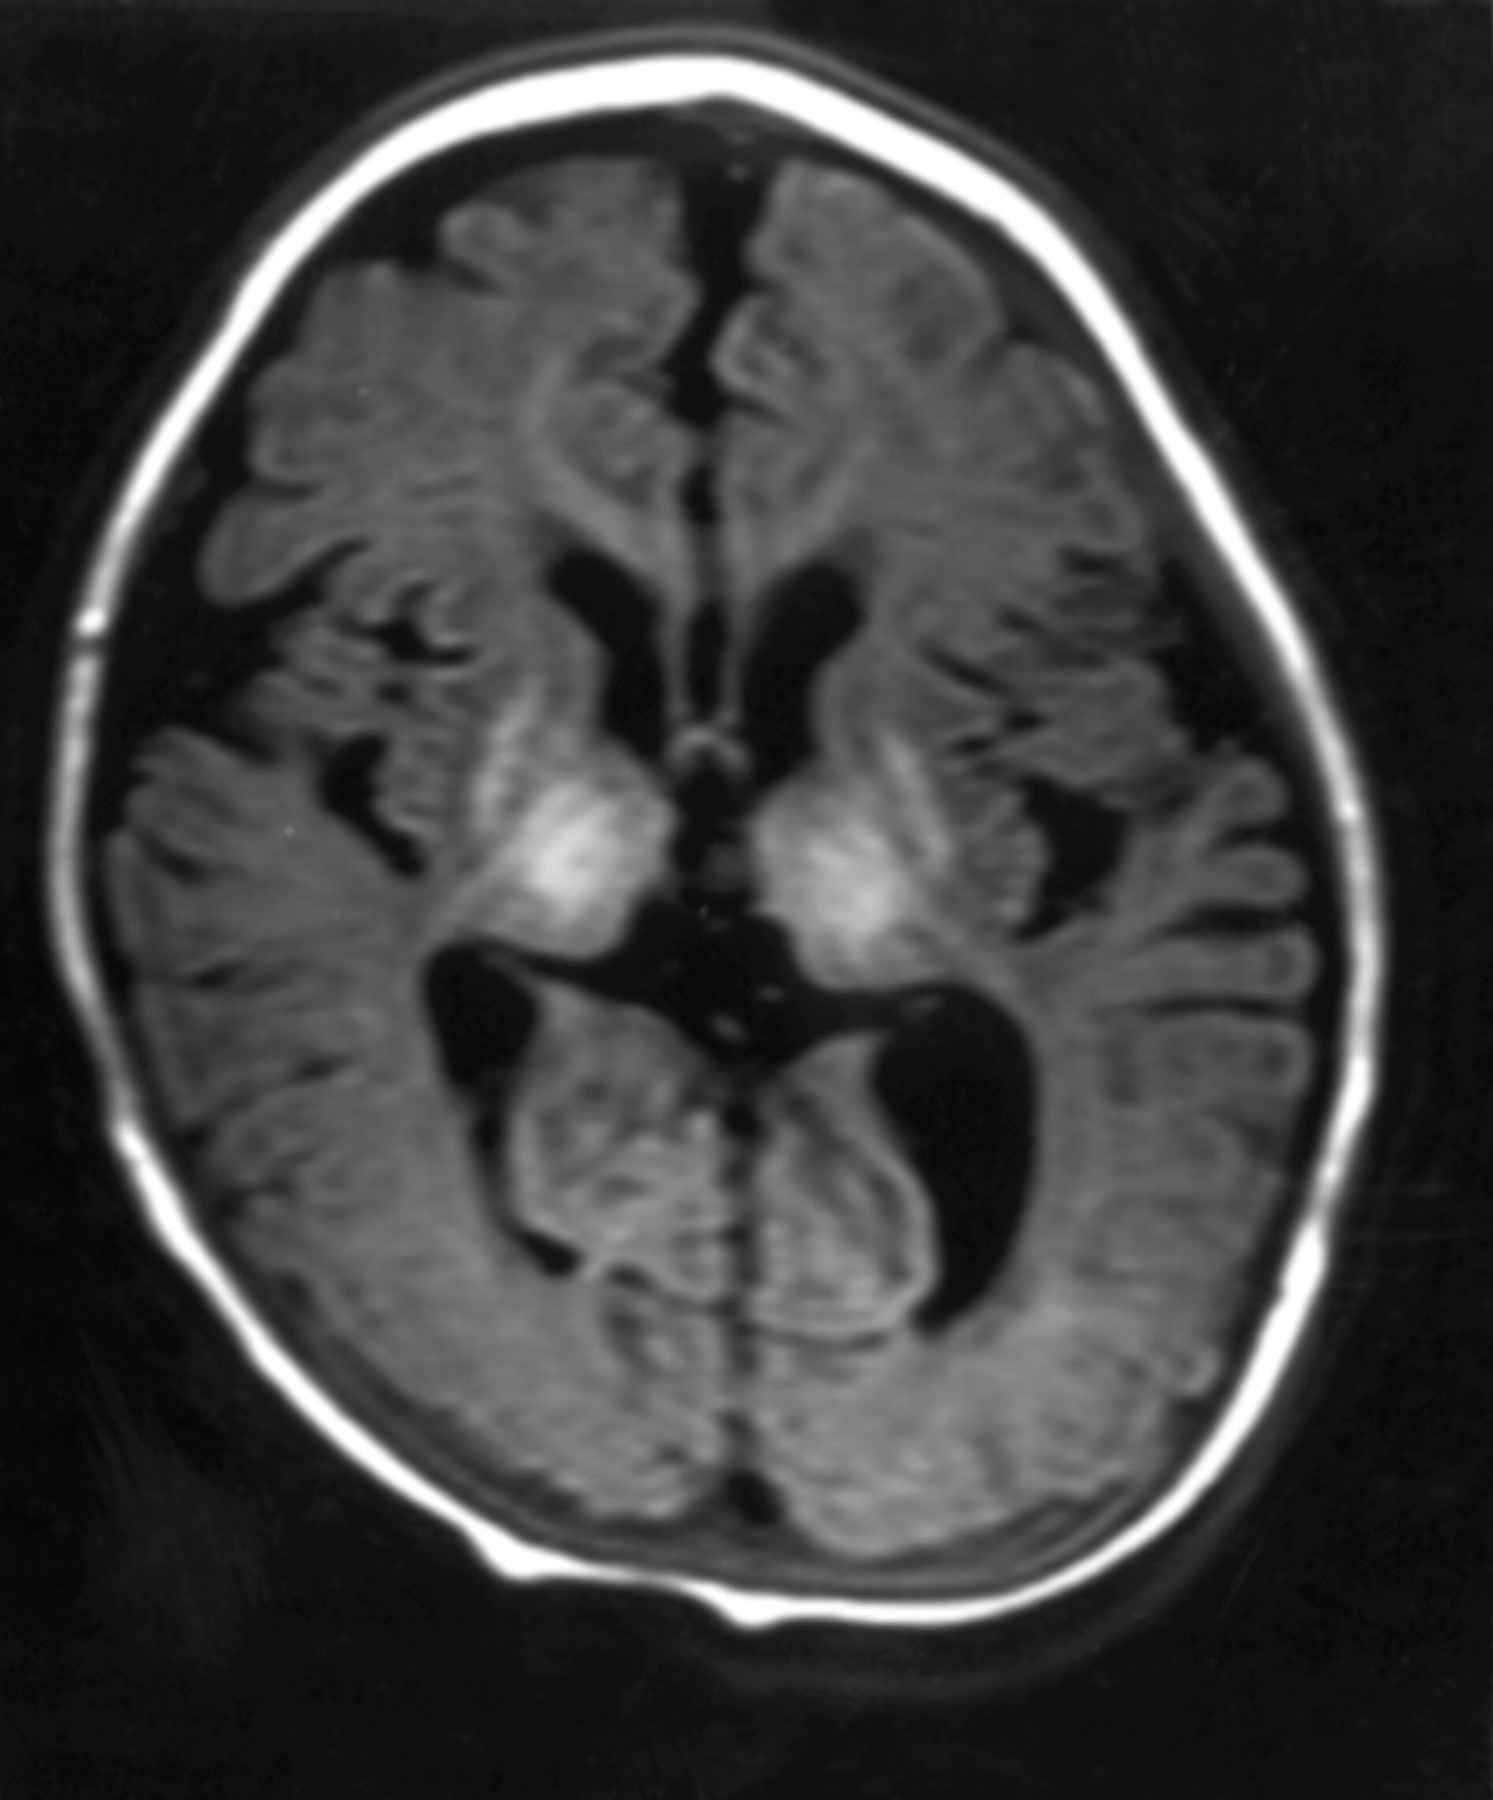
Of the 11 children who had haemorrhagic–ischaemic lesions following the onset of neonatal convulsions, one showed widespread involvement due to herpes infection, and 10 had focal lesions, consistent with focal cerebral infarction in eight (figs 2 and 3), with focal haemorrhages in two.
Boy aged 6 months: transverse inversion recovery (IR 3400/30/700) sequence showing left cerebral infarction seen as low signal involving left parieto-occipital lobe.
Girl aged 5 months: transverse inversion recovery (IR 3400/30/700) sequence showing parasagittal infarction involving both temporo-parieto-occipital lobes (more marked on the left).
Table 3 gives details of the MRI findings.
Vision at 5 months and neuromotor outcome
CORRELATION BETWEEN VISUAL TESTS AT 5 MONTHS OF AGE AND DEVELOPMENTAL QUOTIENT
Number of abnormal visual tests and developmental quotients
Eight children showed abnormal results on more than three visual tests. Seven out of these eight had developmental quotient in the abnormal range.
Twenty one children showed three or fewer abnormalities on visual tests. All had normal developmental quotients (range 87–130). The level of their performance correlated strongly with the number of visual tests passed (0.866). A similar tendency was observed when the number of abnormal visual tests was correlated to each subscale. Figure4 shows the details of the correlation between number of abnormal visual tests and developmental quotients.

Developmental quotients and number of abnormalities on visual tests.
Individual tests and developmental quotients
Table 2 shows the sensitivity, specificity, positive and negative predictive values for the individual tests assessing visual function as predictors of neurodevelopmental outcome. VEP, visual fields and fixation shift show the highest sensitivity, while OKN and acuity have the highest specificity.
CORRELATION BETWEEN VISUAL TESTS AND NEUROMOTOR OUTCOME
Number of abnormal visual tests and neuromotor outcome
Ten children showed abnormal results on three or more visual tests: nine of the 10 had neurological impairment at 2 years, and one was normal. Nineteen children showed abnormal results on two or fewer visual tests: only one child with one abnormality showed hemiplegia while all the other 18 were normal.
Individual visual tests and neuromotor outcome
Table 3 shows the sensitivity, specificity, positive and negative predictive value for the individual vision tests as predictors of neuromotor outcome. VEP, visual fields and fixation shift show the highest sensitivity, while OKN and acuity have the highest specificity.
CORRELATION BETWEEN THE VISUAL ASSESSMENT 5 MONTHS, MRI AND OUTCOME
Ten children had normal MRI: seven of the 10 were normal on all the visual tests and three had only one abnormal visual test: all 10 were within the normal range on both neurological and developmental examination at 2 years.
Ten children had focal lesions. All 10 were normal on the developmental test at 2 years. Eight of the 10 also had a normal neurological examination. The number of abnormal visual tests in these ranged from 0 to 2. The remaining two children showed hemiplegia: one of the two had one and the other three abnormal visual tests.
Nine children had generalised lesions: one was normal at 2 years and had two abnormal visual tests; another one showed a hemiplegia but a normal developmental quotient and had three abnormal visual tests. The remaining seven were abnormal on both neurological examination and developmental scale at 2 years; all seven had more than three abnormal visual tests.
Discussion
The relation between visual impairment and neurodevelopment has been investigated before in preterm infants with brain lesions.5 8-12 27 28 Although some of these studies also included a few full term infants in their cohorts, so far, the possible association between visual function recorded in the first months of life and different aspects of development in full term infants has not been fully investigated. The only studies available are the ones reporting the prognostic value of VEP in infants with birth asphyxia.27 29 30 The aim of this study was to evaluate whether different aspects of visual function which reflect different stages of maturation of the visual system can be related to neurodevelopmental outcome in these infants.
We were able to demonstrate a significant correlation between the extent of visual impairment at 5 months and global outcome at 2 years. Children with three or more abnormal visual tests tended to have an abnormal outcome on both neurological examination and developmental scales, while isolated visual abnormalities tended to be associated with a normal outcome. Interestingly, although children with fewer visual abnormalities showed results in the normal range, their level of performance on the developmental test was related to the number of visual tests passed. While all the infants with normal vision tended to have scores above 100, the infants with two abnormalities had scores between 87 and 102. All the subscales of the developmental scales were equally affected and we did not find any specific association between visual impairment and abnormalities in the subscales assessing visual–motor and perceptual abilities such as eye and hand coordination or performance, which, it might be expected, would be more specifically associated with visual impairment.
Our results suggest that although a correlation can be found, this is probably due to a difference in site and size of the lesions rather than to a causal effect of visual impairment on development. This was also confirmed by MRI. All the children with multiple abnormalities on visual tests had generalised lesions with diffuse involvement of cortical and subcortical structures, while children with fewer visual abnormalities had normal MRI or more focal lesions. The association between the number of abnormal visual tests and outcome might be explained by the fact that the aspects of visual function evaluated in this study are not only related to the primary visual cortex, but reflect the activity and the integrity of multiple areas. While visual fields are mainly related to the primary visual cortex in the occipital lobes, fixation shift and orientation reversal VEP reflect the integrity of a more complex circuit which includes supplementary cortical areas, such as the fronto-parietal or the temporal cortex.15 Multiple abnormalities on the visual tests therefore indicate a more extensive brain damage, and a higher risk of neurological and developmental abnormalities.
Although we were unable to demonstrate a specific association between any single visual test and specific aspects of development, nevertheless, the analysis of the individual tests assessing visual function provided important prognostic information. Normal responses on VEP and fixation shift were reliably associated with normal outcome. This is probably due to the fact that, as we previously reported, the controlling shifts of attention and the discrimination of orientation are mainly sustained by cortical neurons.14-18 Normal responses on these tests would therefore indicate a certain degree of maturation of visual areas of the cortex, and probably of the whole brain. In contrast, normal results on acuity and OKN, which require a lesser degree of cortical maturation, cannot exclude impairment of aspects of cortical function which might mature later. Abnormal results on these tests, however, indicate that even aspects of cortical and subcortical functioning requiring less maturation were affected, and that these visual abnormalities were always associated with an abnormal outcome.
In conclusion, this study suggests that a detailed assessment of various aspects of visual function can provide important information not only on the maturation of visual function, but more generally on the maturation of the brain. Continued follow up of these children will help us to determine any possible association with more specific aspects of visual motor and perceptual abilities at school age.
Acknowledgments
This study was supported by the Medical Research Council.