Article Text

Abstract
AIM To construct a reference range of SpO2 values in healthy preterm infants using a simple data logging device.
METHODS Thirty three healthy preterm infants were monitored for a continuous period of 4 hours at rest using an Ohmeda Biox 3700 E Pulse Oximeter and an electronic data logger (Rustrack Ranger). Stored data were downloaded and saved as individual files on a personal computer.
RESULTS The study group median and 5th and 95th percentiles were used to construct a cumulative frequency curve of time against SpO2 value, representing the normal reference range of SpO2 profiles in healthy preterm infants.
CONCLUSION Comparison of an infant’s SpO2 profile against this curve may be more helpful in guiding supplemental oxygen treatment in that individual than a figure for a mean SPO2 and its standard deviation.
- oxygen saturation
- data logging device
Statistics from Altmetric.com
Infants with chronic lung disease (CLD) are prone to major complications such as acute life threatening events1 and pulmonary hypertension2 3 which may be related to chronic hypoxia.
In recent years monitoring of arterial oxygen saturation (SpO2) using pulse oximetry has become the mainstay of assessment of oxygenation in preterm infants who have prolonged oxygen dependency.4 5 Although evaluation of the need for supplemental oxygen is invariably guided by measurements of SpO2, there is currently no agreement as to what level of SpO2 is acceptable in preterm infants with CLD. In the absence of any randomised trials comparing the safety and efficacy of different SpO2 levels maintained by supplemental oxygen therapy, one approach is to aim for normal SpO2 levels in these infants.6 7 There is, however, a lack of user friendly data on normal SpO2 in healthy preterm infants.
Previous studies attempting to define a normal reference range of SpO2 have used plethysmography and graphic analysis techniques.4 7 Although this methodology is undoubtedly meticulous, it is labour intensive and therefore impracticable for routine use in the neonatal nursery. Furthermore, data have been expressed as mean (SD) SpO2 rather than as a distribution of SpO2 values found with their relative frequencies of occurrence. A limitation of using most internal oximeter data storage modes is that they involve intermittent sampling or averaging techniques which may lead to data being erroneously lowered by movement artefact. We have recently studied the usefulness of a data logging device to assess SpO2 profiles. We describe our experience of using this system to collect data on SpO2 profiles, to construct a simple reference range of SpO2 values in healthy preterm infants.
Methods
Preterm infants who had received mechanical ventilation for less than six hours and supplemental oxygen for less than 48 hours were recruited after parental consent had been obtained. Infants with known congenital anomalies or cardiorespiratory disorders were excluded.
Demographic data were collected from maternal and infant case notes. Gestational age was assessed from maternal dates and/or early antenatal ultrasound examination. All infants were studied for a continuous period of four hours following a feed, while asleep, or during a period of quiet wakefulness. The infant was left undisturbed and the timing and duration of periods of activity (which may have led to signal artefact) were recorded separately by the nursing staff.
Arterial oxygen saturations and heart rate were continuously monitored using a Ohmeda Biox 3700e pulse oximeter with an averaging time of 3 seconds. The saturation probe was placed on the infant’s hand or foot in a position that provided the most optimal signal.
An intelligent electronic datalogger (Rustrak Ranger, Outram Research, Bosham, UK) was connected to the analogue outputs for heart rate and saturation on the pulse oximeter. The logger was used in adaptive store mode, which has a sampling frequency of 2 Hz, but a storage frequency that varies continuously according to the remaining memory and the variability of the signal. This storage mode permits the accurate recording of rapid changes in saturation or heart rate, and enables movement artefact to be distinguished.
Stored data were downloaded from the Rustrak Ranger and saved as individual files on a personal computer. Each infant’s files of SpO2 and heart rate profiles were subsequently displayed in graphic form and analysed using dedicated software. After exclusion of obvious movement artefacts (defined as deflections to zero of both SpO2 and heart rate tracings), analyses were performed in a standardised manner by the same observer (AN); this analysis involved calculation of: (1) the total duration of the recording; (2) overall mean SpO2; and (3) cumulative time (expressed as a percentage of total time) spent below a range of individual SpO2 levels between 85 and 100%. Using the study group median and 5th and 95th percentiles, a cumulative frequency curve of time against SpO2 level was then constructed. This represented the normal reference range of SpO2 profiles in healthy preterm infants. Clinical staff were unaware of any of the results of the saturation studies.
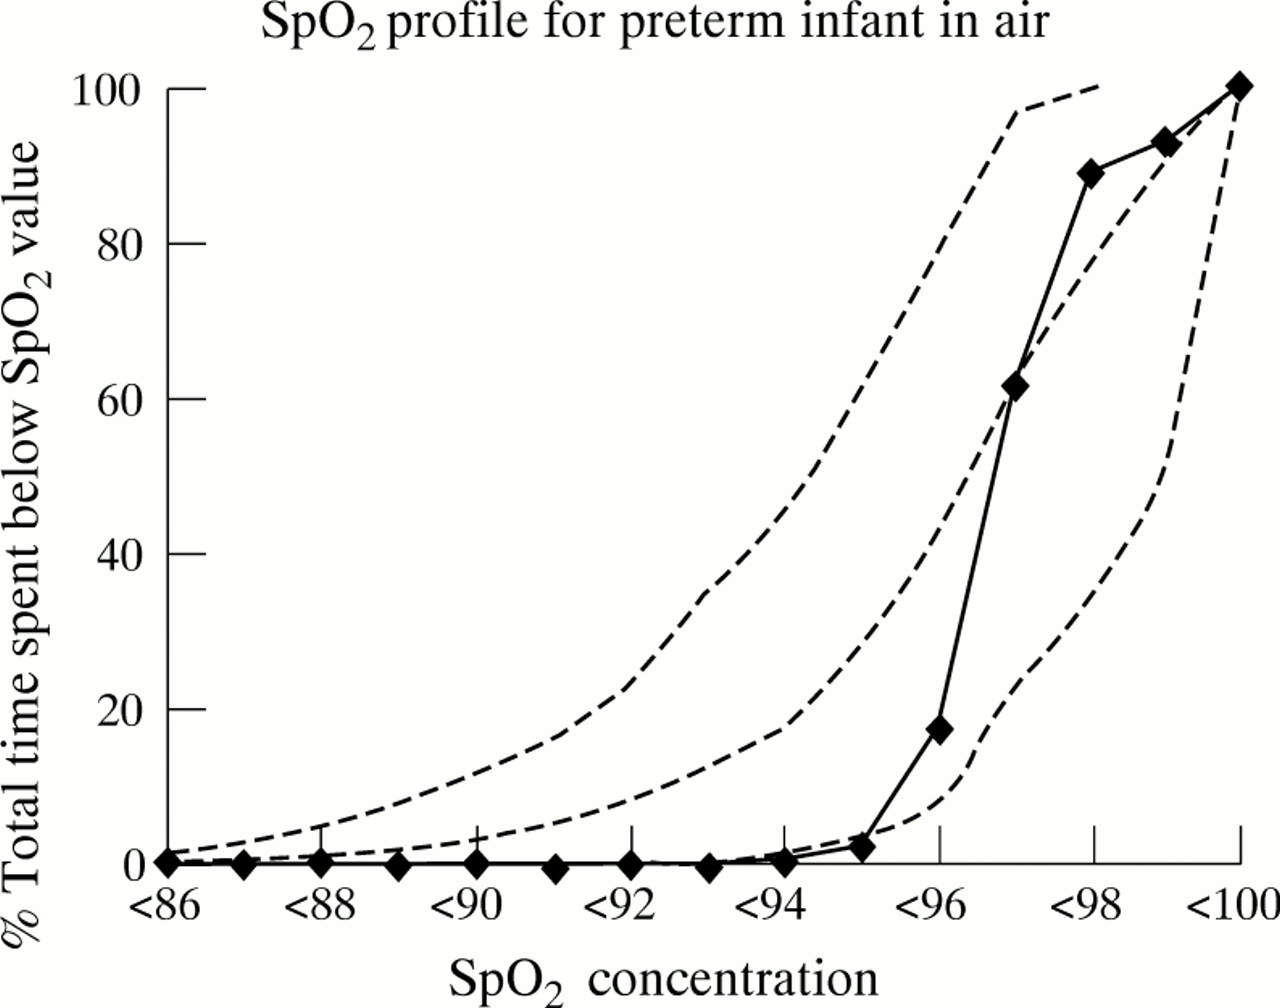
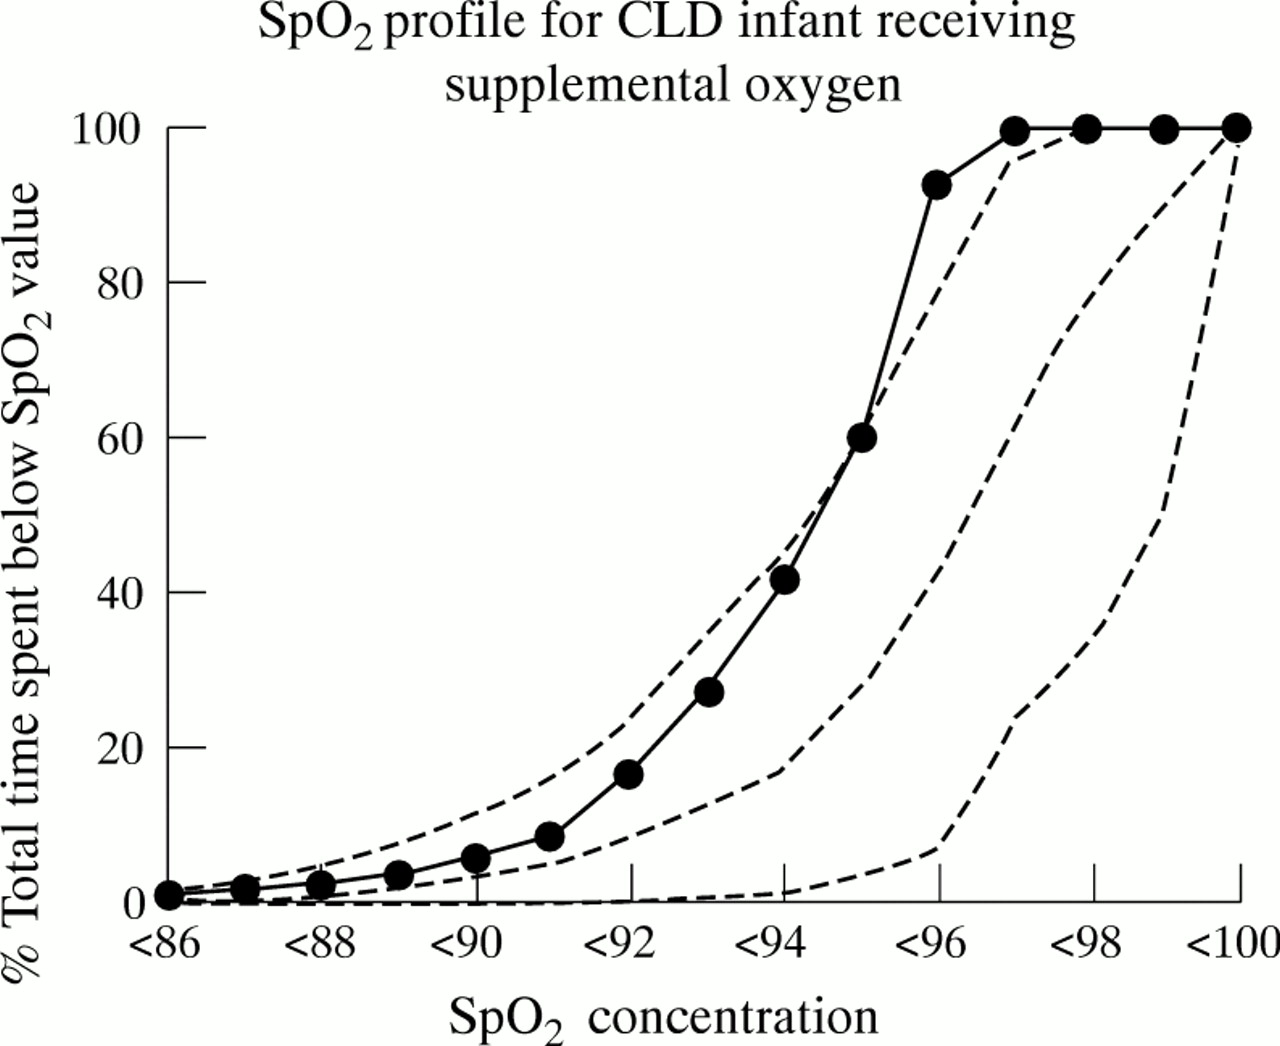
Monitoring and analysis of SpO2 profiles was then performed in a similar way in a well preterm infant in whom it was no longer felt that there was a clinical need for oxygen and in an infant with CLD who was receiving supplementary oxygen. Individual SpO2profiles were superimposed on the normal reference range to highlight any differences.
Results
Thirty three infants, 12 boys and 21 girls, were studied over a period of 7 months. Their median gestation was 33 (range 30–34) completed weeks and the median birthweight was 1798 (1020–2322) g. The median age at the time of study was 14 (range 2–28) days. No infant was receiving methylxanthines and all were breathing room air at the time of study. None had received a blood transfusion.
The median duration of monitoring (after exclusion of artefacts) was 240 (range 220–240) minutes. The median value of all the infants’ mean SpO2 values was 97% (range 92–100%). Figure 1 shows the graph of cumulative time against SpO2 level for healthy preterm infants.

Examples of individual SpO2 profiles are shown in figs 2and 3.

Discussion
In this study we have constructed a reference range of normal SpO2 distribution profiles in healthy preterm infants using a data logging device and dedicated software. The methodology used for analysing the data is relatively simple and practicable for routine use in the neonatal nursery.
The median of the mean SpO2 levels reported in this study (97%) is lower than the baseline SpO2 value of 99.5% cited in a previous study in which a Nellcor N200 pulse oximeter was used.4 Calculated levels of SpO2 with the Ohmeda Biox III are about 2% lower than those obtained with the Nellcor N200, which may partly explain the discrepancy between the studies.8 If allowance is made for the different instruments used in the previous study, our results confirm that healthy preterm infants maintain relatively high baseline SpO2 values. The consistency of this finding is particularly surprising given the marked differences in pulse oximeter setup and analysis of SpO2 recordings in the two studies. Although we accept the desirability of detailed examinations of simultaneous SpO2, heart rate, and respiratory tracings,4 7 particularly to detect acute cardiorespiratory events, we feel that this methodology cannot routinely be used and is not relevant when the main objective is to detect persistent mild hypoxia.
None of our infants had received a blood transfusion before the study. It is likely, therefore, that all infants had predominantly haemoglobin F (HbF) in their blood. As HbF has a greater affinity for oxygen than haemoglobin A (HbA), it could be argued that normal SpO2 in our study infants could not be used to assess an older infant with predominantly HbA in their blood or one who had been transfused. However, previous studies in infants have suggested that the amount of HbF does not have a clinically significant effect on SpO2.9
The cumulative frequency curve of oxygen saturations represents the range of SpO2 profiles in normal preterm infants. This curve may be more helpful in guiding supplemental oxygen treatment in infants with CLD as it provides a more visual user friendly display of the normal range of oxygen saturation than a single figure for a mean (SD) SpO2 does. For example, monitoring an infant in whom it is thought that supplemental oxygen treatment may be required in air over a period of a few hours would permit the construction of an individual SpO2 profile. By superimposing this individual profile on the group cumulative frequency curve, any deviation from the normal SpO2 profile pattern could be assessed. If the infant’s profile shifts to the left (with a greater proportion of time spent at SpO2 levels below normal values), this might indicate a requirement for supplemental oxygen. The exact requirement could also be adjusted by repeating the process once the infant was receiving supplemental oxygen (as illustrated by the SpO2curve of the infant in fig 3). Oxygen saturation profiles could also be produced for older children to enable infants with CLD to be assessed for their oxygen requirement after discharge from the neonatal unit. Further studies are required to assess whether the decision to stop an infant’s supplementary oxygen, based on clinical examination and routine observations of oxygen saturations in the neonatal nursery, correlates with a normal oxygen saturation profile; and whether deviation from the oxygen saturation profile in infants with previous CLD who are breathing room air is associated with a poorer outcome.
Infants in this study were monitored for a continuous period of four hours while undisturbed. Recording of SpO2 levels during activities such as feeding and handling were not studied because of the potential inaccuracies related to movement artefact. Monitoring for a more prolonged period would inevitably have included such episodes, and would have required further detailed examination of SpO2tracings to exclude artefacts. Furthermore, state of wakefulness and feeding in themselves may affect SpO2values.7 10 Our aim in this study was to develop a method of assessing SpO2 profiles that was easy to use. Restricting the duration of recording to four hours permitted a reasonable period of study, while maintaining the practicability of the method. Although we excluded major movement artefact from the analysis, we cannot be certain that minor artefacts resulting in transient desaturation were detected. The most likely effect of including these events would have been to lower marginally the overall mean SpO2.
In summary, we have described a convenient, relatively inexpensive, and easy to use system to obtain SpO2 profiles in healthy preterm infants. Using this method we have constructed a normal reference range for SpO2. Comparison of an individual’s SpO2 profile against these normal values may help to guide supplemental oxygen treatment in infants with CLD.