Article Text

Abstract
Objective To analyse survival trends and regional variation for very preterm infants admitted to neonatal care.
Setting All neonatal units in England.
Patients Infants born at 22+0–31+6 weeks+daysgestational age (GA) over 2008–2014 and admitted to neonatal care; published data for admitted infants 22+0–25+6 weeks+days GA in 1995 and 2006, and for live births at 22+0–31+6 weeks+days GA in 2013.
Methods We obtained data from the National Neonatal Research Database. We used logistic regression to model survival probability with birth weight, GA, sex, antenatal steroid exposure and multiple birth included in the risk adjustment model and calculated annualpercentage change (APC) for trends using joinpoint regression. We evaluated survival over a 20-year period for infants <26 weeks’ GA using additional published data from the EPICure studies.
Results We identified 50 112 eligible infants. There was an increase in survival over 2008–2014 (2008: 88.0%; 2014: 91.3%; adjusted APC 0.46% (95% CI 0.30 to 0.62) p<0.001). The greatest improvement was at 22+0–23+6 weeks (APC 6.03% (95% CI 2.47 to 3.53) p=0.002). Improvement largely occurred in London and South of England (APC: London 1.26% (95% CI 0.60 to 1.96); South of England 1.09% (95% CI 0.36 to 1.82); Midlands and East of England 0.15% (95% CI −0.56 to 0.86); and North of England 0.26% (95% CI −0.54 to 1.07)). Survival at the earliest gestations improved at a similar rate over 1995–2014 (22+0–25+6 weeks, APC 2.73% (95% CI 2.35 to 3.12), p value for change=0.25).
Conclusions Continued national improvement in the survival of very preterm admissions masks important regional variation. Timely assessment of preterm survival is feasible using electronic records.
- neonatology
- data collection
- epidemiology
- health services research
This is an Open Access article distributed in accordance with the terms of the Creative Commons Attribution (CC BY 4.0) license, which permits others to distribute, remix, adapt and build upon this work, for commercial use, provided the original work is properly cited. See: http://creativecommons.org/licenses/by/4.0/
Statistics from Altmetric.com
What is already known on this topic?
The EPICure studies found survival of extremely preterm infants admitted to neonatal care in England to improve from 1995 to 2006.
We identified no nationwide assessment of preterm survival following neonatal care since that time. This is likely to reflect the difficulties and costs of large-scale data collection.
What this study adds?
Our study shows that survival of preterm infants admitted to neonatal care has continued to improve, particularly for infants of the lowest gestations. However we also identified regional variation that is not explained by patient characteristics.
Improvements have not been consistent across the country, warranting further investigation into the reasons for variation.
As large, population-based studies are required to detect unusual variation in patient outcomes, electronic patient records provide opportunity to conduct such studies efficiently.
Introduction
Preterm birth is the primary cause of neonatal death worldwide and carries lifelong risks to health.1 2 Population, as opposed to hospital-based data, is essential to obtain an unbiased picture of survival, but undertaking such studies can be challenging and expensive.3 National data are also required to assess regional variation, a necessary step to identifying areas for improvement and reducing health inequalities.
The National Neonatal Research Database (NNRD) is a repository of a predefined set of variables (the Neonatal Data Set; National Health Service (NHS) Information Standard SCCI1595), extracted quarterly from clinician-entered, point-of-care electronic patient records (EPR) for all infants admitted to neonatal units in England, Wales and Scotland.4 Data are cleaned (eg, assessed for duplicates and inconsistencies), potential errors are checked with clinical teams and multiple episodes merged to create a single patient record.
We evaluated trends in survival for infants born 22+0–31+6 weeks’ gestation and admitted to neonatal units in England 2008–2014. We assessed regional variation and relationship with socioeconomic deprivation. We examined survival trends over a 20-year period for those born at the earliest gestations by including previously published data. The secondary aims were to examine 28-day survival and postnatal age at death and develop a statistical model to predict survival.
Methods
We extracted NNRD data for infants born January 2008–December 2014 from 22+0–31+6 weeks+days gestational age (GA) and admitted to a neonatal unit in England (data from Scotland and Wales were unavailable in 2008). The NNRD is approved by the National Research Ethics Service (16/LO/1093) and the Caldicott Guardians of contributing NHS Trusts. Approval is held from the Confidentiality Advisory Group of the Health Research Authority to hold NHS numbers for linkage (ECC8-05(f)/2010).
Data comprised GA (the best obstetric estimate, initially based on last menstrual period and modified by antenatal ultrasound), birth weight (BW), singleton/multiple pregnancy, administration of antenatal steroids, vaginal/caesarean delivery, maternal age, maternal ethnicity, smoking during pregnancy and Index of Multiple Deprivation (IMD) 2010 quintile based on lower super output area (LSOA) rank.5 We identified small-for-gestational age infants (BW <10th centile for gestation), calculated BW SD score (UK-WHO preterm growth reference6), and excluded infants with BW greater than 4SD from the gestation and sex-specific mean as we considered these potentially erroneous. Outcomes were determined from discharge data.
To reduce missing data we linked the NNRD to UK Office of National Statistics-Hospital Episode Statistics (ONS-HES) data. ONS-HES data were used for 28-day survival only as we could not ascertain if death occurred in neonatal care. Data extraction and linkage were carried out using SAS V.9.3.
Statistical analysis
We estimated time trends for survival to discharge and 28 days using joinpoint regression.7 8 We used joinpoint regression to enable detection of any changes in survival trends. Joinpoint regression allows the number and location of the change points to be unknown and determines which change points, if any, fit the data best. The minimum and maximum number of joinpoints that could be selected was 0 and 5, respectively. We log-transformed rates; hence, trends are presented as annual percentage change (APC), the annual rate of change of the survival rate. We directly standardised survival rates for risk of death,9 10 grouping infants into 10 risk categories, each with an equal number of predicted deaths. The risk of death was calculated using logistic regression, including established clinical risk factors (GA, BW, sex, singleton/multiple pregnancy, any antenatal steroids (no/yes)).11 Online supplementary file 1 material shows the full methods including assessment of model fit.
Supplementary file 1
We checked for seasonality by varying the autocorrelation parameter. As the number of neonatal units contributing data increased over time, we analysed complete neonatal networks as a sensitivity analysis. We tested for differences in postnatal age at death using quantile regression.
We restricted the regional analysis to 2011 onwards in view of the possibility that lower population coverage in earlier years might bias regional estimates. Infants were assigned to one of the four regions (London, Midlands and East of England, North of England and South of England) based on mothers’ residence. We calculated crude and standardised rates of survival to discharge and trends in crude survival; standardised trends by region were not calculated due to low numbers. We calculated crude and standardised rates of survival to discharge for the highest and lowest IMD quintile and computed the risk difference (RD). We added region (categorical) and IMD decile (continuous) to the risk adjustment model to test for residual regional variation.
We compared NNRD data with published data for England. First we used joinpoint regression to compare recent trends in the NNRD data (2008–2014) with previous estimates from the EPICure studies12 13 (1995 and 2006). EPICure 19912 involved all deliveries at 20+0–25+6 weeks+days GA in March–December 1995 in every maternity unit in the UK and Ireland. EPICure 213 provided information on all babies born 20+0–25+6 weeks+days GA in England in 2006. Only infants admitted to neonatal care in England were included.
Second, we compared the number of infants at each GA week by 28-day survival status and region of mother’s residence in the NNRD (denominator: neonatal unit admissions) with published ONS data14 15 (denominator: live births) for infants born at 22+0–31+6 weeks+days GA. Data were compared for 2013 due to availability of England-only ONS data.
Results
Study population
Data were available for 71% of neonatal units in England for 2008, 80% in 2009, 86% in 2010, 97% in 2011, 99% in 2012 and 100% in 2013 and 2014. There were 50 467 infants born over 2008–2014 at 22+0–31+6 weeks GA who were admitted to a neonatal unit in England. We excluded 38 babies with implausible BW for GA, and 317 because BW, sex or multiple birth status was missing, leaving 50 112 infants in the study cohort. Population characteristics were broadly similar across all 7 years (table 1), although some differences were statistically significant. The 20% most deprived LSOA contributed over 30% of the study population, while the 20% least deprived LSOA contributed 13%.
Population characteristics for infants born 22+0–31+6 weeks’ gestation, England 2008–2014, and admitted to a neonatal unit contributing to the National Neonatal Research Database
Survival to discharge from 2008 to 2014
Of the 48 422 admitted infants for whom outcomes were known, 43 444 (89.7%) survived to discharge over the whole period. Table 2 shows the associations between survival and infant characteristics. There was an increase in the percentage of admitted infants who survived to discharge from 88.0% in 2008 to 91.3% in 2014. Survival increased with GA from 17.9% for 22+0 to 22+6 weeks to 98.1% for 31+0–31+6 weeks. Crude survival rates were lower for boys, vaginal delivery and infants whose mothers were younger, did not receive antenatal steroids, smoked and came from more deprived areas.
Survival by population characteristics for infants born 22+0–31+6 weeks’ gestation, England 2008–2014, and admitted to a neonatal unit contributing to the National Neonatal Research Database
The APC for crude survival was 0.51% (95% CI 0.35 to 0.67, p<0.001), and after standardisation for risk of death, 0.46% (95% CI 0.30 to 0.62, p<0.001). Results were similar for all sensitivity analyses.
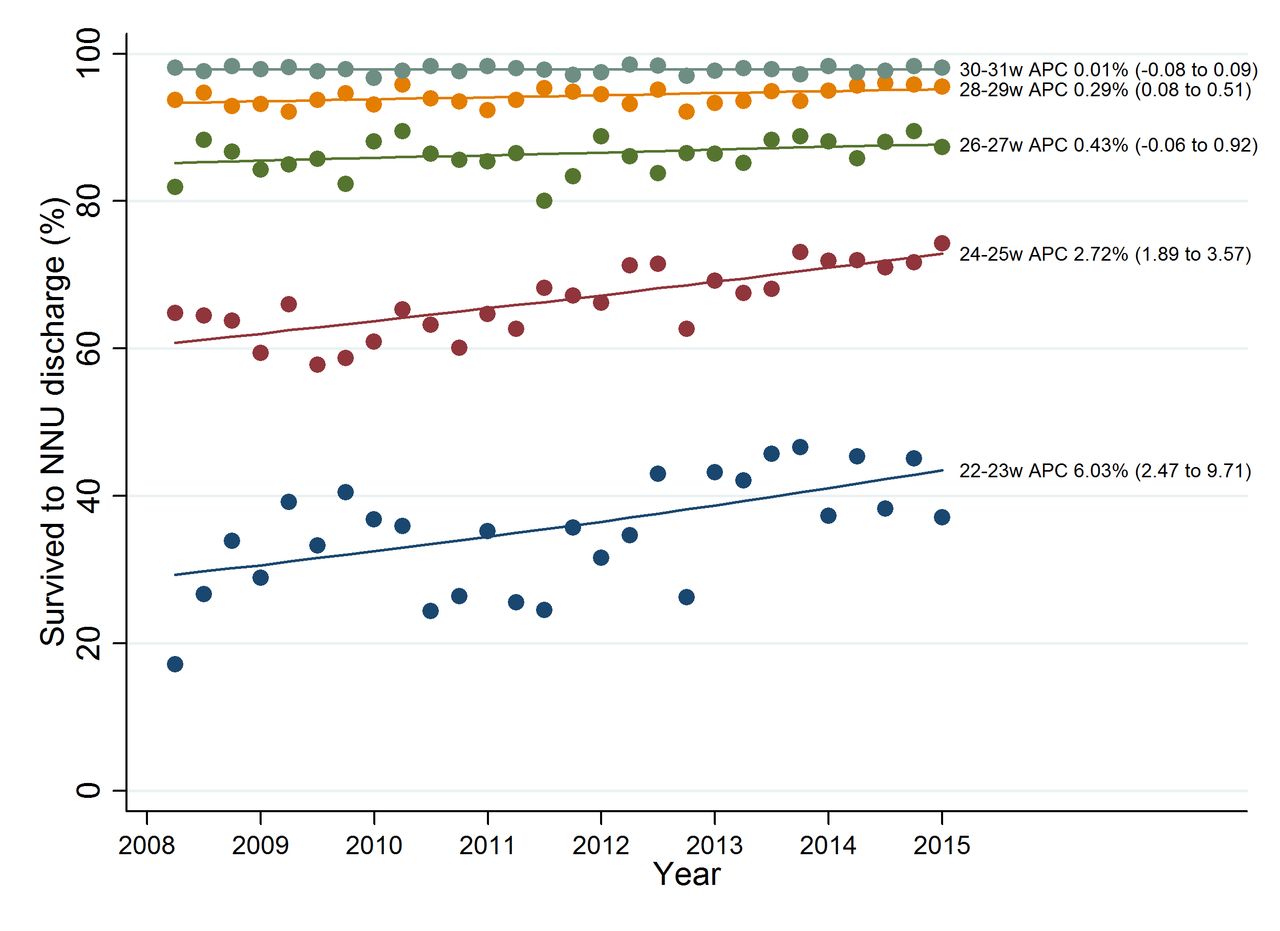
Trends in survival to discharge by GA
Figure 1 shows the joinpoint regression analysis for survival to discharge by GA group. Improvements were less marked with increasing GA (22+0 to 23+6 weeks: APC 6.03% (95% CI 2.47 to 3.53), p=0.002; 30+0 to 31+6 weeks APC 0.01% (95% CI −0.08 to 0.09), p=0.9).

Joinpoint regression analysis for crude rates of survival to discharge for admitted infants born at 22+0–31+6 weeks’ gestation by birth year (2008–2014). APC, average percentage change.
Survival to 28 days from 2008 to 2014
Fifty additional deaths were identified by linkage with ONS-HES, of which 20 were within 28 days. There was an increase in the percentage of infants who survived to 28 days from 91.4% in 2008 to 93.5% in 2014. Survival improved with GA (48.4% at 22+0 to 23+6 weeks to 98.2% at 30+0 to 31+6 weeks). The APC for crude 28-day survival and after standardisation for risk of death were similar (crude: 0.30% (95% CI 0.15 to 0.45), p<0.001; after standardisation: 0.27% (95% CI 0.11 to 0.44), p=0.002). The results were also similar when only neonatal networks where all hospitals contributed data for the whole period were examined (crude APC 0.35% (95% CI 0.19 to 0.52); adjusted APC 0.30% (95% CI 0.14 to 0.47)).
Postnatal age at death from 2008 to 2014
Twenty-four per cent of deaths occurred within 24 hours, 28% between 25 hours and 7 days, 26% between 8 days and 28 days, and 23% beyond 28 days. The 75th percentile for postnatal age at death fell from 27.2 days in 2008 to 20.8 days in 2013 but rose to 24.3 days in 2014 (estimated average annual decrease 2008–2014, 0.92 days (95% CI 0.2 to 1.7) p=0.02); there was no evidence of a change in the median and 25th percentile.
Variation by region and IMD quintile using data from 2011 onwards
Crude survival varied from 89.3% (95% CI 88.6 to 89.9) in the Midlands and East of England to 91.1% (95% CI 90.3 to 91.8) in London; after standardisation the range was 89.2% (95% CI 87.3 to 91.1) to 91.6% (95% CI 89.1 to 94.2). Adjusted survival in the other regions was 90.3 (95% CI 88.0 to 92.5) in the South of England and 89.8 (95% CI 88.0 to 91.8) in the North of England. Only London and the South of England showed improvements in crude survival over 2011 to 2014 (APC: London 1.26% (95% CI 0.60 to 1.96); South of England 1.09% (95% CI 0.36 to 1.82); Midlands and East of England 0.15% (95% CI −0.56 to 0.86); North of England 0.26% (95% CI −0.54 to 1.07)). Infants from the most deprived quintile had lower survival rates compared with those from the least deprived quintile (89.5% (95% CI 88.9 to 90.1) vs 91.1% (95% CI 90.2 to 92.1), RD 1.6% (95% CI 0.5 to 2.7)), but no difference remained after standardisation (89.8% (95% CI 87.9 to 91.5) vs 90.1% (95% CI 87.1 to 93.2), RD 0.3% (95% CI −3.3 to 3.9)). Inclusion of IMD decile in the risk adjustment model did not change results for each region, with evidence of residual variation across regions (p<0.001 from joint test of region indicators).
Survival to discharge from 1995 to 2014 for extremely preterm infants
We found improvements in survival to discharge of infants born 22+0–25+6 weeks+days to have continued at a similar rate across 1995 (EPICure), 2006 (EPICure 2) and 2008–2014 (NNRD). The EPICure studies found that survival increased from 40% in 1995, to 53% in 2006, and based on NNRD data, to 66% (654/992) in 2014. The APC for 1995–2014 was 2.73% (95% CI 2.35 to 3.12), with no evidence for a change in the trend (p=0.25). Figure 2 shows trends in gestation-specific survival from 1995 to 2014.

Survival to discharge for infants born 23–25 weeks and admitted to neonatal units in England in 1995 (EPICure; triangle symbol), 2006 (EPICure 2; cross symbol) and 2008–2014 (NNRD; circle symbol). APC, average percentage change; NNRD, National Neonatal Research Database; NNU, neonatal unit.
Comparison with ONS data
The number of infants known to have survived to 28 days among admissions of infants born 22+0–31+6 weeks+days GA recorded in the NNRD for England in 2013 was 6812. This represents 97% (6812/7027) of infants surviving to 28 days recorded by the ONS. There were 538 deaths before 28 days recorded for neonatal admissions in the NNRD, representing 64% (538/845) of deaths among live births in the ONS data. Most of the discrepancy occurred at earlier gestations; there were three survivors and nine deaths among admissions of infants at 22 weeks’ GA in the NNRD, compared with 14 survivors and 130 deaths in the ONS (table 3 shows the corresponding numbers for each GA week). The number of NNRD admissions as a percentage of ONS live births of infants 23+0–31+6 weeks+days GA was 89% for the Midlands and East of England, 91% for London, 89% for the South of England and 92% for the North of England in 2013. Table 3 shows corresponding numbers for each GA week; there were no clear patterns indicating regional differences in the proportion of live births admitted to neonatal care.
Comparison of NNRD (all admissions to neonatal care among births in England in 2013) and ONS (all live births in England in 2013)
Predictive model
Results from the logistic regression model are shown in online supplementary table 1. The survival predictions are illustrated in online supplementary figures 1–8. The model predicted well, with an area under the receiver operating characteristic curve of 0.84 (see online supplementary material for further performance statistics).
Discussion
We identify continuing improvement in the survival of very preterm infants admitted to neonatal care in England, from 1995 to the present, with the greatest increase in the most immature infants. Of note, there is evidence of a north-south divide, and persisting regional variation after adjustment for infant characteristics and socioeconomic differences.
A key strength is that over 50 000 very preterm infants were included, representing almost all neonatal admissions in the country during the period. A novel strength is the use of the NNRD, a repository of point-of-care, EPR-derived data, facilitating up-to-date assessment of neonatal outcomes. The estimated survival probabilities, based on near-contemporaneous data, can help guide discussions with parents, noting however the need to emphasise that these relate not to total live births, but to infants admitted to intensive care, and are valuable information for clinicians, managers and commissioners. Validation of the prediction model using a future cohort would confirm its applicability; such a cohort can be easily established from new admissions in the NNRD. The risk adjustment variables were important, unambiguous clinical characteristics, also obtained from the NNRD. We took several steps to limit or investigate potential bias and conclusions remained valid following a number of sensitivity analyses. Around 3.4% of infants had missing outcome data, which could bias the assessment of survival trends. Outcomes were missing due to transfer to a neonatal unit or specialist surgical provider not contributing data to the NNRD. While the number of neonatal units contributing increased over time, sensitivity analysis including only providers contributing data throughout the period yielded similar results. A limitation is that live-born infants who died before admission to neonatal care were not included. This is illustrated by the lower number of deaths of admitted infants recorded in the NNRD compared with deaths among live births in the ONS, largely at the earliest gestations. This limitation was unavoidable as data capture is triggered by neonatal unit admission. Changes in survival of admitted infants could result from changes in admission practices over time. Although such changes could not be ascertained from the data available, trends persisted after adjustment for key risk factors. However the similarity with ONS data for the number of infants surviving to 28 days provides reassurance on population completeness for admitted infants. Regional variation could be attributable to differences in criteria for active management of extremely preterm infants. If the southern regions have higher survival because the sickest infants are less likely to be admitted for active care, we would expect a lower proportion of live births to be admitted in these regions. Comparison of regional ONS and NNRD data showed no such pattern, although regional ONS data on infants born at 22 weeks’ GA were unavailable.
Our study covers the entire population of neonatal admissions in a geographically defined region. This contrasts with previous reports such as those from the US National Institute of Child Health and Human Development Neonatal Research Network that focus on admissions to tertiary neonatal units,16 17 a bias that may predispose to exaggerated estimates of survival. Nonetheless, survival rates were similar; in our study survival to discharge for infants at 24 weeks in 2014 was 66%, compared with the 65% survival in 2012 reported in a US tertiary neonatal unit admission study.16 This survival rate was also similar to the 59% found in a population-based regional study of admitted infants born over 2007–2011 in Australia.18 In contrast in 2011, the French EPIPAGE-2 study including all live births showed 31% survival to discharge.19 However it should be noted that inclusion of all live births does not guarantee a consistent population, as shown by the variation across England in whether infants less than 24 weeks who die shortly after birth are in fact registered as live births.20
Our study has several implications for clinicians, policy makers and researchers. First, although not evidenced by published data to date, continued improvement in survival of very preterm infants may lead in future to a growing number of children and adults with long-term health needs. Opportunity for cost-effective long-term ascertainment of outcomes for all infants admitted to neonatal care is offered by linkage of NNRD data with other national records, such as hospital, general practice and educational data sets. Second, the improvement in survival appears to be largely at lower GA and was inconsistent across the regions. Identifying and reducing inequity in health outcomes are a stated intention of the UK Government and NHS England. Third, we show that NNRD data, derived from EPR, enable timely evaluations of outcomes and eliminate the need for separate data capture by busy clinical teams. The small number of very preterm births and the increasing rarity of death in this population mean that large sample sizes enabled by the national coverage of the NNRD are required to detect variation. There is considerable interest in using EPR for research; we hope our study will serve as a template to advance this approach to improve patient care.
Acknowledgments
The authors would like to thank all infants and families whose data contribute to the NNRD. We acknowledge the invaluable assistance of Richard Colquhoun, Buthaina Ibrahim and clinical teams from all contributing neonatal units (listed below with the current lead clinician for each unit).
Airedale General Hospital (Dr Matthew Babirecki), Alexandra Hospital (Dr Liza Harry), Arrowe Park Hospital (Dr Oliver Rackham), Barnet Hospital (Dr Tim Wickham), Barnsley District General Hospital (Dr Sanaa Hamdan), Basildon Hospital (Dr Aashish Gupta), Basingstoke & North Hampshire Hospital (Dr Ruth Wigfield), Bassetlaw District General Hospital (Dr L M Wong), Bedford Hospital (Dr Anita Mittal), Birmingham City Hospital (Dr Julie Nycyk), Birmingham Heartlands Hospital (Dr Phil Simmons), Birmingham Women’s Hospital (Dr Anju Singh), Bradford Royal Infirmary (Dr Sunita Seal), Broomfield Hospital, Chelmsford (Dr Ahmed Hassan), Calderdale Royal Hospital (Dr Karin Schwarz), Chelsea & Westminster Hospital (Dr Mark Thomas), Chesterfield & North Derbyshire Royal Hospital (Dr Aiwyne Foo), Colchester General Hospital (Dr Aravind Shastri), Conquest Hospital (Dr Graham Whincup), Countess of Chester Hospital (Dr Stephen Brearey), Croydon University Hospital (Dr John Chang), Cumberland Infirmary (Dr Khairy Gad), Darent Valley Hospital (Dr Abdul Hasib), Darlington Memorial Hospital (Dr Mehdi Garbash), Derriford Hospital (Dr Alex Allwood), Diana Princess of Wales Hospital (Dr Pauline Adiotomre), Doncaster Royal Infirmary (Dr Jamal S Ahmed), Dorset County Hospital (Dr Abby Deketelaere), East Surrey Hospital (Dr K Abdul Khader), Epsom General Hospital (Dr Ruth Shephard), Frimley Park Hospital (Dr Abdus Mallik), Furness General Hospital (Dr Belal Abuzgia), George Eliot Hospital (Dr Mukta Jain), Gloucester Royal Hospital (Dr Simon Pirie), Good Hope Hospital (Dr Phil Simmons), Great Western Hospital (Dr Stanley Zengeya), Guy’s & St Thomas' Hospital (Dr Timothy Watts), Harrogate District Hospital (Dr C Jampala), Hereford County Hospital (Dr Cath Seagrave), Hillingdon Hospital (Dr Michele Cruwys), Hinchingbrooke Hospital (Dr Hilary Dixon), Homerton Hospital (Dr Narendra Aladangady), Hull Royal Infirmary (Dr Hassan Gaili), Ipswich Hospital (Dr Matthew James), James Cook University Hospital (Dr M Lal), James Paget Hospital (Dr Ambadkar), Kettering General Hospital (Dr Patty Rao), Kings College Hospital (Dr Ann Hickey), King’s Mill Hospital (Dr Dhaval Dave), Kingston Hospital (Dr Vinay Pai), Lancashire Women and Newborn Centre (Dr Meera Lama), Leeds Neonatal Service (Dr Lawrence Miall), Leicester General Hospital (Dr Jonathan Cusack), Leicester Royal Infirmary (Dr Venkatesh Kairamkonda), Leighton Hospital (Dr Jayachandran), Lincoln County Hospital (Dr Kollipara), Lister Hospital (Dr J Kefas), Liverpool Women’s Hospital (Dr Bill Yoxall), Luton & Dunstable Hospital (Dr Jennifer Birch), Macclesfield District General Hospital (Dr Gail Whitehead), Manor Hospital (Dr Krishnamurthy), Medway Maritime Hospital (Dr Aung Soe), Milton Keynes General Hospital (Dr I Misra), New Cross Hospital (Dr Tilly Pillay), Newham General Hospital (Dr Imdad Ali), Norfolk & Norwich University Hospital (Dr Mark Dyke), North Devon District Hospital (Dr Michael Selter), North Manchester General Hospital (Dr Nagesh Panasa), North Middlesex University Hospital (Dr Lesley Alsford), North Tyneside General Hospital (Dr Vivien Spencer), Northampton General Hospital (Dr Subodh Gupta), Northwick Park Hospital (Dr Richard Nicholl), Nottingham City Hospital (Dr Steven Wardle), Nottingham University Hospital (QMC) (Dr Steven Wardle), Ormskirk District General Hospital (Dr Tim McBride), Oxford University Hospitals, Horton Hospital (Dr Naveen Shettihalli), Oxford University Hospitals, John Radcliffe Hospital (Dr Eleri Adams), Peterborough City Hospital (Dr Seif Babiker), Pilgrim Hospital (Dr Margaret Crawford), Pinderfields General Hospital (Pontefract General Infirmary) (Dr David Gibson), Poole General Hospital (Prof Minesh Khashu), Princess Alexandra Hospital (Dr Caitlin Toh), Princess Anne Hospital (Dr Mike Hall), Princess Royal Hospital (Dr P Amess), Princess Royal University Hospital (Dr Elizabeth Sleight), Queen Alexandra Hospital (Dr Charlotte Groves), Queen Charlotte’s Hospital (Dr Sunit Godambe), Queen Elizabeth Hospital, Gateshead (Dr Dennis Bosman), Queen Elizabeth Hospital, King’s Lynn (Dr Glynis Rewitzky), Queen Elizabeth Hospital, Woolwich (Dr Olutoyin Banjoko), Queen Elizabeth the Queen Mother Hospital (Dr N Kumar), Queen’s Hospital, Burton on Trent (Dr Azhar Manzoor), Queen’s Hospital, Romford (Dr Wilson Lopez), Rosie Maternity Hospital, Addenbrookes (Dr Angela D’Amore), Rotherham District General Hospital (Dr Shameel Mattara), Royal Albert Edward Infirmary (Dr Christos Zipitis), Royal Berkshire Hospital (Dr Peter De Halpert), Royal Bolton Hospital (Dr Paul Settle), Royal Cornwall Hospital (Dr Paul Munyard), Royal Derby Hospital (Dr John McIntyre), Royal Devon & Exeter Hospital (Dr David Bartle), Royal Hampshire County Hospital (Dr Katie Yallop), Royal Lancaster Infirmary (Dr Joanne Fedee), Royal Oldham Hospital (Dr Natasha Maddock), Royal Preston Hospital (Dr Richa Gupta), Royal Shrewsbury Hospital (Dr Deshpande), Royal Stoke University Hospital (Dr Alison Moore), Royal Surrey County Hospital (Dr Charles Godden), Royal Sussex County Hospital (Dr P Amess), Royal United Hospital (Dr Stephen Jones), Royal Victoria Infirmary (Dr Alan Fenton), Russells Hall Hospital (Dr Mahadevan), Salisbury District Hospital (Dr Nick Brown), Scarborough General Hospital (Dr Kirsten Mack), Scunthorpe General Hospital (Dr Pauline Adiotomre), South Tyneside District Hospital (Dr Rob Bolton), Southend Hospital (Dr Arfa Khan), Southmead Hospital (Dr Paul Mannix), St George’s Hospital (Dr Charlotte Huddy), St Helier Hospital (Dr Salim Yasin), St Mary’s Hospital, Isle of Wight (Dr Sian Butterworth), St Mary’s Hospital, London (Dr Sunit Godambe), St Mary’s Hospital, Manchester (Dr Ngozi Edi-Osagie), St Michael’s Hospital (Dr Pamela Cairns), St Peter’s Hospital (Dr Peter Reynolds), St Richard’s Hospital (Dr Nick Brennan), Stepping Hill Hospital (Dr Carrie Heal), Stoke Mandeville Hospital (Dr Sanjay Salgia), Sunderland Royal Hospital (Dr Majd Abu-Harb), Tameside General Hospital (Dr Jacqeline Birch), Taunton & Somerset Hospital (Dr Chris Knight), The Jessop Wing, Sheffield (Dr Simon Clark), The Royal Free Hospital (Dr V Van Sommen), The Royal London Hospital - Constance Green (Dr Vadivelam Murthy), Torbay Hospital (Dr Siba Paul), Tunbridge Wells Hospital (Dr Hamudi Kisat), University College Hospital (Dr Giles Kendall), University Hospital Coventry (Dr Kate Blake), University Hospital Lewisham (Dr Jauro Kuna), University Hospital of North Durham (Dr Mehdi Garbash), University Hospital of North Tees (Dr Hari Kumar), University Hospital of South Manchester (Dr Gopi Vemuri), Victoria Hospital, Blackpool (Dr Chris Rawlingson), Warrington Hospital (Dr Delyth Webb), Warwick Hospital (Dr Bird), Watford General Hospital (Dr Sankara Narayanan), West Cumberland Hospital (Dr Jason Gane), West Middlesex University Hospital (Dr Elizabeth Eyre), West Suffolk Hospital (Dr Ian Evans), Wexham Park Hospital (Dr Rekha Sanghavi), Whipps Cross University Hospital (Dr Caroline Sullivan), Whiston Hospital (Dr Laweh Amegavie), Whittington Hospital (Dr Wynne Leith), William Harvey Hospital (Dr Vimal Vasu), Worcestershire Royal Hospital (Dr Andrew Gallagher), Worthing Hospital (Dr Katia Vamvakiti), Yeovil District Hospital (Dr Megan Eaton), York District Hospital (Dr Guy Millman).
References
Footnotes
Contributors All authors contributed to study design and analysis. SS and NM are the guarantors for the study. SS, YS, DG, CB and NM had full access to the NNRD data. All authors had full access to the summary data presented in this paper (including statistical reports and tables) in the study and can take responsibility for the integrity of the data and the accuracy of the data analysis.
Funding SS, YS and CB were funded by the National Institute for Health Research under its Programme Grants for Applied Research Programme (Grant Reference Number RP-PG-0707-10010) held by NM. DG receives salary support through the Royal College of Paediatrics and Child Health National Neonatal Audit Programme that is commissioned by the Healthcare Quality Improvement Partnership and funded by the Department of Health. The views expressed are those of the authors and not necessarily those of the NHS, the NIHR, the RCPCH, or the Department of Health. Neither the study sponsor, Imperial College London, nor the study funder, the National Institute for Health Research, had any role in in the collection, analysis, and interpretation of data; in the writing of the report; and in the decision to submit the article for publication.
Ethics approval National Research Ethics Service (16/LO/1093).
Provenance and peer review Not commissioned; externally peer reviewed.
Data sharing statement Data from this study are available for prespecified purposes subject to approval from the Neonatal Data Analysis Unit Steering Board.
Press Release Please contact the press offices of Imperial College London, Chelsea and Westminster Hospital and Royal College of Paediatrics and Child Health
Collaborators *Members of the Medicines for Neonates Investigator Group: Neena Modi,1 Jane Abbott,2 Deborah Ashby,3 Peter Brocklehurst,4 Kate Costeloe,5 Elizabeth Draper,6 Jacquie Kemp,7 Azeem Majeed,8 Stavros Petrou,9 Alys Young10. 1Neonatal Data Analysis Unit, Section of Neonatal Medicine, Department of Medicine, Imperial College London, Chelsea and Westminster Hospital campus, 369 Fulham Road, London SW10 9NH, UK. 2Bliss, 2nd Floor, Chapter House, 18C20 Crucifix Lane, London SE1 3JW, UK. 3Imperial Clinical Trials Unit, 1st Floor, Stadium House, 68 Wood Lane, London W12 7RH, UK. 4UCL EGA Institute for Women’s Health, Medical School Building, 74 Huntley Street, London WC1E 6AU, UK. 5Blizard Institute, Barts and the London School of Medicine and Dentistry, 4 Newark Street, London E12AT, UK. 6Department of Health Sciences, University of Leicester, Centre for Medicine, University Road, Leicester LE1 7RH, UK. 7London Specialised Commissioning Group, London, UK. 8Department of Primary Care and Public Health, School of Public Health, Faculty of Medicine, Imperial College London, Charing Cross campus, Reynolds Building, St Dunstans Road, London W6 8RP, UK. 9Division of Health Sciences, Warwick Medical School, University of Warwick, Coventry CV4 7AL, UK. 10Manchester Academic Health Sciences Centre, Core Technology Facility, The University of Manchester, 46 Grafton Street, Manchester M13 9NT, UK.