Article Text

Abstract
Objective To assess the association of anthropometric measurements with neonatal complications in macrosomic newborns of non-diabetic mothers.
Design Retrospective cohort study.
Patients All liveborn, singleton, full term newborns with birth weight ≥4000 g born to non-diabetic mothers at a tertiary medical centre in 1995–2005 (n=2766, study group) were matched to the next born, healthy, full term infant with a birth weight of 3000–4000 g (control group). Exclusion criteria were multiple birth, congenital infection, major malformations and pregnancy complications.
Intervention Data collection by file review.
Outcome measures Complication rates were compared between study and control groups and between symmetric and asymmetric macrosomic newborns, defined by weight/length ratio (WLR), Body Mass Index and Ponderal Index.
Results The 2766 non-diabetic macrosomic infants identified were matched to 2766 control infants. The macrosomic group had higher rates of hypoglycaemia (1.2% vs 0.5%, p=0.008), transient tachypnoea of the newborn (1.5% vs 0.5%, p<0.001), hyperthermia (0.6% vs 0.1%, p=0.012), and birth trauma (2% vs 0.7%, p<0.001), with no cases of symptomatic polycythaemia, and only one case of hypoglycaemia. Hypoglycaemia was positively associated with birth weight. It was significantly higher in the asymmetric than the symmetric macrosomic newborns, defined by WLR (1.7% vs 0.3%, p<0.001).
Conclusions Macrosomic infants of non-diabetic mothers are at increased risk of neonatal complications. However, routine measurements of haematocrit and calcium may not be necessary. Symmetric macrosomic infants (by WLR) have a similar rate of hypoglycaemia as normal-weight infants. Thus, repeat glucose measurements in symmetric macrosomic infants are not justified.
- Neonatology
- Macrosomia
- Newborn
- Non-diabetic mothers
- Complications
Statistics from Altmetric.com
What is already known on this topic
-
The prevalence of macrosomia has been rising, with an accompanying increased risk of adverse outcomes.
-
Macrosomic newborns are at an increased risk of hypoglycaemia, which is positively associated with birth weight.
What this study adds
-
Symptomatic hypocalcaemia and polycythaemia are rare in macrosomic infants of non-diabetic mothers; routine measurements of haematocrit and calcium may not be required.
-
Symmetric macrosomic infants (defined by weight/length ratio) have a similar rate of hypoglycaemia as normal weight infants.
-
Repeated glucose measurements in symmetric macrosomic infants are not justified.
Introduction
There is no consensus regarding the definition of macrosomia, and the term may be applied to newborns with a birth weight greater than 4000, 4500, or 5000 g, irrespective of gestational age.1 The American College of Obstetricians and Gynaecologists suggests a threshold of 4500 g, as morbidity increases sharply beyond this birth weight.2
The prevalence of macrosomia has been rising in recent decades, with an accompanying increased risk of adverse outcomes for mother and newborn. Risks to the newborn include shoulder dystocia,3 hypoxia, plexus injuries,4 hypoglycaemia, congenital anomalies, and need for intensive care.5 ,6
The aim of the present study was to quantify the rates of neonatal complications in macrosomic newborns born to non-diabetic mothers; compare these rates between symmetric and asymmetric macrosomic subgroups, defined according to anthropometric indices, and explore possible correlations of neonatal morbidities with anthropometric measurements in macrosomic subgroups.
Materials and methods
Patients and setting
This study was approved by the local institutional research review board. A retrospective cohort study design was used. The computerised discharge records database of Rabin Medical Center, a tertiary university-affiliated hospital, was searched for all liveborn, singleton, full term (37–41 completed gestational weeks) neonates with a birth weight of ≥4000 g who were born between January 1995 and December 2005. Exclusion criteria were pregnancy complicated by multiple births, maternal diabetes (one or more abnormal glucose levels),7 maternal hypertension and/or toxaemia, placental abruption, amnionitis, acute and/or chronic fetal distress, or impaired fetal growth, and presence of neonatal congenital infection, major congenital malformations, chromosomal aberrations, or congenital syndromes. For each infant in the study group, the next born appropriate-for-gestational age (AGA) (±1 week) singleton infant with a birth weight of 3000–4000 g was selected for the control group.
Data collection
Maternal and neonatal data were extracted from the medical records of the High-Risk Pregnancy Unit, Delivery Room, and Neonatal Department, as follows: maternal demographic and obstetrical characteristics: age, parity, mode of delivery, date and hour of birth (with risk hours defined as 1600 to 0800 and weekends); neonatal characteristics: gestational age, birth weight, length, head circumference, sex, perinatal mortality, number of days in the neonatal intensive care unit (NICU), hospital length of stay, 5 min Apgar score, umbilical cord blood pH, blood pressure, neurological disorders (hypoxic ischaemic encephalopathy, convulsions), related birth injuries, hypoglycaemia, hypocalcaemia, unexplained hyperbilirubinemia, metabolic acidosis, polycythaemia, meconium aspiration syndrome, respiratory morbidity (including transient tachypnoea of the newborn, respiratory distress syndrome, and the need for oxygen administration or mechanical ventilation), hyperthermia, cyanotic episodes, culture results, neonatal leukocytosis (white blood cell count ≥30 000/mm3), leukopoenia (white blood cell count ≤5000/mm3) and thrombocytopenia (platelet count ≤150 000/mm3), and loss of >10% of birth weight.
Measurements and definitions
Weight and length were measured by standard paediatric procedures.8 ,9 Birth weight is routinely measured by trained nurses within 1 h of delivery using electronic scales accurate to 5 g and calibrated before each measurement. Crown-heel length is measured at the same time to the nearest millimeter with an infantometer, with the head placed against the head plate and the knees fully extended.
Weight/length ratio (WLR) (weight/length, kg/m), Body Mass Index (BMI) (weight/length/m2) and Ponderal Index (PI) (weight/length3, g/cm3*100) were calculated for all infants. Asymmetry was defined as an index value above the 90th percentile.10–15
Macrosomia was defined as birth weight ≥4000 g irrespective of gestational age.16 AGA was defined as birth weight between the 10th and 90th percentile.17 Hypoglycaemia was defined as blood glucose <40 mg/dL (2.2 mmol/L) at any period during the hospital stay, irrespective of gestational age or hour of life.18 Hyperthermia was defined as temperature >37.6°C, persisting >1 h. Unexplained hyperbilirubinemia was defined as any serum bilirubin value >10 mg/dL (170 mmol/L) before 24 h of age and/or >13 mg/dL after 24 h of age, in the absence of active haemolysis, blood group incompatibility, glucose 6-phosphatase deficiency, or other identifiable cause of hyperbilirubinemia, such as sepsis.19 Polycythaemia was defined as peripheral venous haematocrit >0.65 (65%).20 Hypoxic ischaemic encephalopathy was defined as a capillary or arterial pH <7.00 and/or base deficit <−16 . Hypocalcaemia was defined as calcium <7.5 mg/dL. Prolonged hospitalisation was defined as an admission for more than 5 days for neonates delivered by caesarean section, and 3 days for vaginal delivery. The composite outcome was defined as the presence of one or more of the following morbidities: 5 min Apgar score <7, hypoxic ischaemic encephalopathy, convulsions, birth injury, hypoglycaemia, hypocalcaemia, unexplained hyperbilirubinemia, metabolic acidosis, polycythaemia, meconium aspiration syndrome, transient tachypnoea of the newborn or respiratory distress syndrome, hyperthermia, cyanotic episodes, or loss of >10% of birth weight.
Departmental policy for macrosomic and non-macrosomic infants
During the study period, it was the departmental policy to routinely measure blood glucose in all macrosomic infants (≥4000 g) at 1 h of age, followed by early feeding. Repeated measurements were performed at ages 3, 6, 8 and 24 h. In the control group, glucose was determined in every infant requiring blood test. The majority of these infants were asymptomatic screened for infection due to maternal fever, premature rupture of membranes and so on. However, some of these infants were screened to exclude symptomatic hypoglycaemia.
The department policy is to screen for sepsis at 3–6 h of age, which is similar to the schedule of glucose screening for the macrosomic infants. Newborns found to be hypoglycaemic (glucose <40 mg%) underwent repeated glucose measurement within the hour of the previous measurement. Intravenous glucose was administered to all infants with a glucose level <40 mg% at 1 h after feeding. All infants were followed for a minimum period of 24 h. Infants were screened for polycythaemia at 3 h of age and for hypocalcaemia at 24 h of age.
Glucose screening is performed in non-macrosomic infants only when symptomatic hypoglycaemia is suspected. However, a glucose test is routinely done if blood is drawn for any indication, most commonly to exclude sepsis in infants at risk for sepsis. Repeat blood testing for hypoglycaemic non-macrosomic infants is done similarly to that performed for macrosomic infants.
Statistical analysis
Data were analysed with BMDP Statistical Software.21 Univariate analysis was performed to identify differences between two groups. Student t test, Pearson's χ2 test, and Fisher's exact test were applied as suitable to compare groups. Statistical significance was defined as p<0.05.
Results
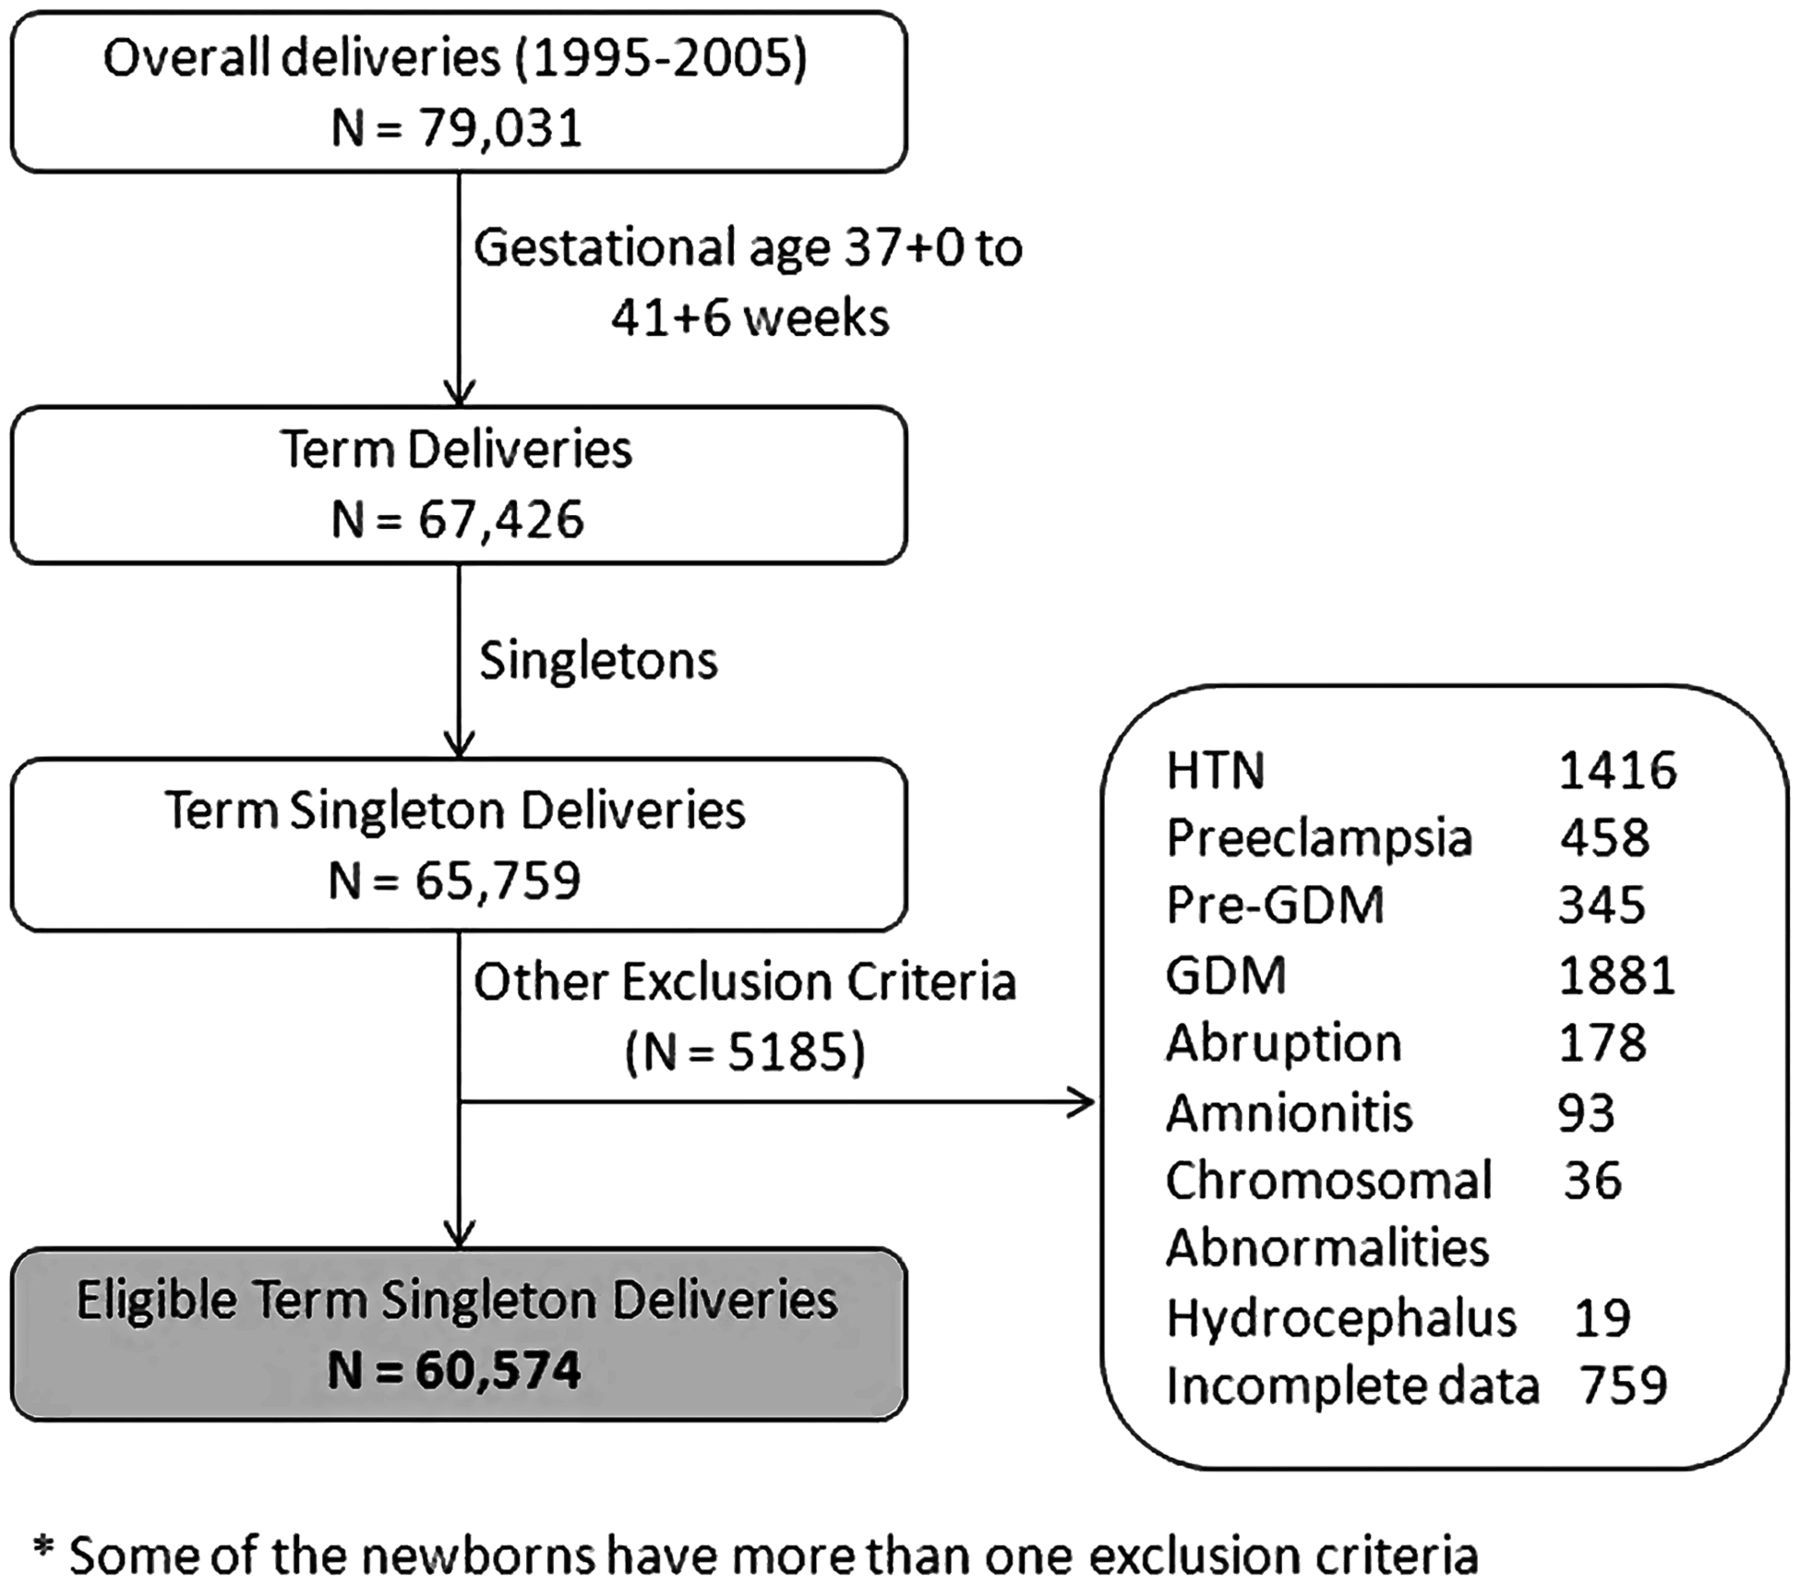
Of the 79 031 neonates born in our medical centre during the study period, 60 574 singleton full-term infants were identified and available for analysis (figure 1). They included 2766 macrosomic newborns of non-diabetic mothers who met the inclusion criteria. This group was matched to 2766 control infants. The clinical characteristics of the study and control groups are described in table 1. Median birth weight was 4150 g (range 4000–5370) in the macrosomic group, and 3400 g (range 3000–3995) in the control group. The macrosomic group had a significantly higher percentage of male infants than the control group (67.9% vs 53.2%, p<0.001) and more caesarean deliveries. However, in the macrosomic LGA group vs the control group, there was no difference in gender. Table 2 describes the outcome of the two groups. The rate of prolonged hospitalisation was significantly higher in the macrosomic vs the control infants (OR 2.22, 95% CI 1.96 to 2.51). No difference in the percent of neonates with prolonged hospitalisation was found comparing neonates born by vaginal delivery without complications to all macrosomic infants (4.5% vs 4.7%, p=0.8). A significantly higher number of macrosomic vs control infants were transferred to the NICU (OR 1.78, 95% CI 1.27 to 2.53). The macrosomic versus control group also had significantly more infants with one or more neonatal complications (composite outcome, 11.7% vs 8.0%, p<0.001) (OR 1.53, 95% CI 1.27 to 1.83). The main complications were hypoglycaemia (OR 2.37, 95% CI 1.23 to 4.81), transient tachypnoea of the newborn (OR 2.83, 95% CI 1.53 to 5.50), hyperthermia, and birth trauma (OR 3.0, 95% CI 1.78 to 5.62) (table 2). There were no between-group differences in rates of low 5 min Apgar score, metabolic acidosis, infection, loss of >10% of body weight, meconium aspiration syndrome, or cyanotic episodes. No infant had symptomatic polycythaemia, and only one had hypocalcaemia.
Clinical characteristics of macrosomic and control groups
Outcome of macrosomic and control groups

Study group selection.
The composite outcome was calculated for the 325 macrosomic infants with neonatal complications. They did not differ in length or head circumference from the remaining 2441 macrosomic infants, but they had significantly higher birth weights (4232 g vs 4194 g, p<0.002), WLRs (8.07 vs 7.99, p<0.001), BMIs (15.39 vs 15.24, p=0.004), and PI’s (2.94 vs 2.91, p<0.03). Among the macrosomic infants with complications, there was no statistically significant difference in composite score between those who were transferred to the NICU (n=100) and those who were not.
The rate of asymmetry within the macrosomic group (defined as an anthropometric index value above the 90th percentile 22) was 63.2% by WLR, 42.4% by BMI and 22.6% by PI. Regardless of the measure used, infants defined as asymmetric were more likely to be born by caesarean delivery and less likely to be born during high-risk hours. The characteristics and outcomes of symmetric and asymmetric macrosomic infants by WLR are presented in tables 3 and 4.
Comparison of clinical characteristics of symmetric and asymmetric macrosomic infants by WLR
Comparison of outcomes of symmetric and asymmetric macrosomic infants by WLR
The incidence of hypoglycaemia in the macrosomic infants was 1.2%, and was positively associated with birth weight (table 5); 42% of the control infants were screened at least once for hypoglycaemia. Of these, only 2.2% were screened to exclude symptomatic hypoglycaemia. The prevalence of hypoglycaemia using as the denominator only neonates who underwent glucose testing showed that 14 infants (1.2%) of the control group had hypoglycaemia compared to 33 infant (1.2%) of the macrocosmic infants (p>0.9). Similarly compared, more macrosomic LGA infants had hypoglycaemia (29 infants, 2.15%) vs tested control group infants (14 infants, 1.2%) (p=0.07). Further analysis showed that it was the asymmetric infants within the macrosomic group that accounted for most of the increased rate of hypoglycaemia (table 4). The rate of hypoglycaemia in infants with symmetric macrosomia by WLR was similar to that of the control infants (table 5).
Incidence of hypoglycaemia in macrosomic and control infants
Discussion
This study evaluated the rate of neonatal complications in macrosomic newborns of non-diabetic mothers and the association of symmetry/asymmetry with the risk of neonatal complications. Macrosomic newborns are considered to be at an increased risk of hypoglycaemia, however, maternal diabetes is the underlying cause in most cases. Therefore, we limited the study group to infants of non-diabetic mothers to isolate the possible effect of birth weight. The results showed that macrosomic infants, compared to control infants, have higher rates of hypoglycaemia, transient tachypnoea of the newborn, hyperthermia, and birth trauma.
The few studies that have assessed the rate of hypoglycaemia in macrosomic newborns of non-diabetic mothers reported rates of 3.8–16%.23–26 The wide range was mainly due to differences in the definition of hypoglycaemia, which is still controversial. We selected a definition that provided us a safety margin for prevention and treatment. We sought to maintain plasma glucose concentrations in asymptomatic infants at >40 mg/dL.27 Accordingly, the rate of hypoglycaemia in our study group was 1.2%, which is far lower than previously reported in macrosomic infants.23–26 The rate of hypoglycaemia was positively associated with birth weight, ranging from 0.8% in infants with a birth weight of 4000–4499 g to 25% in infants with a birth weight of ≥5000 g.
The macrosomic group was defined by three anthropometric measures. The type of measure used influenced the results, with rates of asymmetry varying from 63.2% when macrosomia was defined by WLR, to 42.4% when BMI was used, to 22.6% when PI was used. Several similar studies to ours have been conducted, but the different anthropometric parameters applied led to inconsistent results.25 ,28–33 For example, using PI, Ballard et al28 reported an asymmetry rate of 12.5%, which is considerably lower than our 22.6%. Persson et al29 ,30 reported a rate of 35%, however, infants of diabetic mothers were included in this study.
We found that the tool with the most highly significant results for identifying macrosomic infants at risk for hypoglycaemia was WLR,24 however, BMI was also significant, but less so, while PI was not found to be significant, by contrast with others.31–33 The use of WLR, is a simpler concept than BMI or PI, and it is less prone to error because the length measurement is not squared or cubed. Characterisation of the macrosomic infants by low risk (symmetric macrosomia) or high risk (asymmetric macrosomia) revealed a significantly higher rate of hypoglycaemia in the asymmetric macrosomic subgroup. Indeed, symmetric macrosomic newborns of non-diabetic mothers, as defined by WLR, had a similar hypoglycaemic rate compared to control infants (table 5). These findings suggest that repeated glucose testing of symmetric macrosomic newborns (defined by WLR) of non-diabetic mothers is not justified. Our results differ from those of Schaefer-Graf et al34 who failed to find a correlation between anthropometric parameters and hypoglycaemia, possibly due to an inaccuracy in neonatal length measurement. Previous studies advocated the use of symmetric versus asymmetric growth to assess the risk of hypoglycaemia or other neonatal complications. Ballard et al28 and Djelmis et al35 studied newborns of diabetic mothers and suggested that hyperglycaemia in utero causes a disproportion in growth, and when this occurs, more neonatal complications are observed, such as hypoglycaemia, hyperbilirubinemia, polycythaemia and metabolic acidosis.28 ,35 This hypothesis was supported by Van Assche et al36 who claimed that symmetric growth is explained by genetic constitutional factors, whereas, asymmetric growth is explained by an abnormal metabolic environment.
A significantly higher percent of the macrosomic group had prolonged hospital stay. This may be partially attributable to the high rate of caesarean deliveries in the macrosomic group, leading to longer maternal hospital stay.37 Furthermore, caesarean delivery is known to be associated with an increased incidence of transient tachypnoea of the newborn,38 which was also true for our macrosomic group. The reason for the slightly increased rate of hyperthermia in the macrosomic group is unclear, as no cases of infection were identified. It is possible that macrosomic infants require less heating, so that the standard placement of infants under a radiant warmer after delivery may be excessive in these cases. Hyperthermia in these neonates could also result from dehydration.
The higher incidence of birth trauma (mainly fracture of the clavicle) was not correlated to any of the anthropometric parameters except head circumference. It is likely that the low incidence of brachial plexus injury relative to reports in the medical literature was also related to the high rate of caesarean deliveries.4 ,25
In conclusion, macrosomic infants of non-diabetic mothers are at an increased risk of neonatal complications. As symptomatic hypocalcaemia and polycythaemia were not identified in this population, we believe routine measurements of haematocrit and calcium may not be required. Symmetric macrosomic infants (defined by WLR) have a similar rate of hypoglycaemia as normal weight infants. Thus, these infants do not seem to require repeat glucose testing.
Acknowledgments
The authors wish to thank Mrs Pearl Lilos for excellent statistical analysis.
References
Footnotes
-
Contributors Details of the contribution of individual authors: NL: guarantor, conception and design of study, data interpretation, revision of the article. YL: data analysis, article drafting. AK, NM and YY: intellectual input and design of the study, revision of the article. EF: data analysis and interpretation, intellectual input, revision of the article. FK: data analysis and interpretation, revision of the article. GK: design, analysis, revision of article. All co-authors have approved the final version of the article, confirm that the work has not been published/submitted elsewhere and agree with submission. All co-authors agree to be accountable for all aspects of the work in ensuring that questions related to the accuracy or integrity of any part of the work are appropriately investigated and resolved.
-
Competing interests None.
-
Ethics approval Rabin Medical Center research review board.
-
Provenance and peer review Not commissioned; externally peer reviewed.
Linked Articles
- Editorial