Article Text

Abstract
Objective Intraventricular haemorrhage is still the most common cause of brain lesion in preterm infants and development of a posthaemorrhagic ventricular dilatation (PHVD) can lead to additional neurological sequelae. Flash visual evoked potentials (fVEP) and amplitude-integrated electroencephalography (aEEG) are non-invasive neurophysiological monitoring tools. The aim of the study was to evaluate fVEPs and aEEGs in preterm infants with progressive PHVD prior to and after neurosurgical intervention for cerebrospinal fluid removal and to correlate the findings with severity of ventricular dilatation.
Design fVEPs and aEEGs were performed weekly in infants with developing PHVD. As soon as the ventricular index reached the 97th percentile recordings were performed twice a week.
Methods 17 patients admitted to the neonatal intensive care unit of the Medical University of Vienna who developed progressive PHVD were evaluated using fVEP and aEEG until and after reduction of intracranial pressure by placement of an external ventricular drainage.
Results In all 17 cases (100%) wave latencies of fVEP increased above normal range and aEEG showed increased suppression in 13 patients (76%) with increasing ventricular dilatation. Both methods showed normalisation of patterns mostly within a week of successful therapeutic intervention (mean 8.5 days). Both changes in fVEP latencies and aEEG background patterns were detected before clinical signs of elevated intracranial pressure occurred. In only 10 patients (58.8%) ventricular width exceeded the 97th percentile+4 mm.
Conclusions fVEP and aEEG are useful additional tools for the evaluation of preterm infants with progressive PHVD.
- Clin Neurophysiology
- Monitoring
- Neonatology
- Neurodevelopment
- Neurodisability
Statistics from Altmetric.com
What is already known on this topic?
-
Posthaemorrhagic ventricular dilatation (PHVD) can worsen neurological impairment.
-
The optimal time to intervene in PHVD is uncertain.
-
Early intervention and avoiding shunt insertion may improve outcome.
What this study adds
-
Visual evoked potential (VEP) latencies and amplitude-integrated EEG (aEEG) worsen with increasing ventricular dilatation in PHVD and cerebrospinal fluid drainage reverses these findings.
-
VEPs and aEEG may help optimise the time to intervene.
Introduction
Intraventricular haemorrhage (IVH) is still the most common reason for brain injury in preterm infants.1 Additional progressive posthaemorrhagic ventricular dilatation (PHVD) is known to be associated with subsequent white matter damage and therefore increases the risk for neurodevelopmental disability furthermore.2–5
The optimal management of infants with PHVD is still subject of ongoing discussions. Several treatment modalities to reduce intracranial pressure such as repeated lumbar punctures or ventricular taps,6 the insertion of an external ventricular drainage (EVD) or the placement of a subcutaneous reservoir7 are used or still experimental methods such as the administration of fibrinolytic agents combined with irrigation.8 Further, the optimal time-point for neurosurgical intervention is not yet known. A recently published retrospective study has shown that receiving early intervention for PHVD significantly decreased the number of permanent shunt insertions.9 In addition, there are increasing data suggesting that neurodevelopmental outcome might be improved with early intervention especially when shunt insertion can be avoided.5 ,8 Currently, the timing of intervention is still based on either clinical signs such as increasing apnoeas, bradycardia and increasing head circumference or on cranial ultrasound (CUS) findings.
Additional cerebral function monitoring using different electrophysiological methods has proven to be useful in patients with PHVD. Pathological patterns such as seizures can be detected using conventional EEG in children presenting with hydrocephalus.10 Also, amplitude-integrated EEG (aEEG) background patterns change in premature infants with increasing PHVD, as we have shown previously,4 ,11 and these changes improve with cerebrospinal fluid (CSF) drainage and subsequent intracranial decompression. Visual evoked potentials (VEPs) were found to be useful in the neonatal population with regard to prediction of neurodevelopmental outcome.12–14 They seem particularly helpful in patients with PHVD as the visual pathway is adjacent to the lateral ventricles. Therefore, an increase in ventricular width seems to lead to an early compromise of VEPs.15 VEPs have shown to be of predictive value in detecting increasing intracranial pressure in children as VEP latencies increased with the increase of intracranial pressure and normalised after neurosurgical intervention.15 ,16
The aims of the present prospective study were to evaluate the role of VEPs and aEEG in the monitoring of the development of PHVD in preterm infants and to define pattern changes with decompressing neurosurgical interventions. Second, we wanted to correlate our findings with the degree of ventricular dilatation and Doppler sonography.
Patients and methods
All infants admitted to the neonatal intensive care unit of the Medical University Vienna (01/07–12/09) who developed PHVD were screened prospectively for the purpose of the present study. Only those patients who also required neurosurgical intervention were eligible for inclusion.
Subjects with IVH received serial CUS scans every second day. PHVD was defined as the progressive increase of ventricular width following IVH as seen on CUS. In the case of PHVD, VEPs and aEEG examinations were performed at least once weekly before and after neurosurgical intervention in order to follow both the development of ventricular dilatation and the reduction of ventricular width after insertion of an EVD or implantation of a ventriculo-peritoneal shunt (VP-shunt).
Gestational age was determined from the date of the mother's last menstrual period and from antenatal ultrasound scans. Parental consent was obtained in all cases. The study was approved by the local ethics committee.
Cranial ultrasound
CUS scans were performed on days 1, 3, 5, 7 and 10 of life or every second day as soon as IVH occurred using an Acuson (Mountainview, California, USA) 128XP with a 7.5-MHz transducer. IVH was classified according to Papile et al.17 PHVD was classified according to the ventricular index of Levene, and a neurosurgical intervention was latest performed if the ventricular system was exceeding a width above the 97th percentile+4 mm.18 Ventricular width was measured in the coronal plane from the lateral wall of the body of the lateral ventricle to the falx (defining the ventricular index as described by Levene 198118) for both sides separately. Additionally, anterior horn width (AHW) and thalamo-occipital distance (TOD) (according to reference values by Brouwer et al19) were evaluated. Using Doppler sonography, blood flow velocities and the resistance index were measured in the anterior cerebral artery.20
Neurosurgical intervention
An EVD was placed when either clinical signs of raised intracranial pressure became evident (defined as a bulging fontanelle, drowsiness, vomiting, increasing frequency of apnoeas and/or bradycardia) or when the ventricular index crossed the 97th percentile+4 mm. The daily amount of drained CSF was aimed to be 0.5–1 ml/kg/h and was adjusted to the individual needs of the patient. A permanent VP-shunt implantation was performed as soon as the protein level in the CSF was less than 200 mg/dl and the infant's weight exceeded 1500 g.
Flash visual evoked potentials
fVEP measurements were performed weekly in infants with developing PHVD. As soon as the ventricular index reached the 97th percentile recordings were performed twice weekly until neurosurgical intervention was performed. fVEPs were recorded using the Neuropack 8 (Nihon Kohden). The fVEP measurements were done in closed cots or open-air units, both covered with a blanket in order to create a semidark environment. The stimulating source was a red light emitting diode goggle held at a distance of 5 cm in front of the infant's eyes. The evoked potentials were recorded using three cortical electrodes placed on the infants scalp (active electrodes at Oz and Fz, ground electrode at Cz according to the international 10/20-system). The stimulation frequency was 0.5 Hz, the electrical impedance below 5 kOhm and the emitted light energy was 0.4 Lux. Two courses aiming for 30 and 50 responses were averaged using a band pass filter of 1–100 Hz and a sweep time of 1 s. Responses including excessive artefacts were automatically rejected and trials were performed together on both eyes (binocular). fVEP measurements were recorded during active sleep, determined using the simultaneously recorded aEEG background pattern and the assessment of the behavioural state of the infant.21
Waveforms and latencies were then analysed off line for every measurement.
Reproducible positive and negative waves were named according to the order of their appearance N0, N1, P1, N2, P2 and N3 and compared with the reference values published by Pike et al.22
Amplitude-integrated aEEG
At the same time as fVEP measurements were performed, aEEG was recorded as a single-channel EEG from biparietal surface disk electrodes using a cerebral function monitor (Olympic Cerebral Function Monitor 6000). In brief, the obtained signal is filtered, rectified, smoothed and amplitude-integrated before it is written out at slow speed (6 cm/h) at the bedside.23
Tracings were evaluated visually and classified according to the method previously described by Hellström-Westas et al.24 Descriptive analysis of the background activity of the aEEG tracings was done by dividing each trace in 10 min epochs and by calculating percentages of occurrence of the different patterns. Appearance of sleep-wake cycling (SWC) and seizure activity was noted within the entire recording. aEEG pattern was then scored according to the following:
-
Background activity (age-adequate distribution of pattern according to reference values previously published;25 ,26 a value within 25th and 75th percentiles for every pattern was classified as ‘age-adequate’).27
-
Appearance of SWC.24
-
Presence or absence of seizure activity.24
‘Normal aEEG-pattern’ (=score 0) was defined when all three categories were classified as normal, ‘moderately abnormal aEEG-pattern’ (=score 1) was defined when 1/3 categories were classified as abnormal and ‘severely abnormal aEEG-pattern’ (=score 2) was defined when 2 to 3/3 categories were classified as abnormal.
Statistical analysis
A descriptive analysis of the patients’ clinical characteristics, the VEP component's latency measurements, data of CUS measurements and aEEG scores were carried out before and after the neurosurgical intervention. For analysis, the last measurement before neurosurgical intervention of all three methods (VEP, aEEG and CUS) and the first measurement after the intervention were taken into account. Statistical significance was calculated using Wilcoxon signed rank test and Pearson's correlation coefficient. For statistical analysis the SPSS 17 software was used and a p value <0.05 was considered as being statistically significant.
Results
Patients
During the study period 17 patients met the inclusion criteria. In all cases we were able to perform fVEPs and aEEGs prior to and after placement of CSF drainage systems. Mean day of performance of both measurements before intervention was 2.5 (±4.3) days and 8.5 (±5.7) days after the intervention. Ventricular index width exceeded the 97th percentile+4 mm in 10/17 patients (58.8%). For the remaining patients in 2/17 (11.7%) ‘clinical deterioration’ (increased rate of apnoeas/bradycardias, vomiting or reduction of vigilance) and in 5/17 (29.4%) rapid growth on CUS measurements and availability of neurosurgeon (eg, over the weekend) was indication for intervention although VI>97p +4 mm was not reached yet.
The clinical characteristics of the study cohort are summarised in table 1.
Clinical characteristics of study cohort
Results of fVEPs, aEEGs and CUS prior to and after neurosurgical intervention
Table 2 shows the results of the last fVEPs, aEEG and CUS findings prior to and the first findings thereof after neurosurgical intervention. Only N2 latencies could be defined in all patients, P1 was visible in 8/17 patients and P2 was visible in 16/17 patients. P1 and P2 are known to appear only later during maturation; for example, median gestational age of infants with visible P1 in our cohort was 34 weeks of gestation whereas it was 30 weeks in infants with no visible P1 wave curve.
Results of fVEPs, aEEG and CUS prior to and after neurosurgical intervention
Statistically significant differences prior to and after neurosurgical intervention were found for N2 latencies (p=<0.001), P2 latencies (p=<0.001), P1 latencies (p=0.02), ventricular width in mm (p=>0.001), AHW (p=0.005), TOD (p=0.009), aEEG score (p=0.01) and occurrence of SWC (p=0.02).
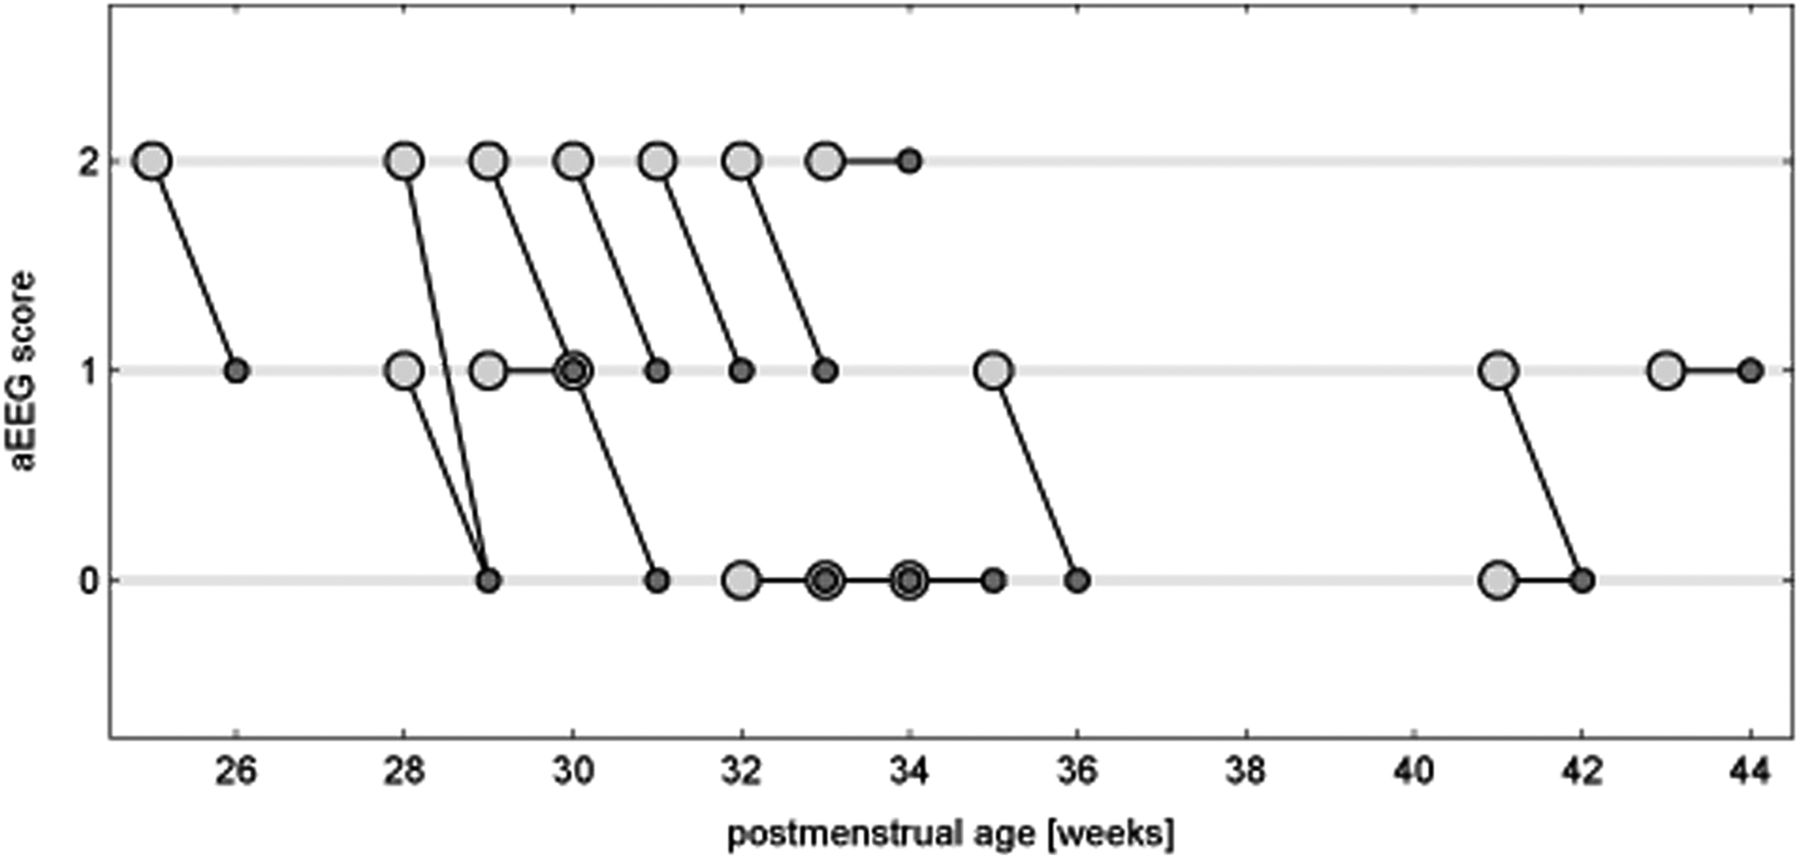
Figures 1⇓–3 show values of ventricular width, N2 latencies and aEEG score prior to and after intervention for all patients.

Ventricular width (mm) before and after intervention.  before external ventricular drainage (EVD),
  after EVD,
  median,
  97th percentile and
  97th percentile+4 mm. Data for every patient are presented for the last measurement before (big, light circle) and the first measurement after intervention (small, dark dot). Reference values for ventricular index according to Brouwer et al19 and Levene.18

N2 latency (ms) before and after intervention.  before external ventricular drainage (EVD),
  after EVD and
  norm values (±2SD). Reference values for N2 latency according to Pike et al.22 Data for every patient are presented for the last measurement before (big, light dot) and the first measurement after intervention (small, dark dot).

Amplitude-integrated electroencephalography (aEEG) score before and after intervention.  before external ventricular drainage (EVD) and
  after EVD. Data for every patient are presented for the last measurement before (big, light dot) and the first measurement after intervention (small, dark dot). The scoring system uses the following three categories: background pattern, sleep-wake cycling and seizure activity. ‘Normal aEEG-pattern’ (=score 0) is defined when all three categories are classified as normal, ‘moderately abnormal aEEG-pattern’ (=score 1) is defined when 1/3 categories are classified as abnormal and ‘severely abnormal aEEGpattern’ (=score 2) is defined when 2 to 3/3 categories are classified as abnormal.
Correlations of fVEPs with CUS and aEEG measurements prior to and after neurosurgical intervention
A statistically significant correlation was found for N2 latency prior to intervention with ventricular width prior to intervention (p=0.01, r=−0.57), resistance index prior to intervention (p=0.03, r=−0.51) and aEEG prior to intervention (p=0.02, r=0.54). P2 latency before intervention only showed a correlation with aEEG before intervention (p=0.02, r=0.56) and with AHW before intervention (p=0.04, r=−0.63).
N2 latency after intervention showed statistically significant correlations with aEEG after intervention (p=0.04, r=0.49), but not with ventricular width or resistance index after intervention.
Figure 4 shows aEEG and fVEP data prior to and after neurosurgical intervention.

Example of amplitude-integrated electroencephalography (aEEG) and flash visual evoked potentials of a preterm infant born at 24+5 weeks’ of gestation. (A) Day 3 of life: no intraventricular haemorrhage (IVH), no posthaemorrhagic ventricular dilatation (PHVD), aEEG score 0=normal for gestational age; background pattern fluctuating between burst-suppression and discontinuous pattern; sleep-wake cycling (SWC) present. N2 latency 320 ms (=normal range for gestational age). Ventricular width: right side 9 mm, left side 9.5 mm (both below 97th percentile). (B) Day 14 of life: IVH III (both sides), PHVD, 2 days before external ventricular drainage (EVD) placement, aEEG score 2=severely abnormal; background pattern fluctuating between burst-suppression pattern and flat trace; no SWC. N2 latency 410 ms (=3SD above normal range). Ventricular width: right side 14 mm, left side 16 mm (both above 97th percentile+4 mm). (C) Day 27 of life: 12 days after EVD placement. aEEG score 1=mildly abnormal for gestational age; background pattern fluctuating between discontinuous pattern and continuous pattern; SWC present. N2 latency 310 ms (=normal range for gestational age). Ventricular width: right side 10.5 mm, left side 9 mm (right side above, left side below 97th percentile). (D) Ventricular index of the same patient, X=right side, О=left side.
Discussion
This study demonstrates the impact of ventricular dilatation and subsequent CSF drainage on fVEPs, aEEG and CUS measurements. Whereas ventricle width exceeded 97th percentile+4 mm in 58.8% of patients only, all patients (100%) showed a delay of their P2 latency and almost all patients (94.2%) a delay of their N2 latency at fVEPs at the time of CSF drainage. After drainage, P2 latency was within normal range in 68.7% of patients and N2 latency in 58.8% of patients within 1 week (mean 8.5 days). N2 latencies prior to intervention correlated significantly with ventricular width prior to intervention (p=0.01), resistance index prior to intervention (p=0.03) and aEEG scores prior to intervention (p=0.02). N2 latencies after intervention showed statistically significant correlations with aEEG scores after intervention (p=0.04), but not with ventricular width or resistance index after intervention. P2 latencies before intervention only showed a correlation with changes in aEEG before intervention (p=0.02) and with AHW (p=0.04) before intervention.
In a previous study we could already demonstrate that aEEG indicates impaired cerebral function with progressive PHVD before clinical deterioration occurs and before CUS measurements indicate the need for neurosurgical intervention.4 We could reproduce our findings in the present study showing that only 23.5% of all infants showed a normal aEEG trace prior to intervention, but 58.8% after intervention. This time we added fVEP findings and showed that fVEP is an additional functional method available and feasible in these patients, which allows us to optimise timing of the CSF drainage procedure even further. Similar to our aEEG and fVEP results, Soul and coworkers used near-infrared spectroscopy to show that CSF removal in infants with PHVD leads to significant increases in cerebral perfusion, cerebral blood volume and oxidative metabolism.28
Ventriculomegaly in PHVD is thought to compress the adjacent white matter first and later on also the cortical grey matter. As previously postulated4 suppressed aEEG activity might be a sign of reduced blood flow and/or compression of intracranial structures. Since the same aEEG changes were present in this study this strengthens our hypothesis. With regard to our fVEP findings we hypothesise that periventricular white matter structures (such as the visual pathway) show signs of impairment even earlier when compared with measurements of cortical activity using aEEG. Similar findings have been published in a previous study by de Vries and coworkers29 using somatosensory and VEPs showing a delay in latency during progressive PHVD and normalisation after shunt insertion.
This observation is supported by our findings as fVEP latencies were the most sensitive marker for impairment of cerebral function. All of our study patients (100%) showed abnormal fVEP latencies prior to CSF drainage procedures, whereas aEEG activity was abnormal in only 76.5%.
Further potential causes explaining fVEP and aEEG changes need to be discussed. As PHVD is mainly found in severe IVH, it is difficult to delineate the influence of this underlying pathology on cerebral activity assessed using aEEG and fVEPs. Our data show full recovery (within 1 week) after CSF drainage in 58.8% of the patients with regard to N2 latencies and aEEG activity, which demonstrates that impairment of cerebral function was reversible as measured with aEEG and fVEP. This observation can most likely be explained by ventricular enlargement and increased intracranial pressure rather than with the underlying irreversible pathology.
The deterioration of both methods prior to CSF drainage could also be due to an increased administration of sedative, analgetic and/or anticonvulsive medication with progressive PHVD. In our study cohort there was no difference in the use of the amount of potentially depressing medication prior to and after neurosurgical intervention.
Furthermore, aEEG and fVEPs change significantly during maturation. Therefore, it can also be postulated that the improvement/change of fVEP latencies and aEEG scores is due to maturational changes. Since major normalisation of fVEP latencies and aEEG scores occurred within a mean of 8.5 days after intervention, these changes are much better explained by the consecutive pressure relief than by maturation alone. Also, with regard to VEPs maturational change is defined by latency changes of about 5 ms/week,22 while our measurements show a decrease of 34 ms within 1 week of intervention.
The optimal timing of intervention in PHVD remains a matter of discussion. Multiple parameters (mostly used: bulging fontanelle, increasing suture width, increasing head circumference, increasing ventricular width and ventricular index) are used to define the necessity of a CSF removing intervention. All these parameters appear late in the clinical course of such patients whereas it would be most desirable to detect an impairment of cerebral function while it is still reversible.
Del Bigio and Bruni30 used a rat model to show a reversible collapse of capillaries in the periventricular neuropil, when shunting was performed 1 week after induced hydrocephalus compared with 8 weeks after ventricular dilatation. The same group31 later showed that compensatory myelination was possible in young rats with induced hydrocephalus, if treatment was instituted prior to axonal injury.
Also, in humans, a retrospective Dutch study9 demonstrated that early intervention (defined as time of onset of treatment when ventricular width was less than 97th percentile+4 mm) was associated with a reduced risk of VP shunting. Furthermore, infants receiving late treatment (once ventricular width had exceeded 97th percentile+4 mm) were more likely to develop moderate to severe handicap, although recent data could not support these findings.27
We propose that functional methods such as aEEG and fVEPs should be used in the assessment and management of PHVD since morphological (=imaging) methods are not providing enough information. These methods offer valuable additional information about cerebral impairment and might help optimising the timing of decompressing interventions.
Acknowledgments
We would like to thank Dr Tobias Werther for his contribution to the design of our figures, helping us to improve the readability of our results.
References
Footnotes
-
Contributors KK-S contributed to the article in conception and design of the study, analysis and interpretation of the data and in writing the manuscript. ZR contributed to the article in data acquisition, analysis and interpretation of the data and writing the manuscript. TW contributed to the article in conception and design of the study and interpretation of the data (especially statistics). CC contributed to the article in data acquisition and analysis and interpretation of the data (especially aEEG data). AB contributed to the article in conception and design of the study and in analysis and interpretation of the data (especially fVEP data). MW contributed to the article in conception and design of the study and in analysis and interpretation of the data. MO contributed to the article in conception and design of the study, analysis and interpretation of the data and in writing and revising the manuscript. All coauthors contributed to the manuscript and revised it critically for important intellectual content and finally approved the version to be published.
-
Funding None.
-
Competing interests None.
-
Ethics approval Austrian (Viennes) ethics committee.
-
Provenance and peer review Not commissioned; externally peer reviewed.