Article Text

Abstract
Objective Maternal glycaemia and anthropometry-derived newborn adiposity are strongly correlated. The children of mothers with diabetes are at greater risk of adverse metabolic health, and increased adiposity is a plausible mediator. We undertook a systematic review and meta-analysis to compare adiposity in infants of diabetic mothers (IDM) and infants of mothers without diabetes (NIDM).
Design We identified observational studies reporting adiposity in IDM and NIDM. We searched references, traced forward citations and contacted authors for additional data. We considered all body composition techniques and compared fat mass, fat-free mass, body fat % and skinfold thickness. We used random effects meta-analyses and performed subgroup analyses by maternal diabetes type (type 1, type 2 and gestational) and infant sex. We examined the influence of pre-pregnancy body mass index (BMI) and conducted sensitivity analyses.
Results We included data from 35 papers and over 24 000 infants. IDM have greater fat mass than NIDM (mean difference (95% CI)): 83 g (49 to 117). Fat mass is greater in infants of mothers with gestational diabetes: 62 g (29 to 94) and type 1 diabetes: 268 g (139 to 397). Insufficient studies reported data for type 2 diabetes separately. Compared with NIDM, fat mass was greater in IDM boys: 87 g (30 to 145), but not significantly different in IDM girls: 42 g (−33 to 116). There was no attenuation after adjustment for maternal BMI.
Conclusions IDM have significantly greater adiposity in comparison with NIDM. These findings are justification for studies to determine whether measures to reduce infant adiposity will improve later health.
- Neonatology
- Obesity
- Endocrinology
- Outcomes research
This is an Open Access article distributed in accordance with the terms of the Creative Commons Attribution (CC BY 4.0) license, which permits others to distribute, remix, adapt and build upon this work, for commercial use, provided the original work is properly cited. See: http://creativecommons.org/licenses/by/4.0/
Statistics from Altmetric.com
What is already known on this topic?
Offspring of mothers with diabetes have greater risks of adverse metabolic sequelae in later life.
The underlying mechanisms are unclear but increased infant adiposity is a plausible mediator.
A strong association has been demonstrated between maternal glycaemia and infant adiposity using indirect (anthropometry-derived) techniques.
What this study adds?
This study quantifies the overall difference in adiposity between infants of mothers with and without diabetes derived from all body composition techniques.
Maternal diabetes is associated with higher fat mass, body fat % and skinfold thickness in infancy.
In subgroup analyses of studies providing sex-specific data, adiposity was higher in infants of diabetic mothers compared with NIDM boys but not girls.
Introduction
Diabetes in pregnancy is increasing1 ,2 and currently affects up to 5% of women in the UK. Approximately 87.5% of cases are gestational diabetes mellitus (GDM), 7.5% type 1 diabetes (T1D) and 5% type 2 diabetes (T2D).3 The offspring of mothers with diabetes have greater risks of adverse metabolic sequelae in childhood and later life4–8 and risks appear to be additional to genetic predisposition.8–11
The underlying mechanisms are unclear but increased infant adiposity is a plausible mediator. Adiposity in childhood and adult life is associated with T2D and cardiovascular disease12 ,13 and we have previously shown that maternal diabetes in pregnancy is associated with an increased offspring body mass index (BMI) z-score in childhood.4 BMI is limited as an index of adiposity as it reflects both fat and lean mass and infants have large variations of body fat for a given BMI.14 The Hyperglycaemia and Adverse Pregnancy Outcome (HAPO) study identified a strong association between maternal glycaemia and infant anthropometry-derived adiposity.15 However, using more direct techniques to measure body composition in infants of diabetic mothers (IDM), the findings are inconsistent16–21 and many studies have been small with limited power. The magnitude of the difference in adiposity between IDM and NIDM derived from all body composition techniques has not been quantified.
We conducted a systematic review and meta-analysis to summarise available evidence of the impact of maternal diabetes on infant adiposity. Secondary objectives were to distinguish the effect of type of maternal diabetes and infant sex, which were not reported by the HAPO group.15 Sex-specific differences have previously been described in relation to maternal glycaemia.17 It has been suggested that associations between maternal hyperglycaemia and offspring outcome may be explained by confounding from maternal overweight.22 Therefore to establish whether maternal diabetes had independent effects on infant adiposity, we also performed analysis following adjustment for maternal pre-pregnancy BMI.
Methods
Literature search
We undertook a systematic review of published observational studies reporting adiposity in IDM and NIDM following MOOSE (meta-analyses and systematic reviews of observational studies) guidelines. We registered the protocol (see online supplementary file 1) on PROSPERO.23 We considered T1D, T2D and GDM as exposures. We planned to evaluate data from infants (ie, <1 year) and children (ie, 1–18 years). As a large quantity of data was obtained, we chose to summarise all infant data in one review and to perform a separate analysis for children. We searched in PubMed for studies published before 1 February 2014, without language restrictions, using the search strategy detailed (see online supplementary figure S1).
Supplemental material
Supplemental material
We excluded review articles after searching reference lists. Relevant studies were identified from either abstract or full paper. We searched reference lists of retrieved papers and attempted to trace forward citations. Where measures of adiposity were mentioned but not published, maternal diabetes status was unclear or mean and SD values were not provided, we contacted authors for additional data. If no response was received to two requests, or the author was unable to provide data, we excluded the study.
Data extraction and analysis
Information on study populations, exposure, outcome, results and covariates was extracted and checked by a second author. Study quality was examined independently by three authors using a modified Newcastle–Ottawa Quality Assessment Scale (see online supplementary file 2).
We examined the association between maternal diabetes and each of the following variables independently in infants: fat mass, fat-free mass, body fat %, triceps and subscapular skinfold thickness. We used RevMan 5 (5.2), inverse variance and random effects methods as all studies were observational. We presented differences between groups as pooled mean difference (95% CI).
Supplemental material
We presented body composition results derived from skinfold thickness or other techniques as separate subgroups and as a pooled result. Raw skinfold thickness data were presented separately. Where studies only reported different types of diabetes separately, we calculated pooled means and SD for all types combined. Where studies provided adjusted results, we performed separate meta-analyses of adjusted and unadjusted data.
We used forest plots to illustrate results and funnel plots to investigate publication/small study bias.24 If funnel plots showed asymmetry, we performed Egger's test.
Between-study heterogeneity
We assessed heterogeneity using the χ2 test for the Q statistic and calculated I2, an estimate of the proportion of variance due to between-study heterogeneity.
We investigated potential sources of heterogeneity according to prespecified subgroups (type of maternal diabetes, body composition technique and study quality). We checked whether conclusions differed when only high-quality studies were analysed by conducting a meta-analysis restricted to studies with a high modified Newcastle–Ottawa score (5 out of 5).
We also performed subgroup analysis by infant sex and large for gestational age/macrosomic infants. We performed a separate meta-analysis of all studies providing results adjusted for maternal BMI. We calculated the mean difference in maternal pre-pregnancy BMI between mothers with and without diabetes for each individual study and plotted this against the mean difference in infant fat mass or body fat %. If the graphs suggested that studies with larger differences in maternal BMI had larger differences in offspring adiposity, we would have performed a meta-regression.
Results
Literature search
We identified 431 papers, of which 45 matched inclusion criteria. We identified two additional studies from reference lists.25 ,26 We contacted five authors for body composition or maternal diabetes data; two provided data.27 ,28 Thirty-five papers remained in the systematic review, following exclusions (see online supplementary figure S1). Seven authors provided outcome means and SD on request,15 ,17 ,18 ,20 ,27 ,29 ,30 and final meta-analysis data were available from 27 studies. We analysed neonatal (ie, infants <4 weeks old) measurements separately. We report body composition data in table 1. We also present skinfold thickness data (see online supplementary table S1) and describe all included studies (see online supplementary table S2).
Body composition data in infants of mothers with and without diabetes from individual studies included in the systematic review using (A) skinfolds and (B) other techniques
Fat mass
Ten studies provided unadjusted data for IDM (all types) and NIDM. Six studies derived fat mass from skinfold thickness,15 ,21 ,25 ,26 ,28 ,31 three studies used air displacement plethysmography (ADP)17 ,18 ,20 and one study used total body electrical conductivity (TOBEC).16 Fat mass was higher in IDM (overall 83 g (49 to 117); p<0.00001) (figure 1). The pooled mean difference of 83 g represents 22% greater fat mass in IDM in comparison with the mean fat mass of NIDM across all studies.
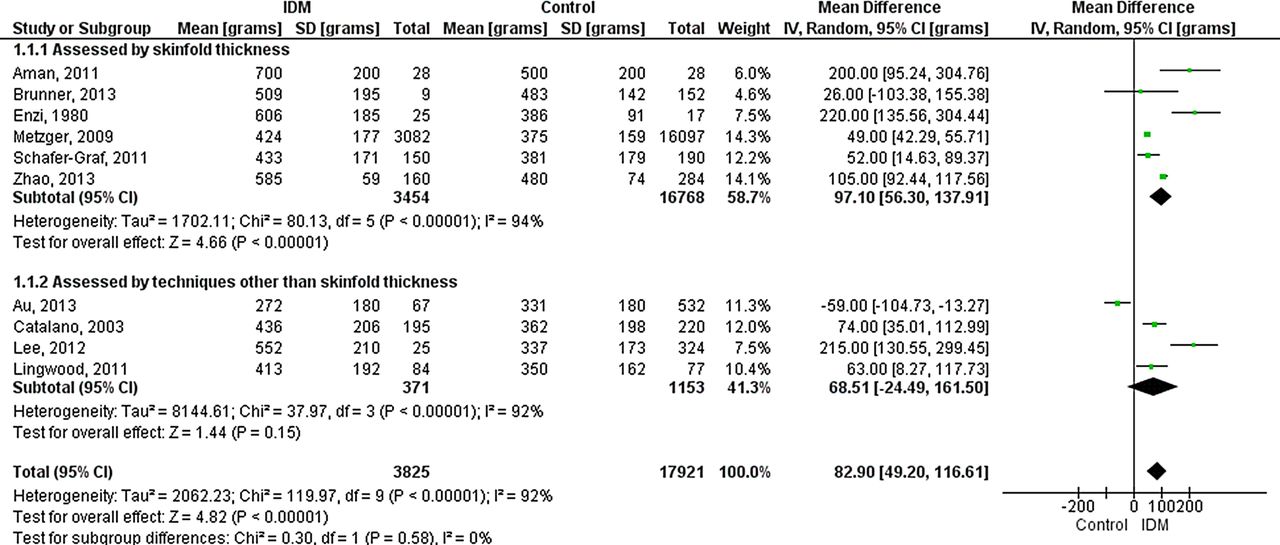
Forest plot (random effects analysis) comparing fat mass (g) in IDM and NIDM (all types of diabetes).
Fat-free mass
Eight studies provided unadjusted data. Four studies used skinfold thickness,15 ,21 ,28 ,31 three studies used ADP17 ,18 ,20 and one study used TOBEC.16 There was no significant difference in fat-free mass between IDM and NIDM (overall −11 g (−99 to 77); p=0.81) (figure 2).

Forest plot (random effects analysis) comparing fat-free mass (g) in IDM and NIDM (all types of diabetes).
Body fat %
Ten studies provided unadjusted data. Five studies used skinfold thickness,15 ,21 ,25 ,28 ,31 four studies used ADP17–20 and one study used TOBEC.16 Body fat % was higher in IDM (overall 2.2% (1.1% to 3.2%); p<0.0001) (figure 3). There was no evidence of funnel plot asymmetry for any outcome (see online supplementary figures S2–S4).

Forest plot (random effects analysis) comparing body fat % in IDM and NIDM (all types of diabetes).
Triceps and subscapular skinfold thicknesses
Raw and unadjusted triceps and subscapular skinfold thicknesses were reported in 17 studies.15 ,16 ,21 ,27–40 Both were higher in IDM (0.52 mm (0.37 to 0.68) and 0.81 mm (0.56 to 1.05), respectively; p<0.00001) (see online supplementary figures S5–S6).
Subgroup analyses
Types of maternal diabetes
Gestational diabetes mellitus
Ten studies provided body composition data in infants of mothers with and without GDM.15–19 ,21 ,25 ,26 ,28 ,31 Infants of mothers with GDM had higher fat mass (62 g (29 to 94); p=0.0002) (see online supplementary figure S7) and body fat % than NIDM (1.7% (0.7% to 2.8%); p=0.002) (see online supplementary figure S8), but fat-free mass was not significantly different (−23 g (−116 to 70); p=0.62) (see online supplementary figure S9). Raw and unadjusted skinfold data were reported in 12 studies.15 ,16 ,21 ,27–31 ,33 ,37–39 Infants of mothers with GDM had higher triceps (0.47 mm (0.27 to 0.66); p<0.00001) and subscapular skinfolds (0.69 mm (0.37 to 1.02); p<0.0001). Heterogeneity remained high for all outcomes (χ2 p<0.05, I2>92%).
Type 1 diabetes
Two studies presented separate body composition data25 ,31 and one presented skinfold thickness data34 in infants of mothers with T1D. Fat mass (268 g (139 to 397), p<0.0001) and body fat % (5.3% (−0.1% to 10.7%), p=0.05) were higher in IDM (see online supplementary figures S7 and S8). Heterogeneity was significant for body fat % (χ2 p=0.0005, I2=92%), but not for fat mass (χ2 p=0.11, I2=61%).
Maternal diabetes type accounted for 89% of the variation in fat mass and 39% of the variation in body fat %, although the difference for body fat % was not statistically significant (indicated by test for subgroup differences in forest plots).
Type 2 diabetes
No study provided separate data for infants of mothers with T2D.
Infant sex
One study reported sex-specific data17 and we received data from nine additional authors.16 ,18 ,20 ,21 ,27 ,28 ,30 ,38 ,41 Six studies provided unadjusted body composition data in IDM and NIDM girls and boys.16–18 ,20 ,21 ,28 IDM girls had lower fat-free mass than NIDM girls (−85 g (−152 to −17); p=0.01), but fat mass (42 g (−33 to 116); p=0.27) and body fat % (1.5% (−0.4% to 3.4%); p=0.13) were not significantly different. IDM boys had higher fat mass (87 g (30 to 145); p=0.003) and higher body fat % (2.3% (1.0% to 3.7%); p=0.0008) than NIDM boys, but fat-free mass was not significantly different (−49 g (−150 to 52); p=0.34). Heterogeneity was not detected between male and female subgroups for any outcome (χ2 p>0.05, I2=0%). Of note, in this subgroup analysis, when sexes were combined, the results for fat mass and body fat % were similar to the overall analyses, but fat-free mass was significantly lower in IDM (−76 g (−123 to −29), p=0.002).
Six studies reported raw and unadjusted skinfold data in IDM and NIDM girls and boys.16 ,21 ,27 ,28 ,30 ,38 IDM girls had greater triceps and subscapular skinfolds (p<0.05) than NIDM girls. IDM boys had greater triceps and subscapular skinfolds (p<0.001) than NIDM boys.
Large for gestational age/macrosomic infants
Three studies provided separate body composition data in large for gestational age/macrosomic IDM and NIDM.42–44 In IDM, fat mass was higher (220 g (62 to 379); p=0.006) and fat-free mass was lower (−140 g (−246 to −34); p=0.009).
Heterogeneity
Heterogeneity was statistically significant with between-study differences accounting for >90% of variation throughout (χ2 and I2 values in forest plots). The following additional potential sources of heterogeneity were investigated.
Type of technique
Studies assessing adiposity using skinfold thickness were compared with those using other techniques (figures 1⇑–3). Technique accounted for none of the variation in fat mass or body fat % and 26% of the variation in fat-free mass, though there were no statistically significant differences between the groups. Furthermore, heterogeneity remained high within the technique subgroups.
Study quality
Only one study achieved a highly modified Newcastle–Ottawa score; a separate analysis was not possible.15
Adjusted analyses
One study provided data adjusted for a number of confounders; a separate analysis was not possible.15
Maternal pre-pregnancy BMI
We included studies providing maternal BMI measured pre-pregnancy or during pregnancy as these are closely correlated. Four studies adjusted body composition for BMI obtained pre-pregnancy17 ,18 ,21 or at the time of glucose tolerance test (GTT).15 A meta-analysis of the unadjusted data showed greater fat mass (73 g (27 to 119), p=0.002) in IDM, but differences in body fat % (1.2% (−0.3% to 2.8%), p=0.11) and fat-free mass (−72 g (−188 to 45), p=0.23) were not statistically significant. The results were similar with adjusted data (fat mass 64 g (12 to 115), p=0.02; body fat % 1.2% (−0.3% to 2.6%), p=0.11; fat-free mass −64 g (−182 to 54), p=0.29).
Eight studies reported maternal pre-pregnancy BMI16–19 ,21 ,26 ,28 or BMI at the time of GTT.15 Plots of mean difference in maternal BMI between mothers with and without diabetes against mean difference in infant fat mass and body fat % showed no evidence of a relationship between increasing maternal BMI and increasing infant adiposity (see online supplementary figures S10–S11).
Discussion
We have shown that maternal diabetes is associated with significantly higher fat mass, body fat % and skinfold thickness in infancy. We summarised data acquired using a range of body composition techniques, from 35 papers and over 24 000 infants. We followed a preregistered public protocol, with the aim of reducing reporting bias23 and included studies from ethnically diverse countries.
The main limitation was the high degree of study heterogeneity. We investigated potential sources by sensitivity analysis, namely study quality, body composition technique and maternal diabetes type. Subgroup analysis of study quality was not possible as only one high-quality study was identified.15 This reflects the small and observational nature of the majority of studies included. Subgroup analyses of data derived from skinfold thickness and other techniques revealed no significant differences between subgroups and heterogeneity was high irrespective of the technique used. The majority of studies included offspring of mothers with GDM and the overall findings were mainly reflective of this group. Significant heterogeneity remained in the subgroup analysis of studies of mothers with GDM. The variable definition and treatment of GDM among studies are likely contributing factors. Adiposity was significantly higher in infants of mothers with T1D, but there were insufficient studies to perform separate meta-analyses for T2D. Metabolic effects of exposure to diabetes in utero appear to be similar regardless of diabetes type,8 ,45 ,46 but the effect on infant adiposity warrants further investigation. Though we identified a high degree of study heterogeneity, the consistency of findings led to greater confidence in the conclusions. IDM also had greater fat mass than NIDM within the subgroup of large for gestational age/macrosomic infants. This finding supports an additional risk to metabolic health in these infants following exposure to maternal diabetes.47
A further strength was the provision of additional sex-specific data from many authors, enabling exploration of sex-specific effects of maternal diabetes. Fat mass and body fat % were statistically higher in IDM compared with NIDM boys but not girls. Boys grow more quickly and may be more vulnerable to glycaemic fluctuation. Lingwood et al17 found maternal fasting blood glucose to be the major predictor of infant body fat in boys but not in girls. Regnault et al48 found sex-specific associations of maternal glucose tolerance with childhood adiposity, but not fat-free mass. In our analysis of fat-free mass, there was very wide heterogeneity. We found significantly lower fat-free mass in IDM in some subgroups, including studies which provided sex-specific estimates (in girls but not in boys), but could not explain the heterogeneity between studies. The studies reported had limited power for sex-specific differences to be adequately explored. We recommend that future studies are powered to detect sex-specific effects.
The relationship between maternal diabetes in pregnancy and offspring adiposity has been examined in two previous systematic reviews but neither assessed effects in infancy and in both BMI was used as a measure of overweight.4 ,49 We previously found an association between maternal diabetes and childhood BMI z-score, which was attenuated in studies adjusting results for maternal pre-pregnancy BMI.4 In contrast, Kim et al49 found no statistically significant relationship between GDM and offspring BMI in the majority of studies, but did not perform a meta-analysis.
The rising prevalence of GDM in low/middle-income countries is strongly linked to increasing maternal obesity. The HAPO group found that maternal GDM and, to a lesser extent, maternal obesity were independently associated with newborn adiposity with their combination having the greatest impact.50 We performed a separate examination of studies that adjusted for maternal BMI; fat mass remained significantly higher in IDM, supporting an independent effect of maternal diabetes. This is also supported by sibling comparison studies which show that children born after their mother developed diabetes as opposed to before have higher systolic blood pressure, glycated haemoglobin, BMI and nearly four times the odds of developing T2D.9–11
We have shown that maternal diabetes is associated with greater infant adiposity. As fat mass appears to track from infancy into childhood, this may be a harbinger of longer term risks to health.51 ,52 A randomised controlled trial of GDM treatment showed reduced neonatal adiposity.53 However, little association was found between maternal glycaemia and offspring obesity at age 2 years in HAPO participants in Belfast (one of 15 study centres),54 nor have follow-up studies shown reduced early childhood obesity following treatment of GDM,55 ,56 though intriguingly female offspring had lower fasting glucose concentrations.55 In conclusion, published evidence identifies maternal diabetes as a risk factor for offspring adiposity. Whether this is a causal mediator for the well-recognised risks to the later health of IDM remains to be established.
Acknowledgments
We would like to thank all the authors listed in online supplementary table S2 who kindly contributed additional data to this meta-analysis.
References
Footnotes
▸ Additional material is published online only. Web references [57–64] are not cited in the text but cited in supplementary table S1. To view please visit the journal online (http://dx.doi.org/10.1136/archdischild-2015-309750).
Contributors All authors of the paper contributed to the writing of the study protocol. KML conducted the literature search, assisted by MJH; where required KML contacted the authors for further data; KML extracted the data from the relevant papers, checked by CG and KML, CG and MJH carried out a quality assessment of all included studies. KML and SS conducted the meta-analysis. KML, MJH and CG wrote the first draft of the paper. This was revised by NM. All authors contributed to the interim and final drafts of the paper. All authors approved the final version of the paper.
Funding This study was supported by an Action Medical Research Fellowship awarded to KML, grant number GN2008.
Competing interests KML and NM declare financial support for the submitted work from an Action Medical Research Fellowship; CG, MJH and SS have received funding from the National Institute of Health Research and NM has held research grants awarded by the National Institute of Health Research, Wellcome Trust, Action Medical Research, Child Growth Foundation, Department of Health, Westminster Medical School Research Trust, Healthcare Quality Improvement Partnership, HCA International and Bliss. CG's contribution to this study was supported by an Academy of Medical Sciences Starter Grant for Clinical Lecturers (supported by the Medical Research Council, Wellcome Trust, British Heart Foundation, Arthritis Research UK, Prostate Cancer UK and The Royal College of Physicians) and through a MRC Clinician Scientist Fellowship.
Provenance and peer review Not commissioned; externally peer reviewed.