Article Text

Abstract
Objective The SiPAP flow driver (Care Fusion, Dublin, Ohio, USA) offers synchronised nasal intermittent positive pressure ventilation (sNIPPV) using an abdominal capsule. This study aims to describe the accuracy and effects of synchronised NIPPV using SiPAP in preterm infants.
Design Ten infants, born <28 weeks’ gestation, receiving synchronised SiPAP-generated NIPPV, in ‘biphasic trigger’ mode, were observed. Abdominal capsule signals, delivered pressures, respiratory pattern and oxygen saturations were recorded. Tidal volume (VT), apnoeas, proportion of breaths supported by SiPAP and time between inspiration onset and SiPAP pressure rise were analysed.
Results Infants were of median 26+0 weeks’ gestational age and birth weight 776 g. Mean (SD) respiratory rate (RR) was 53 (14)/min. 82% (17) of spontaneous breaths triggered a SiPAP pressure peak. Mean time between inspiration and SiPAP pressure rise was 28 (20) ms. There was no difference in VT when breaths triggered a SiPAP pressure peak compared with breaths without a pressure peak. No VT was generated by pressure peaks delivered during apnoea. Capsule signals were not recognised following >10% of breaths, resulting in asynchronous NIPPV delivery. Movements resulted in irregular SiPAP pressures and desaturation. When the RR was faster, >55/min, breaths irregularly triggered a SiPAP pressure peak (p=0.003). Compared with times when every breath resulted in a pressure peak, lower mean pressures were achieved, 7.9 vs 8.4 cm H2O (p=0.02).
Conclusions The SiPAP synchronisation system triggered rapidly with most spontaneous breaths, but did not result in larger tidal volumes. When the RR was >55/min, the SiPAP delivered fewer pressure peaks at lower pressures.
- Neonatology
- Respiratory
Statistics from Altmetric.com
What is already known on this topic
-
Synchronised nasal intermittent positive pressure ventilation (NIPPV) may offer more support and higher tidal volumes to preterm infants than continuous positive airway pressure (CPAP) alone.
-
Non-synchronised NIPPV may not offer additional support over CPAP.
-
Ventilators used to deliver synchronised NIPPV are no longer available; CPAP flow drivers that currently offer synchronised NIPPV may not be as effective as ventilators.
What this study adds
-
The SiPAP flow driver effectively synchronises during early inspiration in 68% of spontaneous breaths.
-
Synchronisation of pressure changes has no impact on tidal volumes achieved.
-
When preterm infants were breathing faster, the SiPAP response was less consistent, with fewer pressure peaks triggered and lower pressures achieved.
Background
Preterm infants are frequently managed using non-invasive respiratory support. One such method is nasal intermittent positive pressure ventilation (NIPPV). Studies have shown that synchronised NIPPV (sNIPPV) may reduce the need for endotracheal intubation and reduce extubation failure compared with continuous positive airway pressure (CPAP).1–7 However, studies using non-synchronised NIPPV (nsNIPPV),8–13 or a mixture of synchronised and non-synchronised techniques,14 have not been as encouraging. Consequently, clinicians may prefer to provide sNIPPV.
Until recently, sNIPPV was typically generated by ventilators using abdominal capsules for synchronisation, similar to capsules used in apnoea monitors. However, these ventilators are no longer in production. One device that currently offers synchronised NIPPV is the SiPAP flow driver (Care Fusion, Dublin, Ohio, USA). This device can deliver ‘plain’ CPAP, sNIPPV and non-synchronised NIPPV. There is little evidence demonstrating the accuracy of any synchronisation device during NIPPV in preterm infants. There are no clinical data regarding the performance of the SiPAP synchronisation system. We previously reported that under optimal laboratory conditions the SiPAP synchronisation system delivered a varying number of synchronised pressure peaks, at varying pressures, particularly when high respiratory rates (RRs) were simulated.15
This study aims to describe the accuracy of the SiPAP synchronisation system and its effect on spontaneous breathing and tidal volume delivery during NIPPV in very preterm infants.
Method
We observed 10 infants, born <28 weeks’ gestation, who were receiving SiPAP-generated sNIPPV, for 30 min. Ethics approval was obtained from the Royal Women's Hospital Research and Ethics Committees and written parental consent was obtained prior to study. SiPAP was delivered using the manufacturer recommended circuit and nasal prongs (Infant Flow NCPAP circuit and prongs, Care Fusion, Dublin, Ohio, USA) and humidified using an MR850 humidifier (Fisher and Paykel Healthcare, Auckland, New Zealand). A SiPAP abdominal capsule (Graseby capsule—GC, Care Fusion, Dublin, Ohio, USA) was taped to the infant's abdomen below the xiphisternum and attached to the SiPAP transducer device. The SiPAP was set to ‘biphasic trigger’ mode (where all breaths detected by the capsule should trigger an NIPPV pressure peak). SiPAP pressures were set by adjusting the two internal bias flow metres. The ‘pressure low’ flow metre was adjusted to deliver positive end expiratory pressure (PEEP) of 7 cm H2O (flow 8–10 L/min). The ‘pressure high’ flow metre was adjusted to deliver peak pressure of 10 cm H2O (∼additional 5 L/min above the ‘pressure low’ bias flow, the maximum manufacturer recommended additional flow). The duration of each peak pressure was set to 0.3 s as this is the most commonly used high-pressure time during NIPPV16 and is the length of typical spontaneous inspiration in preterm infants.17 Apnoea time was set to 10 s, with a ‘back-up-rate’ of 30 peaks/min to be delivered in apnoea >10 s.
Signals from the SiPAP GC were measured directly from the SiPAP transducer. Delivered SiPAP pressures were measured using the in-built pressure line via a respiratory function monitor (Florian, Acutronic Medical Systems AG, Hirzel, Switzerland). Spontaneous breathing was assessed using respiratory inductance plethysmography (RIP) (Somnostar and Respiband Plus, Sensor Medics, Yorba Linda, California, USA). RIP was not calibrated to a measured tidal volume; therefore, values represent relative tidal volume (rVT), in millivolts (mV). For ease of illustration, the abdominal RIP trace is used in the figures. The sum of the abdominal and chest RIP traces was used in the tidal volume analyses. Oxygen saturation (SpO2) was measured using a Masimo Radical SET Pulse Oximeter (Masimo v4, Irvine, California, USA). All signals were digitised and simultaneously recorded to a single computer using Spectra software (Grove Medical, London, UK).
Five 1-min sections, taken from every 5 min of each recording, were analysed for each infant. This pattern was chosen to collect representative data throughout the duration of the recording period. The proportion of spontaneous breaths that triggered a SiPAP pressure peak and the time between the onset of spontaneous inspiration and the SiPAP pressure rise were assessed. When assessing the delivered pressures, the 1-min section from each infant where the fewest number of breaths triggered SiPAP pressure peaks was analysed. This section was separated into periods when all breaths triggered the SiPAP, and periods when breaths intermittently triggered it. Peak, PEEP and mean pressures for the two periods were compared. The longest continuous section in each recording where breaths intermittently triggered SiPAP pressure peaks was used to compare rVT between breaths where a pressure peak occurred and breaths where no pressure peak occurred. The entire recording periods were assessed for apnoea. All data were manually extracted and analysed using STATA V.10 (Statacorp LP, Texas, USA). Linear regression was used to analyse data where multiple data points were generated for each infant, and Wilcoxon signed-rank test was used to analyse data when a single data point was generated for each infant.
Results
Infants were of median (IQR) gestational age 26+0 (25+5–26+2) weeks, birth weight 776 (709–816) g, studied at a median of 29 (22–38) days and 1044 (840–1137) g. Three infants were male; all had previously been intubated and ventilated. At the time of study, infants had received NIPPV for 7 (5–15) days and all were treated with caffeine.
SiPAP accuracy and response time
The mean (SD) spontaneous RR was 53 (14)/min as measured by RIP. This was identical to the RR measured by the SiPAP abdominal capsule (53 (14), p=0.90). Overall, 82% (17) of spontaneous breaths detected by the GC triggered a SiPAP pressure peak (figure 1A).

(A) Respiratory rate 66/min, as measured by both respiratory inductance plethysmography (RIP) and the SiPAP capsule (bottom two waveforms correlate). All breaths trigger a SiPAP pressure peak (top waveform). (B) Start of recording shows SiPAP capsule correctly identifying all breaths (bottom two waveforms correlate), but the SiPAP does not respond to these capsule signals, pressure peaks are delivered at the ‘back-up’ rate of 30/min (dashed arrows), asynchronously with spontaneous breathing. Dotted horizontal line denotes set positive end expiratory pressure (PEEP) (7 cm H2O). Second half of the recording shows the SiPAP responding appropriately to the capsule signals, pressure peaks are delivered in synchrony with spontaneous breathing.
SiPAP pressure peaks were typically delivered early in spontaneous inspiration; the mean (SD) time between the onset of inspiration detected by RIP and the onset of SiPAP pressure rise was 28 (20) ms. During the 82% of breaths that triggered a SiPAP pressure peak, 83% occurred within 50 ms of the onset of inspiration, a further 9% commenced within 150 ms of inspiration.
Periods of SiPAP asynchrony
The GC accurately correlated with the RIP throughout all recordings; however, in some infants, recordings demonstrated that some breaths detected by the GC did not result in a SiPAP pressure peak. Instead, the SiPAP delivered the ‘back-up rate’ of 30 pressure peaks/min, asynchronously with spontaneous breathing, as if the infant was apnoeic (figure 1B). This occurred in six infants, in 13/50 analysed sections, totalling 10.7% of the total 50 min of analysed time.
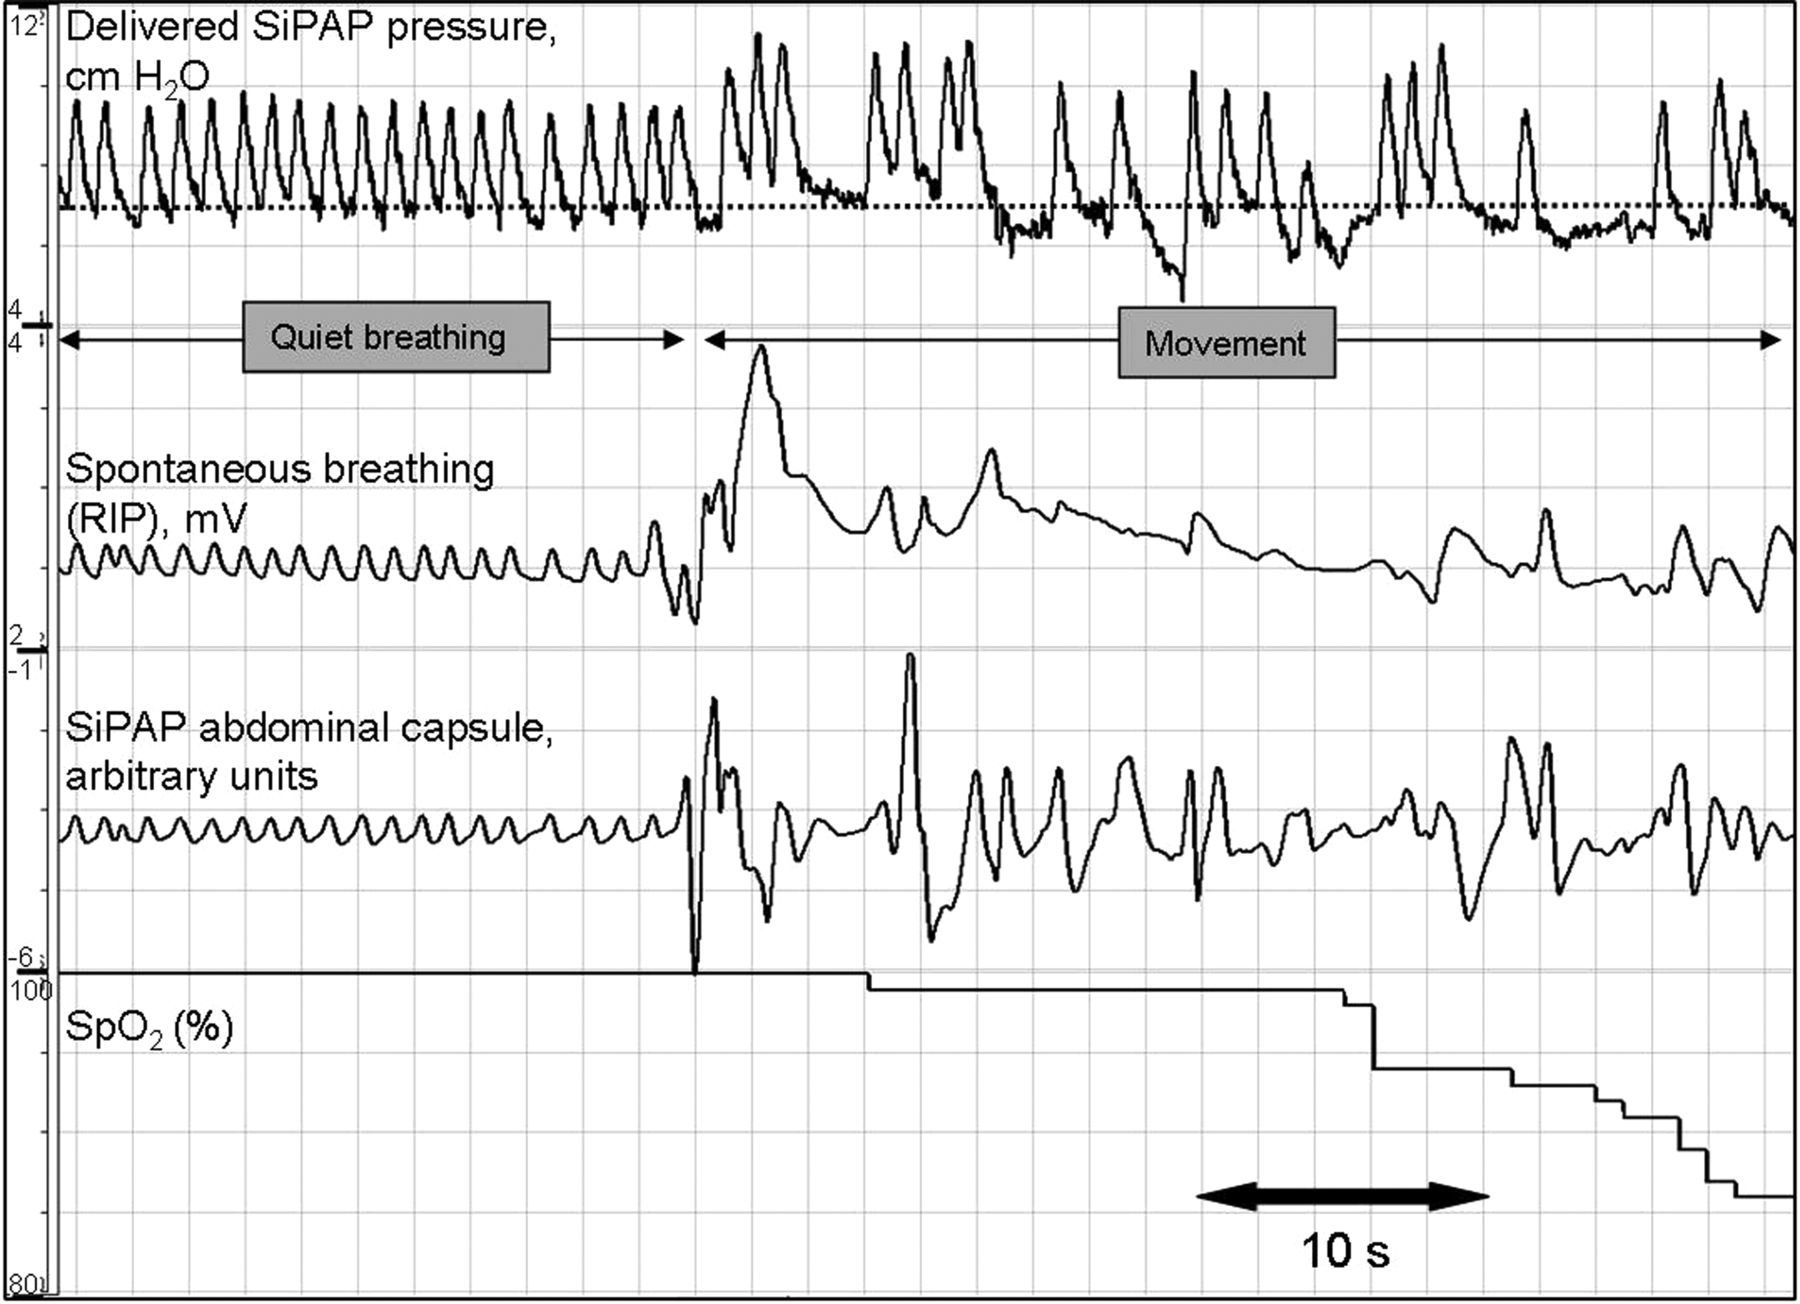
Frequently, throughout all 10 recordings, periods of infant movement were recorded by the RIP and GC as irregular waveforms. This resulted in irregular SiPAP pressure peaks, commencing soon afterward (figure 2). These episodes were frequently associated with desaturation.

A period of quiet breathing, followed by a period of generalised movement, as seen by the haphazard traces from the respiratory inductance plethysmography (RIP) and abdominal capsule. Dotted horizontal line denotes set positive end expiratory pressure (PEEP) (7 cm H2O). It is not clear whether the infant is breathing while moving. SiPAP pressure peaks become irregular with a wandering baseline, desaturation occurs.
Periods of apnoea and tachypnoea
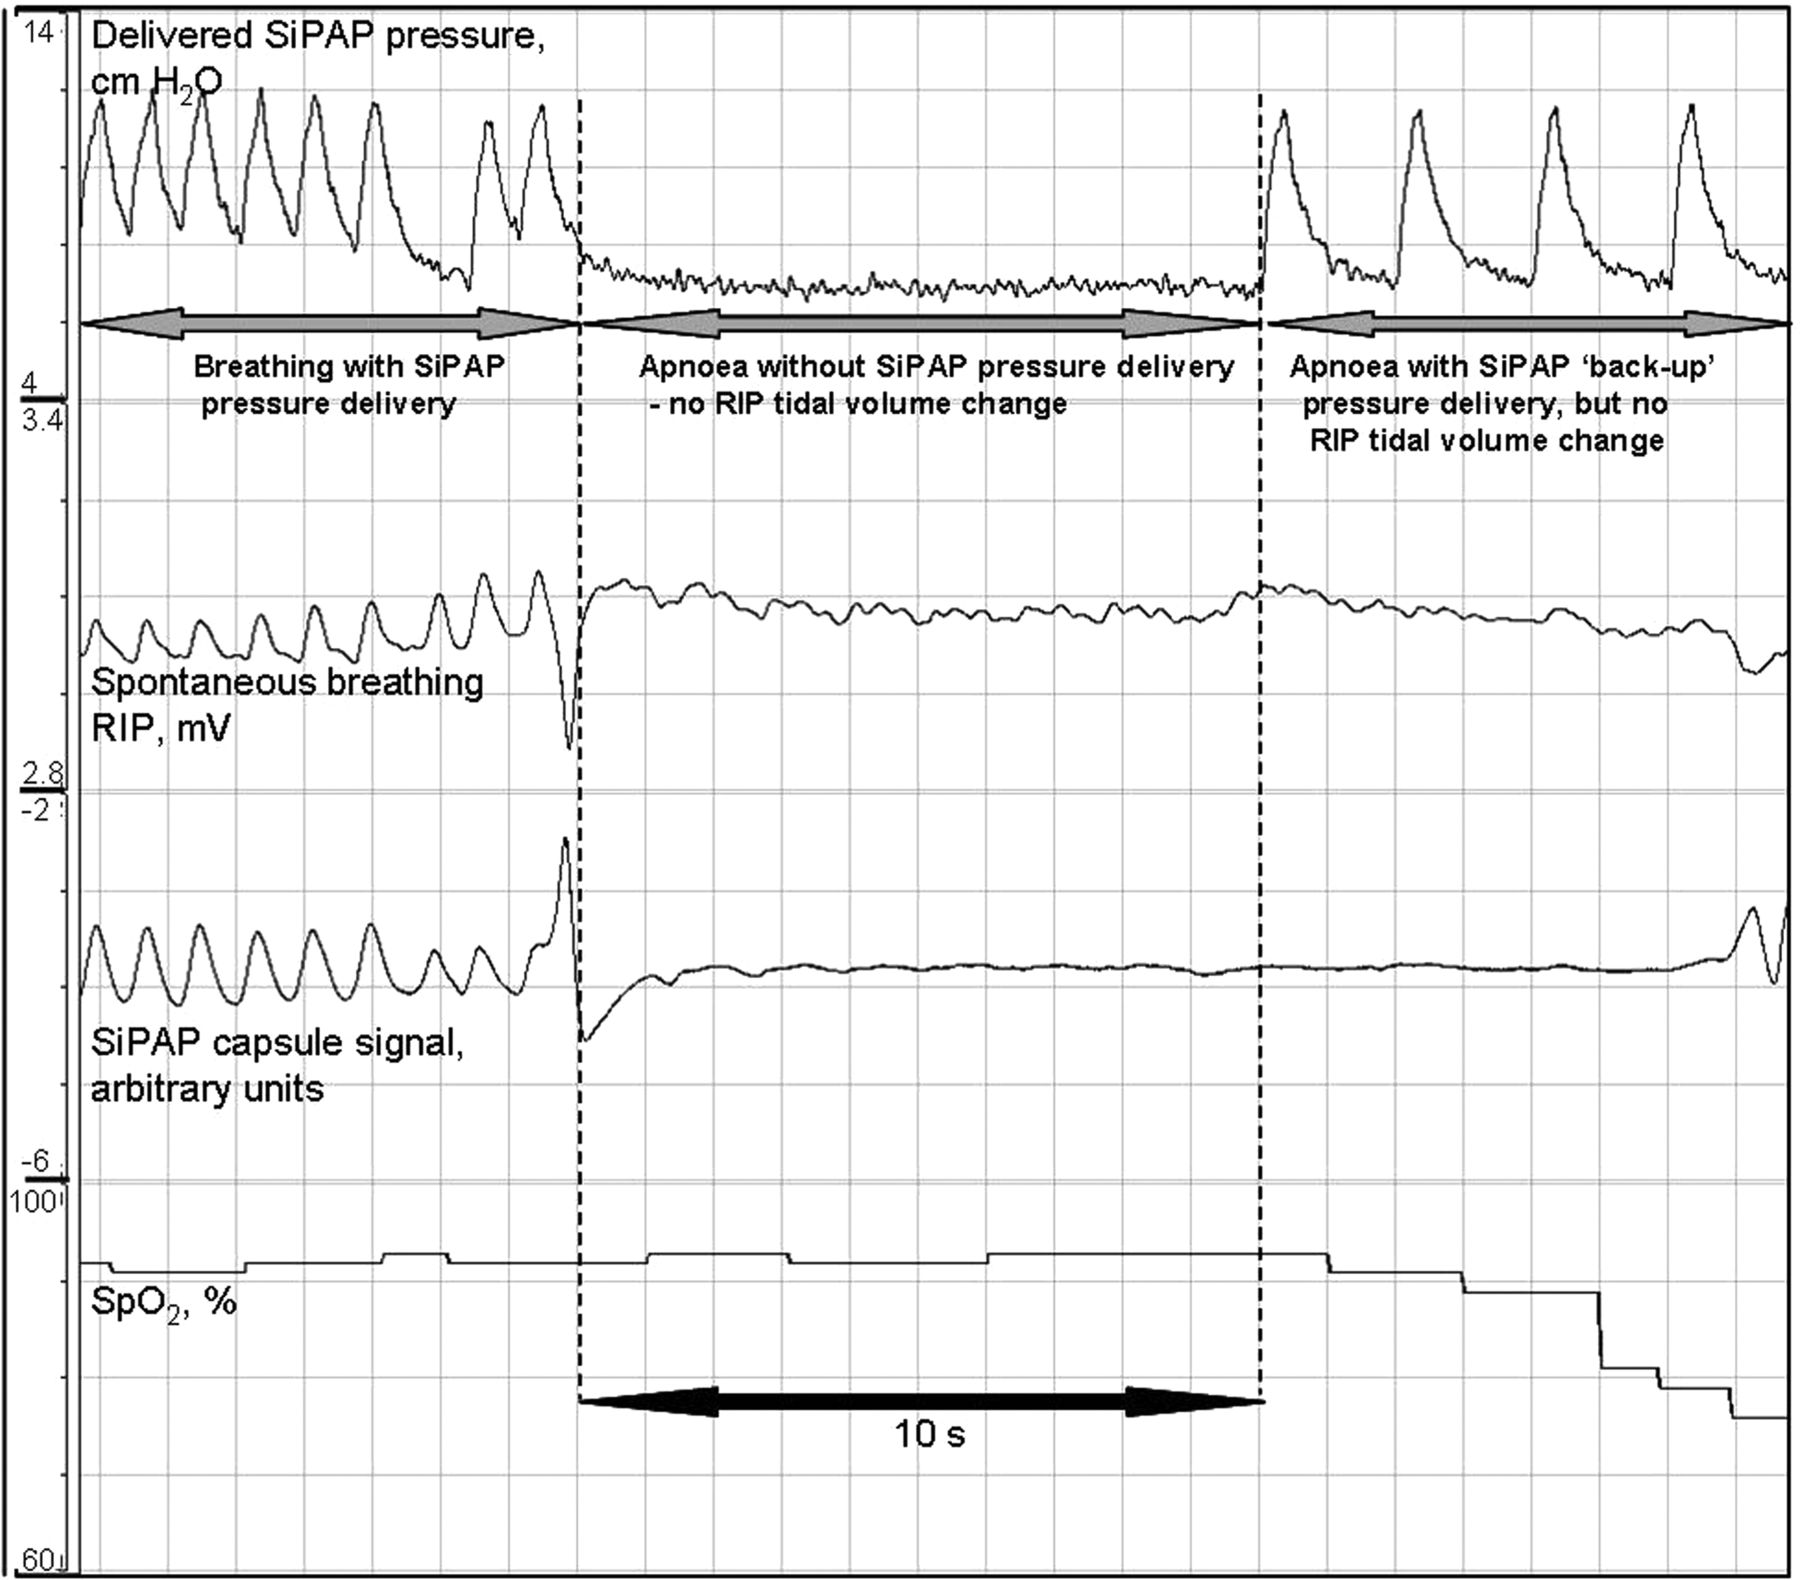
In five infants, there were six apnoeic periods longer than the set SiPAP apnoea time of 10 s (range 10–23 s). During these periods, following 6–10 s of apnoea, the SiPAP ‘back-up rate’ triggered. This delivered pressures with an average peak of 10.6 cm H2O at a rate of 30/min. No pressure peaks delivered during apnoea generated any measurable tidal volume (figure 3).

The first part of the recording demonstrates spontaneous breathing with synchronous SiPAP pressures, which is followed by apnoea without SiPAP pressure delivery. After 10 s, the SiPAP ‘back-up’ rate commences; however, no correlating tidal volume changes are recorded in the respiratory inductance plethysmography (RIP) trace.
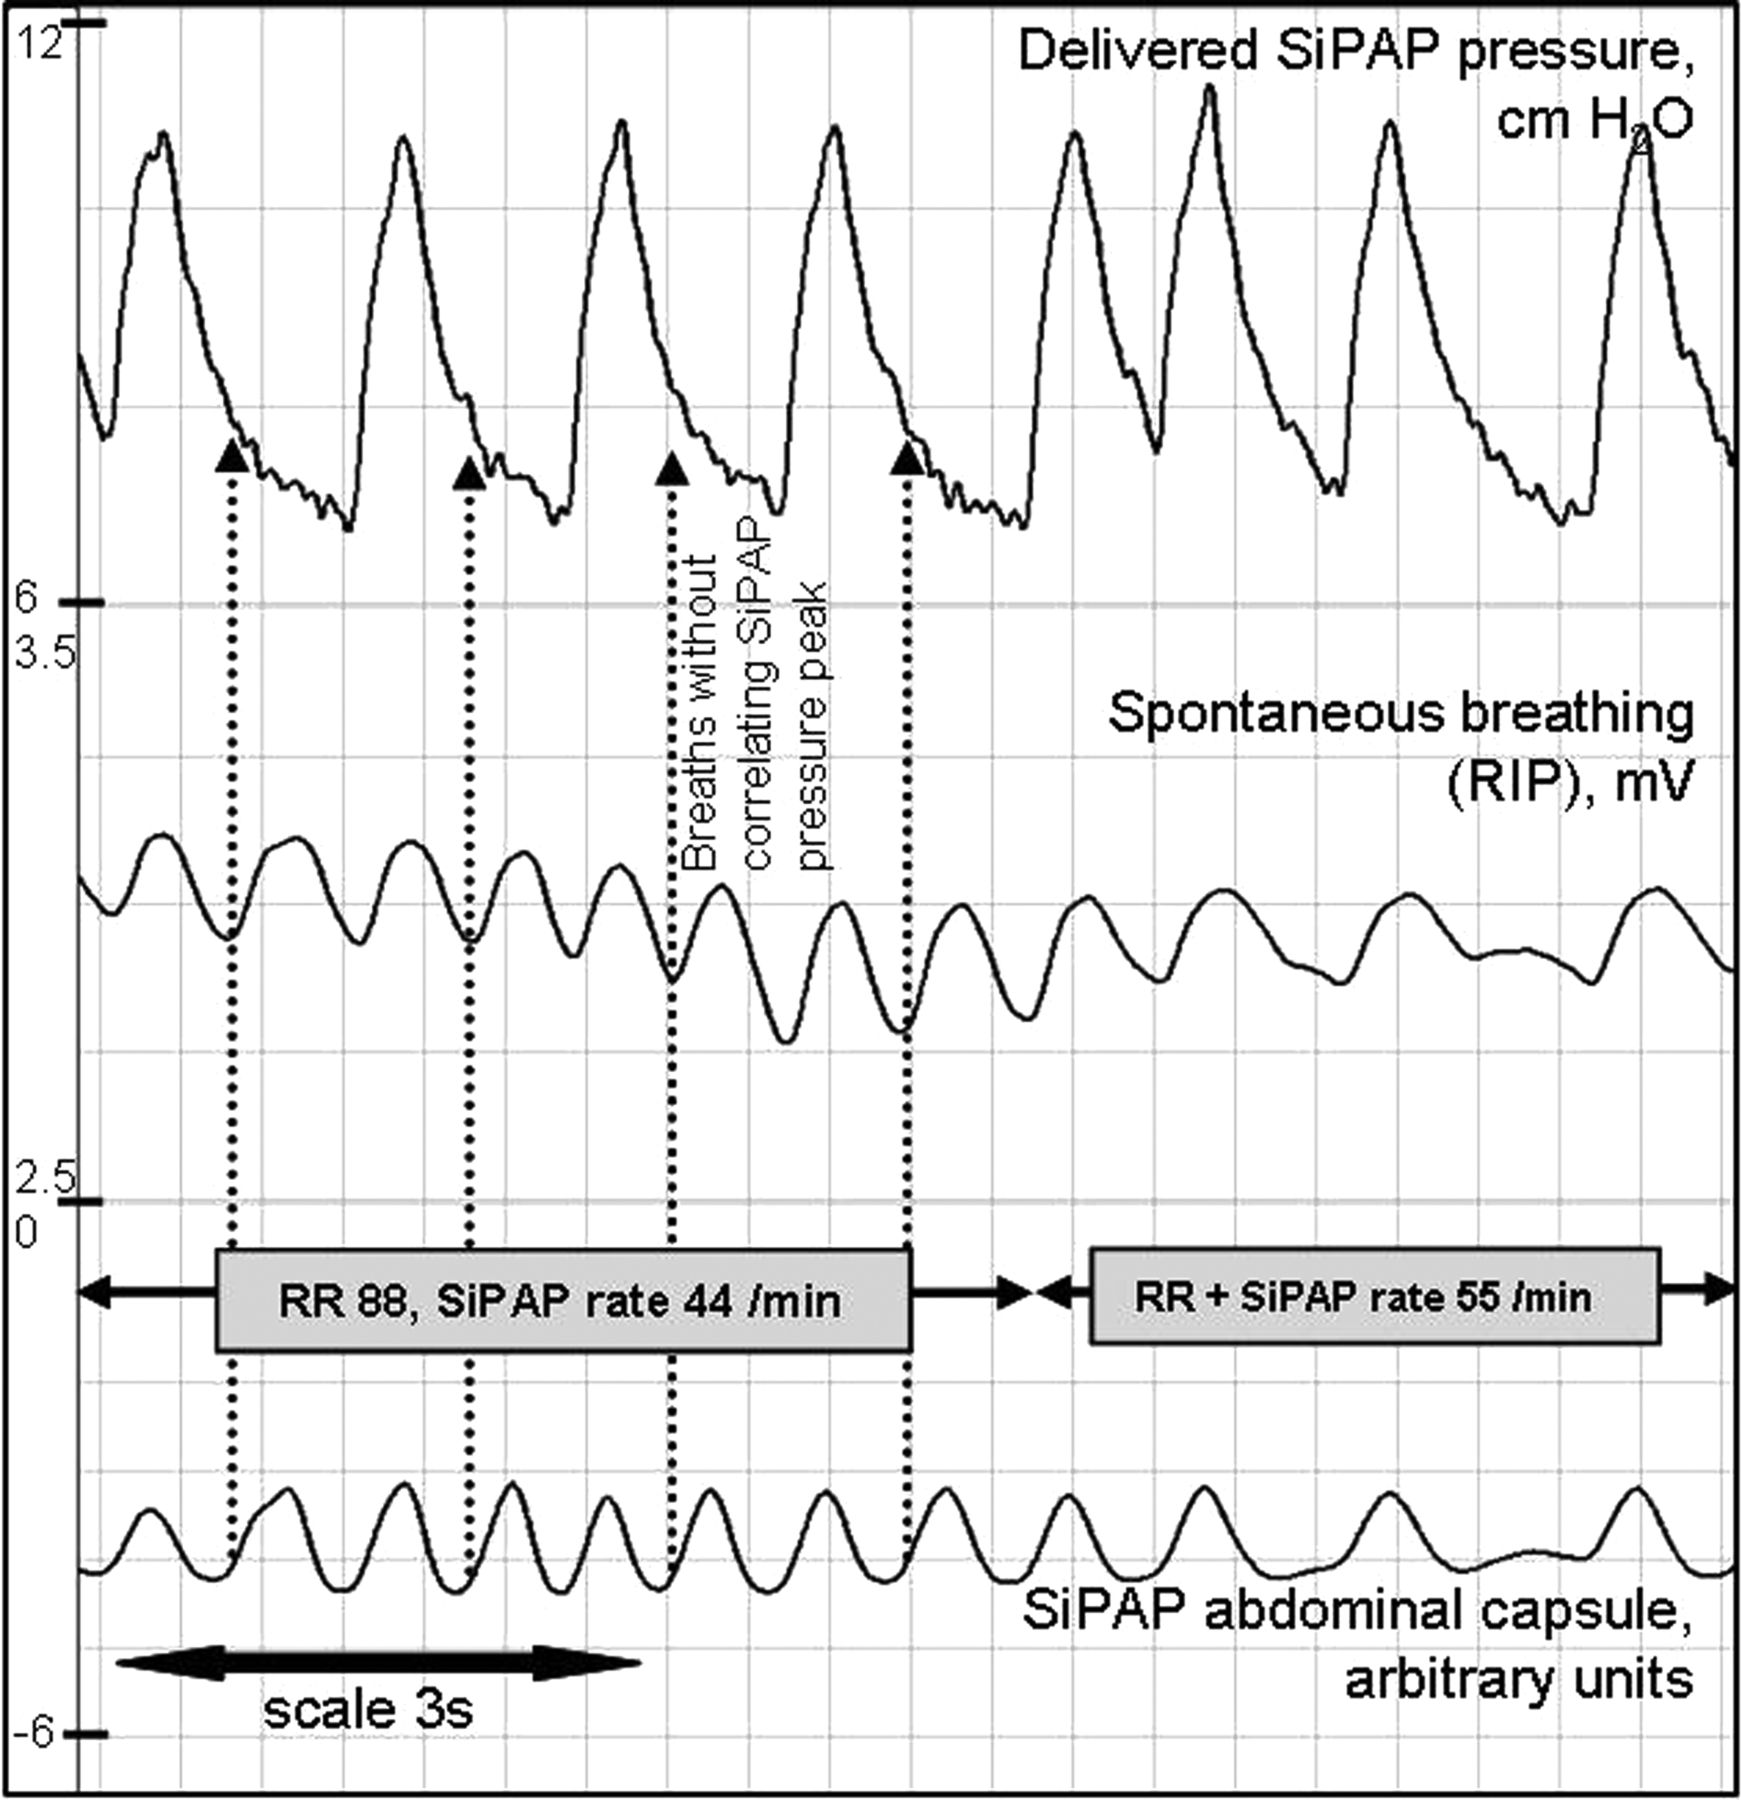
Overall, fewer breaths triggered a SiPAP pressure peak when the RR was higher, especially when the RR was >55/min (figure 4) despite the SiPAP GC accurately detecting all breaths. When the RR was >55/min, 75% of breaths triggered a SiPAP pressure peak compared with 89% when the RR was ≤55/min (p=0.003). The highest RR recorded where all breaths triggered a SiPAP pressure peak for a period was 75/min and was very brief (<10 s). One infant, despite RR <55/min and good GC signals, consistently only triggered intermittent SiPAP pressure peaks (range 44–67%) (figure 5).

At the start of the recording, respiratory rate is >80/min, the SiPAP delivers a pressure peak with alternate breaths. Dotted arrows show breaths detected by the SiPAP capsule, confirmed by respiratory inductance plethysmography (RIP), but without a correlating SiPAP pressure peak. As the respiratory rate slows in the second half of the recording, the SiPAP delivers a pressure peak with every spontaneous breath.

This example is from an infant with a respiratory rate ≤40/min, respiratory movements are clearly detected by the abdominal capsule (bottom two waveforms correlate), but intermittently trigger a SiPAP pressure peak.
Effects on tidal volume and pressure delivery
The mean (SD) rVT of spontaneous breaths correlating with a SiPAP pressure peak was 0.35 (0.14) mV. When compared with rVT of breaths without a SiPAP pressure peak, there was no difference 0.34 (0.16) mV, (p=0.97).
During periods when all breaths triggered a SiPAP pressure peak, the mean pressure generated was 8.4 cm H2O. This was higher than the mean pressure generated when intermittent breaths triggered a pressure peak, 7.9 cm H2O (p=0.02). PEEP when all breaths triggered a SiPAP pressure peak was 7.0 as compared with 6.8 cm H2O (p=0.03) when intermittent breaths triggered the SiPAP. Peak pressures were no different, 10.7 cm H2O with consistent pressures peaks vs 10.5 cm H2O with intermittent triggering (p=0.25).
Discussion
This study demonstrated that the SiPAP GC consistently, correctly and quickly identified spontaneous breaths as accurately as RIP. These signals resulted in a SiPAP pressure peak being generated for the majority, >80%, of spontaneous breaths. However, the pressure peaks made no impact on tidal volume, and during faster breathing the SiPAP response was less consistent, with fewer pressure peaks triggered and lower pressures achieved.
Previous studies using an abdominal capsule and a ventilator (Infant Star 950 with StarSync capsule, Infrasonics Inc., San Diego, California, USA) showed good synchronisation between spontaneous breathing and the GC–ventilator combination.18 ,19 One group, using this ventilator to deliver NIPPV, reported that synchronised pressure peaks occurred in ‘the first half of inspiration’ ≥88% of the time when set to deliver 20 or 40 pressure peaks per minute.19 There are no equivalent clinical data using the GC-SiPAP combination. In the 82% of breaths that we found triggered a SiPAP pressure peak, 92% commenced within 150 ms (ie, during the ‘first half’ of a typical inspiration lasting 300 ms), meaning that 75% of breaths resulted in a SiPAP pressure peak within 150 ms, lower than reported using the Infant Star ventilator with StarSync capsule.19
Previous laboratory work using the SiPAP15 demonstrated that up to a rate of ∼60/min, 100% of simulated breaths triggered a SiPAP pressure peak, but the per cent decreased as simulated RR increased towards 80/min, when triggering occurred with alternate ‘breaths’. The clinical data presented in our current study have also shown that when infants were breathing faster, and despite accurate GC signals, the SiPAP triggered less often, sometimes delivering a pressure peak with alternate breaths. This means that the SiPAP rate decreased when the infant breathed faster, which may be the opposite to what was clinically indicated. In the ‘biphasic trigger’ mode, the SiPAP device theoretically triggers following every spontaneous breath. With set peak pressure duration of 0.3 s, the theoretical maximum number of pressure peaks would be 100/min as the device will not deliver a reversed high-pressure to low-pressure ratio (personal communication with manufacturer). However, we did not find any recording where all breaths at very high RRs consistently triggered the SiPAP. In some infants, we saw brief periods, up to 75/min, where all breaths triggered a SiPAP pressure peak, but we also recorded periods where apparently good capsule signals, at RR <60/min, did not result in a synchronised SiPAP pressure peak, either failing to trigger at all or defaulting to the set ‘back-up rate’ and delivering asynchronous pressure peaks. The reasons for this were not clear. The variation did not seem to be due to poor GC signal (such as might be seen with incorrect capsule position or inference due to infant movement) as the GC signals at these times were very good, consistently correlating with the RIP.
In this study, similar to our previous laboratory results,15 when fewer SiPAP pressure peaks were delivered, with longer intervals between pressure peaks, the pressure continued to fall during PEEP, resulting in lower overall pressures. The implication of this was that SiPAP pressure support was lower when breathing was faster, which may again be contrary to clinical need, and yet may not be apparent to bedside staff as no alarms were triggered. This falling pressure pattern was also seen during the ‘back-up’ rate delivered in apnoea (figure 3).
We observed that when infants moved around, the GC detected the associated abdominal movements that were not necessarily respiratory in origin but that still triggered pressure peaks. It was not possible to tell whether the infants were making breathing efforts during these times or whether their movements represented periods of obstructive apnoea. Obstructive apnoea with loss of lung volume could explain the accompanying desaturation occurring at these times. If obstructive apnoea occurred during movement, the superimposed SiPAP pressure peaks might have overcome the obstruction to ameliorate the desaturation; alternatively irregular pressure peaks during movement may have offered less support than during quiet breathing, exacerbating the respiratory deterioration.
During apnoea, identified by flattening of the RIP waveform, we found that the SiPAP ‘back-up’ pressures did not generate any tidal volume. This lack of tidal volume effect during apnoea has also been described during ventilator-generated NIPPV20 and could be due to insufficient pressure or an unobserved obstructive component to the apnoea.
We found that tidal volume did not increase when a pressure peak coincided with a spontaneous breath, calling into question what advantage synchronisation offers, if any. One previous study, using ventilator-generated sNIPPV at higher pressures than those used in this study, reported increased VT during synchronised breaths compared with breaths during CPAP.21 However, other studies have failed to detect a difference in VT when comparing ventilator-generated sNIPPV with CPAP.19 ,22 ,23 The NIPPV achieved using SiPAP may be quite different from the ventilator-generated NIPPV used in the majority of published NIPPV trials. SiPAP has an absolute upper pressure limit of 15 cm H2O (11 cm H2O in non-synchronised modes), and in practice it is hard to deliver pressures at the top end of those ranges. Using the maximum recommend ‘flow high’ to achieve peak pressure resulted in peak pressure about 10 cm H2O, but no tidal volume effect. It is possible that if higher additional flow was used we may have seen different results. Ventilator-generated NIPPV can be delivered at higher pressures, and this may result in different clinical effects.
Results from a recent large randomised study, using a mixture of synchronised and nsNIPPV (including SiPAP-generated NIPPV), showed no difference in long-term outcome between NIPPV and CPAP.14 However, earlier RCTs did show benefits of sNIPPV over CPAP,7 more so than studies comparing CPAP with nsNIPPV.9 ,19 ,24 ,25 Therefore, future studies of neonatal NIPPV may need to focus on investigating sNIPPV, and the comparable effects of different delivery devices. The majority of randomised neonatal NIPPV studies have used high-pressure ventilator-generated NIPPV6 ,7 ,9 ,26 ,27; to date few have used SiPAP. The two published RCTs using SiPAP used it to deliver bi-level CPAP rather than traditional NIPPV.28 ,29 A bi-level CPAP strategy sets two CPAP levels, typically about 3 cm H2O apart, during which the infant breathes independently without any intent to synchronise, rather than setting a rate and an ‘inflation’ time. One bi-level CPAP study found no difference in extubation failure rates compared with CPAP.29 The other found no difference in inflammatory response compared with CPAP,28 although secondary outcomes including duration of respiratory support and length of stay were shorter in the bi-level CPAP group. No RCTs have used the SiPAP device to deliver synchronised NIPPV or compared it with ventilator-generated NIPPV. Despite this, SiPAP-generated NIPPV is already popular in some countries,16 ,30 while remaining unavailable in others (SiPAP capsule technology does not have Food and Drug Administration approval in North America).
Synchronised SiPAP-generated NIPPV should be compared with non-synchronised SiPAP-generated NIPPV, and with synchronised ventilator-generated NIPPV, the only NIPPV mode consistently shown to provide benefit over CPAP. Other methods of achieving non-invasive synchronisation for NIPPV, such as via RIP, may be effective and are being investigated.31 Following the withdrawal of the original ventilators that used GC synchronisation technology, and in light of the continued growth of non-invasive support, current ventilator manufacturers have begun to reincorporate GC technology into their systems, for example, Stephanie and Sophie ventilators (Stephan Medizintechnik, Gackenbach, Germany). These new ventilator systems will also need to be compared with currently available devices.
This study demonstrated that the SiPAP abdominal capsule produced consistent, reliable signals that rapidly triggered the SiPAP in most spontaneous breaths, but without corresponding increases in tidal volume. The SiPAP behaved paradoxically during faster breathing resulting in less support. Movement was often misinterpreted as breathing. Whether synchronisation during SiPAP-generated NIPPV is advantageous over unsynchronised SiPAP-generated NIPPV or whether it is equivalent to ventilator-generated NIPPV are unknown, and further studies comparing these modes of support are warranted.
References
Footnotes
-
Contributors LSO conceived and designed the study, recruited subjects, collected, analysed and interpreted data, drafted the manuscript. CJM contributed to study design, interpreted data, reviewed the manuscript and supervised the study. PGD contributed to study design, data interpretation, reviewed the manuscript and supervised the study; all authors approved the final version of the manuscript.
-
Funding The research work was funded by an Australian NHMRC Program Grant, No. 384100.
-
Competing interests Colin Morley is a consultant to Dräger Medical, Fisher and Paykel Healthcare and Laerdal Global Health.
-
Ethics approval Royal Women's Hospital Research and Ethics Committees.
-
Provenance and peer review Not commissioned; externally peer reviewed.
Linked Articles
- Editorial
- Original article
- Original article