Article Text

Abstract
Objective: To develop a tool for predicting survival to term in babies born more than 8 weeks early using only information available at or before birth.
Design: 1456 non-malformed very preterm babies of 22–31 weeks’ gestation born in 2000–3 in the north of England and 3382 births of 23–31 weeks born in 2000–4 in Trent.
Outcome: Survival to term, predicted from information available at birth, and at the onset of labour or delivery.
Method: Development of a logistic regression model (the prematurity risk evaluation measure or PREM score) based on gestation, birth weight for gestation and base deficit from umbilical cord blood.
Results: Gestation was by far the most powerful predictor of survival to term, and as few as 5 extra days can double the chance of survival. Weight for gestation also had a powerful but non-linear effect on survival, with weight between the median and 85th centile predicting the highest survival. Using this information survival can be predicted almost as accurately before birth as after, although base deficit further improves the prediction. A simple graph is described that shows how the two main variables gestation and weight for gestation interact to predict the chance of survival.
Conclusion: The PREM score can be used to predict the chance of survival at or before birth almost as accurately as existing measures influenced by post-delivery condition, to balance risk at entry into a controlled trial and to adjust for differences in “case mix” when assessing the quality of perinatal care.
Statistics from Altmetric.com
The prognosis for the very preterm baby has improved appreciably in the past 20 years. Maturity, as reflected by gestational age, is the main factor influencing survival, but birth weight is also influential.1 2 3 What remains incompletely explored is how these two factors interact; tables of survival probability by gestation and birth weight,1 although comprehensive, are cumbersome for modelling purposes. Increased understanding would not only help to inform the management of very preterm births, but would also improve the way that scoring systems adjust for differences in “case mix” when used in the context of neonatal audit. Early systems were designed to be scored by hand,4 5 6 7 but recently they have become more complex and computer based.
The aim of the study was to develop prediction models for survival in very preterm babies, based only on information available at or before birth, in which the predicted chance of survival could be presented graphically, so as to inform management and improve communication with parents. Early work on the the prematurity risk evaluation measure or “PREM score”8 9 demonstrated that a particular form of model provided a good fit to several distinct datasets, with the same set of variables being chosen consistently, although with different fitted coefficients. However, the results were published only in abstract form.8 9 Here we describe the development of the model using two recent datasets that together reflect current patterns of survival, and which confirm and validate the earlier findings.
Methods
Subjects
Information was collected on all babies born in the north of England in 2000–3, and after excluding those who died before the onset of labour or with a rapidly lethal malformation,10 there remained 1456 babies of 22–31 weeks’ gestation. For comparison purposes, similar information on 3382 births of 23–31 weeks’ gestation in the Trent region in 2000–4 was also collected, using the same exclusion criteria. The mothers were nearly all of European origin.
Data
Information collected included date of birth and expected date of delivery, sex and birth weight, plus for those that died before term, their date of death. Stillbirths were included if alive at the onset of labour. Gestation at birth was estimated from a combination of menstrual information and ultrasound at 12–14 weeks, documented to the day in the Northern region11 and the last completed week in Trent. Base deficit was also measured in umbilical cord blood in the Northern region.
Statistical methods
For consistency gestation was analysed to the last completed week in both regions. Weight-for-gestation was expressed as a z score using a reference sample of all Northern region births in 1990–212 re-analysed using the LMS method13 (see table W1 available online only). Birth weight z score is the number of standard deviations that birth weight differs from the median for gestation and sex.
In addition, to simulate birth weight predicted antenatally from ultrasound, random noise with a standard deviation (SD) of 15% was added to each birth weight, corresponding to the prediction error of fetal weight.14 This was done by adding to each birth weight z score a random normal deviate with mean zero and SD 15%/20% = 0.75, in which the 20% corresponds to the coefficient of variation at 31 weeks’ gestation (S = 0.2 in table W1, available online only). This assumes increased variability but no bias relative to true mean birth weight by gestation. The variable is here called the “noisy” birth weight z score.
Base deficit was measured in all but 279 (20%) of the Northern liveborns. To avoid bias it was important to include the missing babies, and their values were imputed by resampling from the observed distribution of values.
The data were analysed using logistic regression to identify factors best predicting survival to the expected date of delivery. Three distinct models were developed, the first two making the prediction at the time of birth and the third at the onset of labour. The “birth” model had as explanatory variables gestation, sex and birth weight z score, and was developed using data for all liveborn infants in the two regions, separately and together. The “birth-condition” model added base deficit, and was developed using Northern region data. The third “labour” model was based on all infants in the two regions alive at the onset of labour including late stillbirths, and it used as explanatory variables gestation, sex and “noisy” birth weight z score. The uncertainty in base deficit and noisy z score were modelled using multiple imputation averaged over 10 datasets.
What this study adds
The PREM score is a simplified system that exploits information on gestation and size at birth and makes the collection of other non-standard information unnecessary.
It displays graphically the complex way in which gestational age and birth weight centile interact to influence the chance of survival.
The prediction appears to be almost as reliable before delivery as after, especially if gestation is calculated to the nearest day.
Linear and quadratic terms in gestation, z score and base deficit (for the birth-condition model), and their interactions with each other and with region, were tested for. The predictive power of the various relationships was compared using both the deviance and the area under the receiver operating characteristic (ROC) curve. Model goodness of fit was assessed using the Hosmer–Lemeshow test. The regression coefficients are tabulated as log odds and their standard errors, and in the text some are antilogged and presented as odds ratios (OR) with confidence intervals.
For model development the significance level was set at p = 0.05, but this provides only weak evidence of a generalisable effect. For the final models a stricter criterion, the Schwarz Bayesian criterion,15 was applied to ensure robustness and parsimony. For an extra term to be included in the model the Schwarz Bayesian criterion required it to reduce the deviance by at least log(n) units, where n is the sample size. This deviance reduction corresponds approximately to the square of z, the Wald test statistic. Thus z2 ⩾ log(n), and the critical p value corresponding to z can be derived from the normal distribution. For example with n = 1500,

and p = 0.007.
A new graphical audit tool—the PREM score—was developed using the logistic regression models. It consists of a chart of gestation-and-sex-adjusted birth weight centile (or alternatively birth weight) plotted against gestation, and on the chart are a series of curves joining up points of equal survival probability (here called isosurvs). Each isosurv curve was obtained by solving the logistic regression equation linking the predicted odds of survival to gestation and other factors, over a series of z score values. An analogous graph was developed for base deficit and gestation.
Results
Table 1 summarises the Northern 2000–3 and Trent 2000–4 datasets, showing their close similarity.
Summary statistics for all Northern and Trent preterm babies born in 2000–3/4 without a lethal malformation
Predicting survival at birth
Among the 1434 Northern liveborn babies (omitting the 22 stillborn infants alive at the onset of labour), gestation was the single strongest predictor of survival, with OR 2.0 (95% CI 1.8 to 2.2) per extra week of gestation. So increasing gestation by just 7 days doubled the odds of survival, which justifies documenting gestation to the day. The area under the ROC curve (AUC) was 0.868. There was also a significant quadratic gestation effect, so that an extra week’s gestation had a greater impact on the odds of survival at 24 weeks than at 31 weeks (p = 0.01). At approximately 24 weeks’ gestation just 5 extra days doubled the odds of survival.
After adjustment for gestation the birth weight z score was also highly predictive, but like gestation its relation to survival was non-linear. For a given gestation, the odds of survival were greatest for infants with birth weight just above the median, and less for relatively heavier or lighter infants (p = 0.006). There was also a marginally significant interaction between gestation and birth weight, such that the weight centile for optimal survival fell with increasing gestation. Survival was also slightly less in male than female infants (OR 0.66, 95% CI 0.45 to 0.96). Table 2 (left block) summarises the model, presenting the coefficients as log odds with standard errors and p values. The AUC of 0.879 was slightly greater than for gestation alone.
Coefficients of logistic regression models predicting survival to term, based on Northern and Trent preterm liveborn babies
The birth model was also fitted to the Trent data and the combined regional data. All the terms except sex were significant in Trent (see table 2, middle and right blocks), and all the coefficients except birth weight were similar by region (table 2, right column). As the combined sex effect was only weakly significant (p = 0.03) it was omitted. Adjusted for gestation and birth weight, survival in the two regions was similar (p = 0.2). Therefore, essentially the same model fitted both regions, justifying pooling the data.
Graphing the birth model
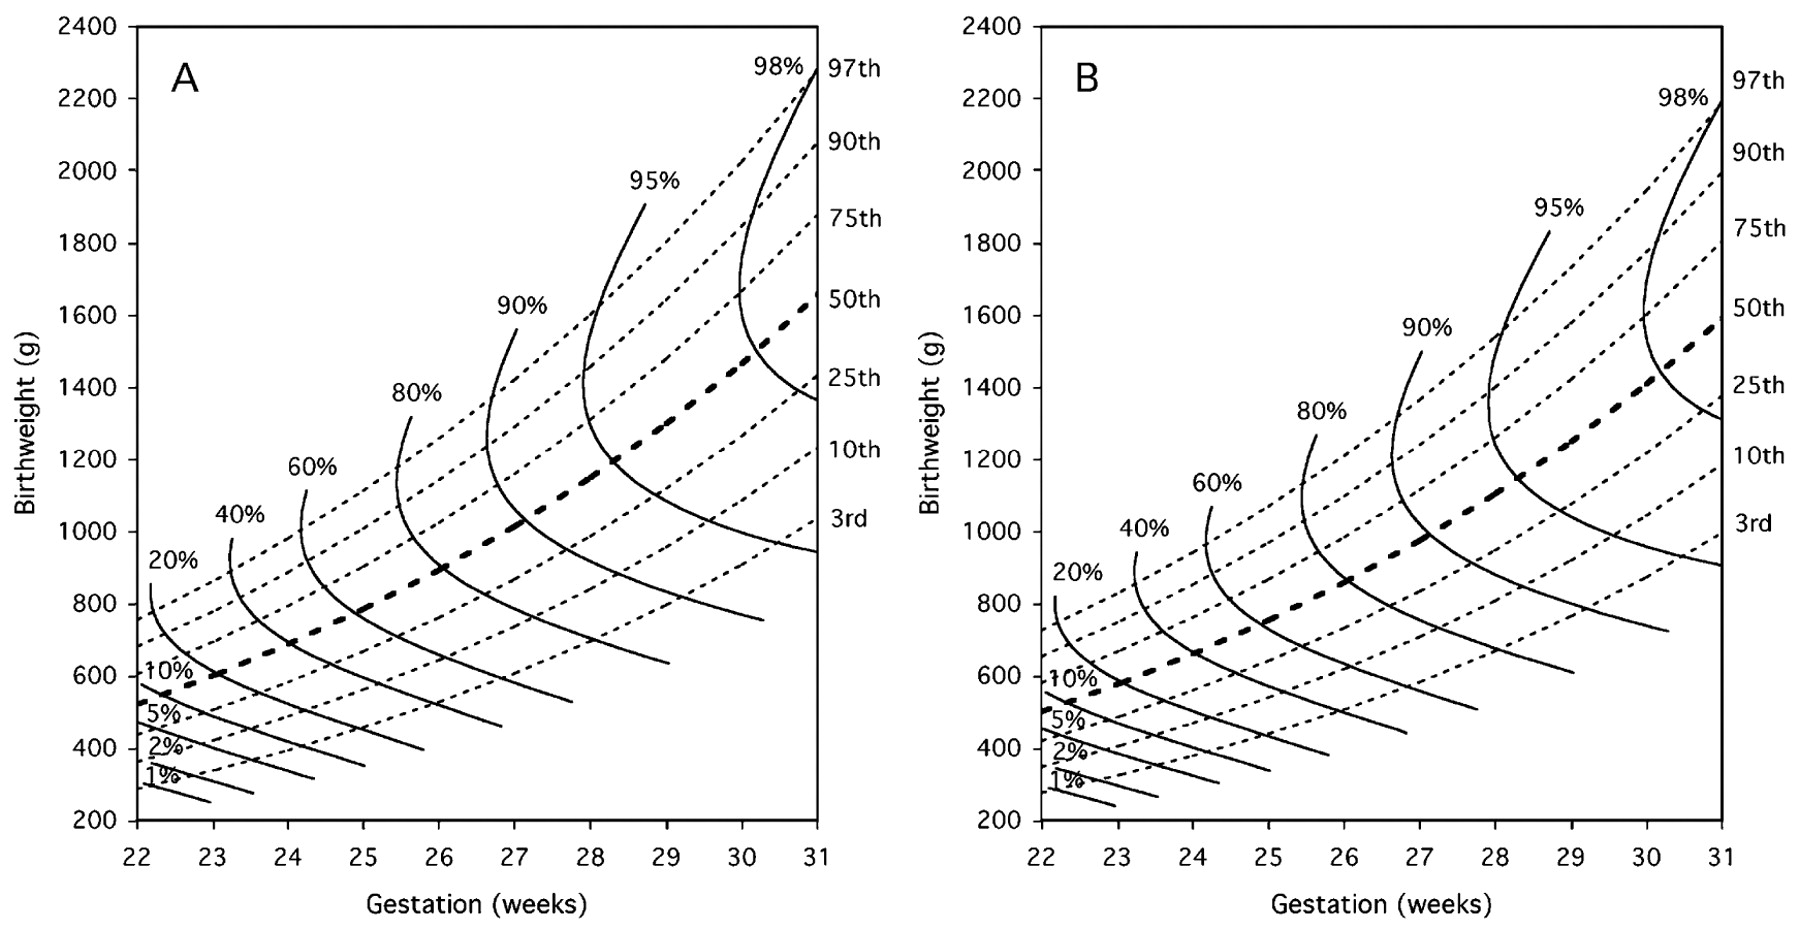
Despite its apparent complexity, the birth model depends on just the gestation and birth weight centile. As such it can be displayed in a graph, shown in fig 1 for the combined data (table 2). The isosurv curves reflect the survival experience of infants for different combinations of gestation and birth weight centile, ranging from 1% expected survival on the 3rd centile at 22 weeks, through to greater than 98% expected survival on the 75th centile at 31 weeks. The same graph can be plotted on the birth weight scale, as seen in fig 2A and fig 2B for boys and girls. The boys graph is shifted upwards by 4% relative to the girls, this being the sex difference in the birth weight centiles (see table W1, available online only). The graphs highlight the curvilinear relation between weight centile and survival, and the optimal weight centile for survival (at the point where the isosurv is vertical) falls with increasing gestation, from above the 97th centile at 22 weeks to below the 75th centile at 31 weeks. Birth weight has the greatest impact on survival in the most preterm babies, eg, expected survival at 22 weeks ranges from 1% on the 3rd centile up to nearly 20% on the 97th centile.

The influence of gestation and weight-for-gestation at birth on the chance of survival to term in babies of 22–31 weeks’ gestation born in the Northern and Trent regions in 2000–3/4. The curved lines (“isosurvs”) join points where the predicted chance of survival is constant.

The influence of gestation and birth weight on the chance of survival to term in (A) boys and (B) girls of 22–31 weeks’ gestation born in the Northern and Trent regions in 2000–3/4.
Predicting survival at birth, including condition
Base deficit, a measure of acidosis, was highly significant when added to the birth model, with OR 0.89 (95% CI 0.86 to 0.93) per mmol/l increase (see table 3). Its inclusion rendered insignificant the two birth weight terms, and omitting them hardly affected the AUC (table 3). Figure 3 shows the birth-condition model as isosurvs related to gestation and base deficit.

The influence of gestation and base deficit at birth on the chance of survival to term in babies of 22–31 weeks’ gestation born in the Northern region in 2000–3.
Coefficients of logistic regression models predicting survival to term, based on 1434 Northern preterm liveborn babies
Predicting survival at the onset of labour
To test the predictive value of information available at the onset of labour, the birth model was refitted using known gestation and an imputed “noisy” birth weight z score. This mimics the use of an ultrasound-based estimate of fetal weight. The results for this labour model are shown in table 4 for the two regions combined, as there were no significant interactions by region (see final column). All the coefficients were highly significant, as before, although the squared weight z score coefficient was halved in size relative to table 2, reflecting the loss of information due to the added noise. Therefore, even based on a predelivery estimate of birth weight, the odds of survival were significantly greater for babies around the 75th centile compared with those appreciably lighter or heavier, as shown in fig 4A and fig 4B for boys and girls. The AUC of 0.882 for the labour model was the same as for the birth model.

The influence of gestation and estimated prenatal birth weight, at the onset of labour or delivery, on the chance of survival to term in (A) boys and (B) girls of 22–31 weeks’ gestation born in the Northern and Trent regions in 2000–3/4.
Coefficients of logistic regression models predicting survival to term, based on Northern and Trent preterm babies alive at onset of labour or delivery
Discussion
Our findings
The chance of a very preterm baby surviving to term is known to depend on their gestation and size for gestation.1 Here we demonstrate the complex relationship between survival, gestation and birth weight, and show how the relationship can be presented graphically with isosurvs, contours of constant predicted survival, in a plot of gestation versus birth weight. It highlights the fact that for a given gestation there is an optimal birth weight centile for survival (figs 1 and 2), where the isosurv is vertical. Predictions made before delivery, using simulated ultrasound-based fetal weight assuming 15% random error,14 are almost as accurate as predictions using weight at birth (fig 4). We acknowledge though that the simulation relies on some strong assumptions about birth weight prediction in the very preterm. Base deficit in cord blood is even more predictive of survival than birth weight centile (table 3, fig 3). Such knowledge reduces the uncertainty of preterm birth for parents, and may be useful to the obstetrician and midwife for management purposes. All the models have areas under the ROC curve of 0.88–0.90, indicating strong discriminatory power, so they are a compact and effective way of adjusting for case mix. We call the isosurv graphs and the underlying logistic regression models the prematurity risk evaluation measure or PREM score.
One clear message to emerge from the analysis is the importance of measuring gestation to the day rather than the last completed week, as it makes a considerable difference to the odds of survival in the most preterm babies. This emphasises the need to document gestation with greater care than has been common in the past.11
Other datasets have shown similar relationships to ours,1 2 although studies that have investigated birth weight rather than birth weight z-score have failed to detect the quadratic trend.1 5 16 The fitted model coefficients are closely similar in the two regions, which validates the use of the PREM score more generally. It also confirms the earlier findings for the two regions referred to in the second paragraph.8 9 It can be applied to other datasets as it stands (tables 2 and 4), or alternatively it can be updated using new data. As an example it can be used to highlight and explain trends in survival over time. A recent paper based on data from the Trent region17 showed that for babies born at 22–25 weeks’ gestation, survival to discharge improved considerably between 1994–9 and 2000–5 in those born at 24–25 weeks, but not in those of 22–23 weeks. This echoes a similar message from 10 years ago.18 Presenting these data in the form of a PREM score isosurv graph would show exactly how the trends in survival over time related to gestation and birth size. Our earlier work with the PREM score showed that the model consistently fitted well, but that the coefficients changed over time.8 9
Converting birth weight to a z score is an important element of the PREM score regression model, and the birth weight reference used here was that of Tin et al.12 The results are likely to be similar with other references, although it is important that they extend down to 22 weeks to include the most preterm and thus most vulnerable babies. Presenting the isosurvs plotted against birth weight (fig 2) rather than centile (fig 1) avoids the need to convert individual birth weights to centiles, and makes the choice of reference largely academic.
Base deficit is a third potent predictor of survival, adjusting for severe acidosis, and its inclusion avoids the need to adjust for weight. This indicates that acidosis is more common in babies that are relatively light or heavy for gestation. Fig 3 shows how the impact of base deficit on survival varies by gestation—at early gestations it is small, the isosurvs being nearly vertical, whereas at later gestations, where the isosurvs are shallower, it has a much bigger effect.
There was a marginally significant effect of sex in the Northern region, corresponding to two fewer days of gestation in boys compared with girls, but it did not affect the model’s AUC, and was not significant in Trent, so for generalisability it was omitted from the final model. Therefore, for a given birth weight centile, survival was similar in the two sexes. However, girls weigh less than boys, their median birth weight being 4% down (table W1, available online only), so that in absolute birth weight terms girls had better survival.
Strengths and weaknesses
A strength of the study is that the data consisted of all preterm births in two geographical regions over a specified time period, and therefore the results are likely to be widely generalisable.
A weakness is that, although scoring systems such as the PREM score are good at assessing survival, they are poor at predicting serious disability in survivors. Although disability is common,19 no system that uses information available only at delivery has yet proved capable of predicting disability-free survival with an AUC above 0.77.20 The scoring system recently reported by the American Neonatal Research Network only predicted this to 20 months with an AUC of 0.75,16 and the authors of earlier scoring systems specifically argued against their use to influence the management of individual children.4 20 21 It is inevitable though that predictions based on 22–25 weeks’ gestation16 will have an appreciably lower AUC than predictions such as the PREM score based on 22–31 weeks’ gestation, when the spectrum of mortality risk is much wider.
The predictive power of the PREM score is comparable to that of the other neonatal scoring systems proposed to date, but it does not require the collection of any non-standard information. The inclusion of admission temperature in the current CRIB score has been criticised for that very reason.21 22 23 Nor is the PREM score manipulable by the exclusion of babies judged too ill to merit admission to the neonatal unit at birth. Whereas base deficit in cord blood, unlike the Apgar score,24 provides objective information on the child’s condition at delivery, the labour version of the PREM score that we advocate (which does not use base deficit) reflects an assumption that it is the combined impact of intrapartum and postpartum care that should normally be under review. The recent MOSAIC study report comparing mortality in 10 countries across Europe takes a similar view: “We believe that the standard point of comparison should be using all those infants alive at the onset of labour as the denominator for comparisons of mortality rates for very preterm infants analysing the cohort by gestational age band.”25
Conclusions
We provide a logistic regression model and a graphical summary of the impact of gestation and birth size on survival in very preterm infants, which we believe should be useful for education, management, case mix adjustment and the interpretation of trends over time.
Acknowledgments
The authors acknowledge their debt to the members of the Northern Neonatal Network who helped with the collection of the 2000–3 data; to Dr Brad Manktelow, Professor Liz Draper and Professor David Field for access to data on births in the Trent region in 2000–4, and to Mr Angus McNay, former statistician to the Northern RHA, for his help with the development of the early versions of the PREM score. The authors are also grateful to Professor Neil Marlow, Professor Liz Draper, Professor KS Joseph and Dr Ida Vogel for their helpful comments on earlier versions of the paper.
REFERENCES
Supplementary materials
Web Only Data 95/1/F14
Files in this Data Supplement:
Footnotes
Contributors: EH and SR conceived the study and obtained the data. TJC did the analyses. EH wrote the first draft of the paper, TJC revised it and all authors contributed to the final version. EH will act as guarantor of the paper.
Funding TJC is funded by Medical Research Council grant G0700961. Some of this work was undertaken at GOSH/UCL Institute of Child Health, which received a proportion of funding from the Department of Health’s NIHR Biomedical Research Centres funding scheme. Neither funder had any influence on the writing of the paper. Neither other author received any funding to collect the data for this or the earlier studies.
Competing interests None.
Provenance and Peer review Not commissioned; externally peer reviewed.
Ethics approval Ethics approval for prospective data collection to develop this scoring system in babies of less than 32 weeks’ gestation born to mothers resident in the north of England was obtained from the 16 district ethics committees in 1989. Similar approval was obtained from all the committees in the Trent region in 1994.
Contributors: EH and SR conceived the study and obtained the data. TJC did the analyses. EH wrote the first draft of the paper, TJC revised it and all authors contributed to the final version. EH will act as guarantor of the paper.
Linked Articles
- Fantoms